NAS100USD: SMT Divergence Hints at Potential ReversalGreetings Traders,
In today’s analysis of NAS100USD, although the current market structure reflects bearish institutional order flow, there are growing signs that a potential reversal may be forming.
Key Observations:
1. Smart Money Technique (SMT) Divergence:
We are currently observing SMT divergence—a strategy where the underlying asset (NAS100) is compared against its benchmark (US500). These indices typically maintain a 90–100% correlation. However, when this correlation breaks down, it often signals that a reversal may be imminent. In this case, while NAS100 continues to show bearish momentum, the divergence from US500 suggests the possibility of bullish interest building.
2. Institutional Support at the Rejection Block:
Further confluence for a potential reversal lies in the presence of a rejection block acting as a strong institutional support level. This is a zone where smart money previously defended price, and if confirmed, it could provide an optimal entry for long positions.
Trading Plan:
We will monitor the rejection block for confirmation of bullish intent before entering any trades. If confirmed, the idea is to target the buy-side liquidity residing in premium pricing zones.
Invalidation Level : This reversal idea will be invalidated if NAS500 breaks below its most recent swing low.
Stay alert for confirmation, and always ensure the idea fits within your broader trading framework.
Kind regards,
The Architect
Us500

S&P500 Stuck between the 1D MA50 and 1D MA200.The S&P500 index (SPX) is now on a short-term correction following the impressive recovery of the last 30 days that made it almost test its 1D MA200 (orange trend-line). This is a technical rejection but the fact that the 1D MA50 (blue trend-line) is now the Support can be encouraging.
The reason is that since January 2023, every time the index broke above its 1D MA50 it turned into a Support that held and produced an immediate bullish extension on every occasion except for one time (Sep 2024), which still recovered 1 week after.
As a result, it is more likely for SPX to test its All Time High (ATH) by July than entering a long-term correction again.
-------------------------------------------------------------------------------
** Please LIKE 👍, FOLLOW ✅, SHARE 🙌 and COMMENT ✍ if you enjoy this idea! Also share your ideas and charts in the comments section below! This is best way to keep it relevant, support us, keep the content here free and allow the idea to reach as many people as possible. **
-------------------------------------------------------------------------------
Disclosure: I am part of Trade Nation's Influencer program and receive a monthly fee for using their TradingView charts in my analysis.
💸💸💸💸💸💸
👇 👇 👇 👇 👇 👇

S&P500 INTRADAY resistance at 5510US stock futures are signaling a second straight day of losses. Palantir shares dropped 9% pre-market after its earnings disappointed high expectations. Ford also fell, withdrawing its financial guidance and warning that new tariffs would hurt profitability.
In Europe, political uncertainty hit German markets as Friedrich Merz failed to secure a majority vote to become Germany’s next chancellor, delaying his swearing-in and shaking investor confidence. The DAX index slid 1.4% on the news.
Meanwhile, EU-US trade tensions are intensifying. The European Union expects new US trade probes could expose up to €549 billion ($622 billion) worth of EU exports to American tariffs, adding pressure to already strained transatlantic negotiations.
Key Support and Resistance Levels
Resistance Level 1: 5693
Resistance Level 2: 5780
Resistance Level 3: 5876
Support Level 1: 5512
Support Level 2: 5438
Support Level 3: 5390
This communication is for informational purposes only and should not be viewed as any form of recommendation as to a particular course of action or as investment advice. It is not intended as an offer or solicitation for the purchase or sale of any financial instrument or as an official confirmation of any transaction. Opinions, estimates and assumptions expressed herein are made as of the date of this communication and are subject to change without notice. This communication has been prepared based upon information, including market prices, data and other information, believed to be reliable; however, Trade Nation does not warrant its completeness or accuracy. All market prices and market data contained in or attached to this communication are indicative and subject to change without notice.

US100 - Perfect Long Opportunities Unfolding?This chart illustrates a high-probability bullish setup based on a combination of market structure shifts, fair value gaps (FVGs), Fibonacci retracement confluence, and order block interaction. We are analyzing the US Tech 100 on the 1-hour timeframe, focusing on recent price action development and a potential reversal scenario forming after a corrective move.
Context and Market Structure:
Price action has been in a corrective downtrend after printing a local high near the 19,950–20,000 range. This move led to a break in short-term bullish structure as sell-side liquidity was swept. A series of bearish candles followed, confirming a shift in momentum to the downside.
However, the retracement stalled upon entering a prior area of imbalance—highlighted here as a larger fair value gap (FVG) zone. This FVG zone acted as a significant demand area, with price reacting strongly upon entry. The zone is marked with a light blue shaded rectangle and aligns with a 1-hour bullish order block.
Price created a swing low in this FVG area before forming higher lows, suggesting the possibility of a short-term reversal.
Golden Pocket & Liquidity Sweep:
A key zone of interest is the "Golden Pocket downtrend" area, which is derived from the 0.618–0.65 Fibonacci retracement levels of the last impulse down. Price previously respected this zone, leading to a rejection and continuation lower. This makes it a notable supply area. Price may revisit this zone as a target or potential reaction point on the next bullish leg.
Note how the initial reaction from the FVG brought the market back into a smaller 1H FVG, situated just beneath the 0.5 retracement level. The internal structure within this zone supports a bullish outlook due to the formation of a higher low followed by a bullish engulfing candle.
Fibonacci Confluence & Execution Levels:
The 0.618 Fibonacci retracement level of the recent move aligns closely with the midpoint of the bullish FVG, providing confluence for a potential re-entry or continuation point. This level is annotated on the chart and highlighted with a horizontal line labeled "0.618 - Entry." This suggests it may act as a magnet for price before further continuation to the upside.
The 0.786 retracement level, also plotted on the chart, indicates the deeper end of the retracement spectrum and lies just above a major structural low. This region, though aggressive, would represent a final line of defense for bullish continuation.
Projection and Price Path:
Based on the current structure and bullish reaction from the FVG zone, a potential price path is drawn on the chart. It suggests one more liquidity grab into the FVG area followed by an impulsive move to the upside.
The blue projection line outlines a potential retracement to fill the nearby FVG (which remains partially unmitigated), followed by a resumption of bullish momentum that targets a revisit to the previous high area around 19,875.
Additional Notes:
* Multiple FVGs are actively interacting in this region, giving layered confluence for demand zones.
* The reaction from the FVG zone is coupled with a bullish engulfing pattern on the 1-hour timeframe, signaling aggressive buying.
* Price remains above the internal bullish structure despite the earlier rejection from the Golden Pocket area.
Conclusion:
The chart setup represents a textbook example of FVG demand zone reaction, supported by Fibonacci confluence and market structure shifts. As price consolidates above this key FVG, a continuation to the upside becomes a strong probability if the internal structure remains intact. Traders should monitor price behavior on lower timeframes as it interacts with the 0.618 and FVG zones for confirmation of bullish continuation.

S&P500 INTRADAY ahead of NFP, resistance at 5670The bulls are firmly in control as the S&P 500 heads for its ninth straight daily gain—the longest winning streak since 2004. Optimism is fuelled by:
Expectations of Fed rate cuts due to soft economic data
Hopes for renewed US-China trade talks, easing geopolitical risk
Strong risk appetite, with Bitcoin nearing $100,000 and equity momentum building
Key Risk Today – US Jobs Report:
April Nonfarm Payrolls expected at +138K, down from March’s strong beat
This is the first major labor data since new US tariffs, and could shift market expectations for Fed policy
Conclusion for S&P 500 Traders:
Momentum is bullish, but today’s NFP report is a key risk event. A weaker-than-expected jobs number could reinforce rate cut bets and extend the rally. A surprise beat may trigger profit-taking.
Key Support and Resistance Levels
Resistance Level 1: 5670
Resistance Level 2: 5740
Resistance Level 3: 5820
Support Level 1: 5440
Support Level 2: 5385
Support Level 3: 5316
This communication is for informational purposes only and should not be viewed as any form of recommendation as to a particular course of action or as investment advice. It is not intended as an offer or solicitation for the purchase or sale of any financial instrument or as an official confirmation of any transaction. Opinions, estimates and assumptions expressed herein are made as of the date of this communication and are subject to change without notice. This communication has been prepared based upon information, including market prices, data and other information, believed to be reliable; however, Trade Nation does not warrant its completeness or accuracy. All market prices and market data contained in or attached to this communication are indicative and subject to change without notice.

S&P500 1st 4H Golden Cross since Jan could be a TRAP!S&P500 (SPX) completed yearly today its first Golden Cross on the 4H time-frame since January 23. That formation issued an immediate pull-back but technically it's not very similar to the today's as that was formed after an All Time High (ATH) while now we are on the recovery phase after March's massive Trade War fueled correction.
The 4H Golden Cross however that looks more similar to the current is the one before January's, the August 21 2024. That was formed after a substantial market pull-back, though again not as strong as March's. Still, the 1D RSI patterns are also more similar and that again should keep us on high alert as 2 weeks later the index pulled back to the 0.5 Fibonacci retracement level from its previous High Resistance.
As a result, if we see the price now turning sideways for a week or so, we will give higher probabilities for a short-term pull-back, maybe not as low as the 0.5 Fib but at least to the 5450 region, before the market takes off to 6000.
-------------------------------------------------------------------------------
** Please LIKE 👍, FOLLOW ✅, SHARE 🙌 and COMMENT ✍ if you enjoy this idea! Also share your ideas and charts in the comments section below! This is best way to keep it relevant, support us, keep the content here free and allow the idea to reach as many people as possible. **
-------------------------------------------------------------------------------
Disclosure: I am part of Trade Nation's Influencer program and receive a monthly fee for using their TradingView charts in my analysis.
💸💸💸💸💸💸
👇 👇 👇 👇 👇 👇

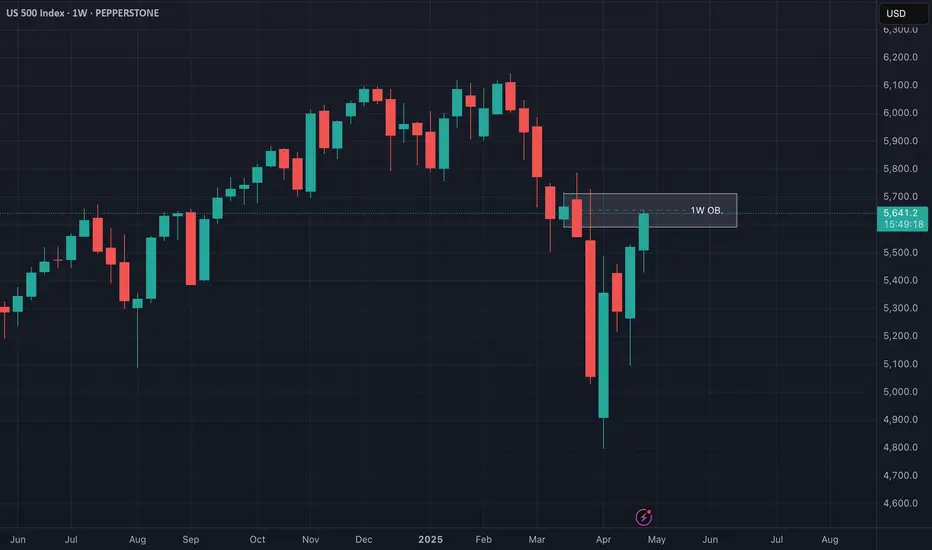
US500 Reversal Zone? My Thought Process Explained 🎯 📉 Earlier today I posted an analysis on the US500, highlighting how price has traded into a weekly bearish order block 🧱 — a key distribution zone where I believe smart money could look to unwind positions. The market is currently overextended and sitting at a premium, which raises the risk of a potential aggressive retrace 🔄, especially heading into the weekend. ⚠️
💭 Here's a video where I break down that exact setup and walk you through my full thought process, including why I’m exercising extreme caution at these levels and what I’m looking for in terms of confirmation.
📚 As always, this is for educational purposes only — not financial advice. 🚫💼

US500 at Critical Resistance - Weekly Chart Breakdown📊 US500 Weekly Chart Analysis
Taking a close look at the US500 on the weekly timeframe, we can see price has now traded directly into a bearish weekly order block 🧱 — a key distribution zone where smart money activity often emerges. At this level, the market is trading at a premium 💰 and appears to be overextended 📈.
⚠️ From a risk management standpoint, I’d advise extreme caution — the current conditions could set the stage for a sharp retracement, especially as we approach week’s end. This level aligns with areas where institutional players may look to offload risk or reverse exposure.
🔁 A potential pullback from here would not be surprising, given the elevated context and technical structure.
📚 This breakdown is for educational purposes only and should not be considered financial advice.
S&P500 INTRADAY resistance at 5670Tech Surge Lifts Markets:
Strong earnings from Microsoft (+7.8%) and Meta (+6.2%) are driving early market optimism. Both beat revenue expectations, easing concerns about trade war impacts.
→ S&P 500 futures up over 1%.
Trade Deal Hopes:
Sentiment is boosted by signs that President Trump may soon announce initial trade agreements, reducing geopolitical risk.
Bank of Japan Dovish Shift:
The BoJ cut its growth forecast and delayed its inflation target, signaling caution.
Yen fell as much as 1.2%.
US-Ukraine Investment Deal:
The US secured privileged access to Ukraine’s natural resources, potentially helping ease tensions as part of broader efforts to end the war.
Earnings Watch:
Before Open: Mastercard, Estee Lauder, Eli Lilly, Moderna, McDonald’s
After Close: Apple, Amazon, Amgen, Airbnb, Reddit
Key Support and Resistance Levels
Resistance Level 1: 5670
Resistance Level 2: 5740
Resistance Level 3: 5820
Support Level 1: 5440
Support Level 2: 5385
Support Level 3: 5316
This communication is for informational purposes only and should not be viewed as any form of recommendation as to a particular course of action or as investment advice. It is not intended as an offer or solicitation for the purchase or sale of any financial instrument or as an official confirmation of any transaction. Opinions, estimates and assumptions expressed herein are made as of the date of this communication and are subject to change without notice. This communication has been prepared based upon information, including market prices, data and other information, believed to be reliable; however, Trade Nation does not warrant its completeness or accuracy. All market prices and market data contained in or attached to this communication are indicative and subject to change without notice.

US500 - Long-Term Long!Hello TradingView Family / Fellow Traders. This is Richard, also known as theSignalyst.
📈US500 has been overall bullish trading within the rising channel marked in blue.
Moreover, it is retesting its previous all-time high at $4,800 and round number $5,000.
🏹 Thus, the highlighted blue circle is a strong area to look for buy setups as it is the intersection of previous ATH and lower blue trendline acting as a non-horizontal support.
📚 As per my trading style:
As #US500 approaches the blue circle zone, I will be looking for bullish reversal setups (like a double bottom pattern, trendline break , and so on...)
📚 Always follow your trading plan regarding entry, risk management, and trade management.
Good luck!
All Strategies Are Good; If Managed Properly!
~Rich
Disclosure: I am part of Trade Nation's Influencer program and receive a monthly fee for using their TradingView charts in my analysis.

S&P500 INTRADAY resistance at 5510A wave of earnings reports is due today, with Microsoft and Meta in focus. The tech sector remains under pressure, highlighted by a 15% drop in Super Micro Computer after disappointing results.
In Europe, banks are seeing strong revenue growth, benefiting from recent market volatility linked to Trump’s trade policies. However, Mercedes and Stellantis have joined the list of companies withdrawing guidance due to uncertainty.
Donald Trump has again criticized Fed Chair Jerome Powell and defended his tariff strategy during an event marking his 100th day in office. Investors are now awaiting key US data, including inflation and GDP figures.
Meanwhile, China’s factory activity has contracted to its lowest level since December 2023, signaling the early impact of US tariffs and increasing pressure for government stimulus.
US consumer companies are also sounding cautious, pointing to a weaker economic outlook ahead.
Key Support and Resistance Levels
Resistance Level 1: 5670
Resistance Level 2: 5740
Resistance Level 3: 5820
Support Level 1: 5380
Support Level 2: 5310
Support Level 3: 5236
This communication is for informational purposes only and should not be viewed as any form of recommendation as to a particular course of action or as investment advice. It is not intended as an offer or solicitation for the purchase or sale of any financial instrument or as an official confirmation of any transaction. Opinions, estimates and assumptions expressed herein are made as of the date of this communication and are subject to change without notice. This communication has been prepared based upon information, including market prices, data and other information, believed to be reliable; however, Trade Nation does not warrant its completeness or accuracy. All market prices and market data contained in or attached to this communication are indicative and subject to change without notice.

US500 TRADE IDEAhi again
The US500 has shown strength by breaking the resistance at 5483.5 and is now at 5535. If the price reaches 5604.6 and a pullback occurs, targeting a temporary decline at the 50% Fibonacci retracement level is a good strategy.
Fibonacci retracement is often used to identify potential support and resistance levels where the price might pause or reverse. The 50% level is one of the commonly watched levels by traders as it often indicates a significant turning point in price movement.
good luck all
**My trading strategy is not intended to be a signal. It's a process of learning about market structure and sharpening my trading my skills also for my trade journal**
Thanks a lot for your support

S&P500 repeating the 2019 recovery-Can hit 7000.The S&P500 index (SPX) is making a remarkable recovery as it completed yet another strong 1W green candle last week following the rebound on its Higher Lows Zone, near the 1W MA200 (orange trend-line).
This is a mirror price action with the last 1W MA200 rebound of the 2016 - 2019 Bullish Megaphone pattern, which not only recovered its previous All Time High (ATH) but also peaked on the 1.618 Fibonacci extension before the eventual 2020 COVID crash.
As a result, we believe that a 7000 Target is a very plausible one on the long-term.
-------------------------------------------------------------------------------
** Please LIKE 👍, FOLLOW ✅, SHARE 🙌 and COMMENT ✍ if you enjoy this idea! Also share your ideas and charts in the comments section below! This is best way to keep it relevant, support us, keep the content here free and allow the idea to reach as many people as possible. **
-------------------------------------------------------------------------------
Disclosure: I am part of Trade Nation's Influencer program and receive a monthly fee for using their TradingView charts in my analysis.
💸💸💸💸💸💸
👇 👇 👇 👇 👇 👇

S&P500 INTRADAY resistance at 5510Earnings season heats up with major companies like Visa, Coca-Cola, Starbucks, UPS, and Pfizer reporting results. In Europe, HSBC announced a $3 billion share buyback, while BP shares dropped due to weaker cash flow.
In Canada, the Liberal Party is set to win a fourth term, but likely without a majority, which could lead to a coalition-style government.
Meanwhile, the Trump administration plans to ease auto tariffs on foreign parts used in U.S.-made vehicles, boosting Ford and GM shares in premarket trading.
Market Impact:
Watch for shifts in trade-sensitive sectors, supply chain plays (especially in tech), and defense stocks as geopolitical risk evolves.
Key Support and Resistance Levels
Resistance Level 1: 5670
Resistance Level 2: 5740
Resistance Level 3: 5820
Support Level 1: 5380
Support Level 2: 5310
Support Level 3: 5236
This communication is for informational purposes only and should not be viewed as any form of recommendation as to a particular course of action or as investment advice. It is not intended as an offer or solicitation for the purchase or sale of any financial instrument or as an official confirmation of any transaction. Opinions, estimates and assumptions expressed herein are made as of the date of this communication and are subject to change without notice. This communication has been prepared based upon information, including market prices, data and other information, believed to be reliable; however, Trade Nation does not warrant its completeness or accuracy. All market prices and market data contained in or attached to this communication are indicative and subject to change without notice.

S&P500: Buying accelerating as the bottom is confirmed.S&P500 is neutral on its 1D technical outlook (RSI = 52.628, MACD = -41.490, ADX = 32.588) as it has been volatile during the day but on the long-term, it has resumed the bullish trend, making a strong recovery last week. The bottom is now confirmed (above the 1W MA200) and as the oversold 1W RSI was bought, the index eyes a +28.50% rise on the medium term, same as in early 2024. This falls practically on the previous ATH level (TP = 6,150).
## If you like our free content follow our profile to get more daily ideas. ##
## Comments and likes are greatly appreciated. ##

SPX 500 turns lower ahead of busy weekAhead of a busy week, the S&P 500 has found resistance at a key area of resistance near 5550. The Index had rallied in the previous three sessions, but with trade and economic uncertainty still at the forefront, investors are not rushing to chase this rally - and rightly so. May be they will still buy the dip as we head deeper into the week, though, given Trump's change of tone and optimism surrounding trade deals. For me the key support area to watch is around 5,300, but other areas of support including 5840 and 5400.
Beyond trade negotiations and trade concerns, a flood of traditional economic data is set to be released this week. Key highlights include PMI surveys from China and the US, first-quarter US GDP, the Bank of Japan’s policy meeting on Thursday, and the critical US nonfarm payrolls report on Friday. On top of all that, it’s the biggest week of earnings season, featuring results from Microsoft and Meta after Wednesday’s close, and from Apple and Amazon—four members of the so-called “Magnificent Seven”—reporting on Thursday.
By Fawad Razaqzada, market analyst with FOREX.com

US500 Will Go Down From Resistance! Short!
Take a look at our analysis for US500.
Time Frame: 9h
Current Trend: Bearish
Sentiment: Overbought (based on 7-period RSI)
Forecast: Bearish
The market is on a crucial zone of supply 5,525.49.
The above-mentioned technicals clearly indicate the dominance of sellers on the market. I recommend shorting the instrument, aiming at 5,306.14 level.
P.S
We determine oversold/overbought condition with RSI indicator.
When it drops below 30 - the market is considered to be oversold.
When it bounces above 70 - the market is considered to be overbought.
Disclosure: I am part of Trade Nation's Influencer program and receive a monthly fee for using their TradingView charts in my analysis.
Like and subscribe and comment my ideas if you enjoy them!

S&P 500 E-mini Futures: Bullish Momentum Meets Key Resistance📈 Technical Analysis: S&P 500 E-mini Futures (ES1!) – April 2025
🚀 Market Structure & Price Action for US500
The daily chart shows the S&P 500 E-mini Futures in a bullish recovery after a significant correction. The recent rally has pushed price back toward previous swing highs, an area likely to contain resting buy-side liquidity. This move suggests that the market is currently in a markup phase, but is now approaching a critical resistance zone where profit-taking and counter-trend activity may emerge.
🧠 Wyckoff Perspective
From a Wyckoff methodology standpoint, the recent price action resembles a classic accumulation-to-markup transition. The sharp selloff in March and early April appears to have formed a selling climax (SC) followed by an automatic rally (AR) and a secondary test (ST). The current advance could be interpreted as a sign of strength (SOS), but the proximity to previous highs raises the risk of an upthrust (UTAD) or a bull trap if supply emerges.
🌊 Liquidity & Potential Pullback
As price trades into the prior highs, it is likely "eating" buy-side liquidity—triggering stops and breakout orders. This process often leads to a liquidity sweep, where price briefly exceeds resistance before reversing as large players offload positions. If the market fails to sustain above these highs, a pullback or even a reversal could be initiated, especially if volume and momentum wane.
🌐 Market Sentiment & Fundamentals
Current sentiment remains cautiously optimistic, with the S&P 500 E-mini trading above 5,500 and recent sessions showing resilience despite mixed earnings and macroeconomic uncertainty. The broader market is supported by expectations of stable Fed policy and robust corporate earnings, but there are persistent concerns about inflation and global growth. According to Markets Insider, the ES futures are up 0.59% recently, reflecting a positive but not euphoric tone. However, as noted by Investing.com, there are signs the market could be setting up for a reversal if bulls fail to maintain momentum.
🛠️ Trade Ideas
🟢 Bullish Scenario: If price breaks and holds above the previous highs with strong volume and closes, consider a long entry targeting the next psychological resistance (e.g., 5,700–5,800). Place stops just below the breakout level to manage risk. This would confirm continued demand and a potential extension of the markup phase.
🔴 Bearish Scenario: If price fails to hold above the highs and forms a reversal pattern (e.g., bearish engulfing, upthrust), look for a short entry targeting the first support zone (e.g., 5,300–5,200). Stops should be placed above the failed breakout. This would align with a Wyckoff upthrust after distribution and a likely liquidity sweep.
⚠️ Disclaimer
This analysis is for informational purposes only and does not constitute financial advice. Trading futures involves significant risk and may not be suitable for all investors. Please conduct your own research and consult with a licensed financial advisor before making any trading decisions.

S&P500 INTRADAY resistance at 5510Global Trade & Geopolitics
China may suspend steep tariffs on some U.S. imports, like medical equipment and ethane, to ease pressure on key industries—hinting at a more pragmatic trade stance.
Apple plans to shift most U.S. iPhone production to India by late next year, while Walmart is helping Chinese exporters sell locally—both reflecting efforts to reduce reliance on China.
U.S.-Russia-Ukraine: The U.S. will push for Russia to recognize Ukraine’s right to its own military in any peace deal. However, Trump suggests Ukraine may have to cede some territory. Meanwhile, reduced U.S. aid is increasing Ukraine’s exposure to Russian cyberattacks.
Market Impact:
Watch for shifts in trade-sensitive sectors, supply chain plays (especially in tech), and defense stocks as geopolitical risk evolves.
Key Support and Resistance Levels
Resistance Level 1: 5510
Resistance Level 2: 5660
Resistance Level 3: 5790
Support Level 1: 5110
Support Level 2: 4950
Support Level 3: 4815
This communication is for informational purposes only and should not be viewed as any form of recommendation as to a particular course of action or as investment advice. It is not intended as an offer or solicitation for the purchase or sale of any financial instrument or as an official confirmation of any transaction. Opinions, estimates and assumptions expressed herein are made as of the date of this communication and are subject to change without notice. This communication has been prepared based upon information, including market prices, data and other information, believed to be reliable; however, Trade Nation does not warrant its completeness or accuracy. All market prices and market data contained in or attached to this communication are indicative and subject to change without notice.

SP500 what to expect next?As a seasoned trader with over a decade of experience navigating the markets, I’ve been closely monitoring the S&P 500’s current price action. The index is presently confined within a well-defined range, with resistance at 5,528 and support at 5,146, based on recent price behavior. We’ve observed a notable deviation below the lower boundary of this range, which often signals a potential reversal or absorption of liquidity before a move higher.
My analysis suggests the next likely target is the upper boundary of the range at 5,528, coinciding with a weekly Fair Value Gap (FVG) that has yet to be filled. Should the price approach this zone, I anticipate a strong market reaction, potentially driven by aggressive order flow as participants defend or challenge this key level. If the weekly FVG is invalidated—meaning price sweeps through this area without significant rejection—the S&P 500 could be poised to break out and target new all-time highs from its current position.

US500 LIVEHello friends
Given the price rise and correction we had, we can open a position with capital and risk management.
*Trade safely with us*

S&P500 INTRADAY resistance at 5510Stocks are pulling back after Wednesday’s rally, pressured by renewed trade tensions. China stated that no deal talks are underway, and Treasury Secretary Scott Bessent expressed scepticism over resolving the trade dispute. US futures slipped, the dollar weakened, and gold rose as investors sought safety.
Jefferies strategist Christopher Wood warned that US equities, Treasuries, and the dollar may face further downside, noting the market has likely peaked. Deutsche Bank also trimmed its S&P 500 target, citing the negative impact of ongoing tariffs on US companies.
It’s a packed earnings day: PepsiCo, Procter & Gamble, and American Airlines report before the open, while Alphabet and Intel are set to release results after the close.
Key Support and Resistance Levels
Resistance Level 1: 5510
Resistance Level 2: 5660
Resistance Level 3: 5790
Support Level 1: 5110
Support Level 2: 4950
Support Level 3: 4815
This communication is for informational purposes only and should not be viewed as any form of recommendation as to a particular course of action or as investment advice. It is not intended as an offer or solicitation for the purchase or sale of any financial instrument or as an official confirmation of any transaction. Opinions, estimates and assumptions expressed herein are made as of the date of this communication and are subject to change without notice. This communication has been prepared based upon information, including market prices, data and other information, believed to be reliable; however, Trade Nation does not warrant its completeness or accuracy. All market prices and market data contained in or attached to this communication are indicative and subject to change without notice.

US500 - Will the stock market go up?!The index is located between the EMA200 and EMA50 on the four-hour timeframe and is trading in its descending channel. If the index moves down towards the specified demand zone, we can look for the next Nasdaq buying positions with an appropriate risk-reward ratio. The channel breakdown and the index entering the supply zone will provide us with its next selling position.
The chief economist at Citigroup has stated that the imposition of tariffs in the United States constitutes a stagflationary shock to the economy. According to his estimates, there is a 40% to 45% chance of a recession. It is expected that GDP will increase in the second quarter, as consumers rush to make purchases ahead of the new tariffs. However, the most significant negative impact on U.S. economic growth is projected to unfold in the second half of the year.
You may have noticed that recent economic statistics are no longer moving markets. The reason is simple: markets are forward-looking and trade on expectations rather than past data. Economic figures reflect what has already occurred, while market pricing focuses on what lies ahead.
At this stage, current data has yet to fully reflect the impact of tariffs and trade tensions. Even if weaker numbers emerge, markets may have already priced in the potential resolution of the trade war and an eventual recovery.
Experienced traders understand that today’s developments are already factored into prices. What matters now is the outlook for the coming months—the real driver of market direction.
Ryan Petersen of Flexport noted yesterday that, three weeks after the U.S.imposed heavy tariffs on Chinese imports, bookings for ocean freight containers have dropped more than 60% industry-wide. He explained that the U.S. imports around $600 billion worth of goods annually from China, with those items valued at approximately $2 trillion at the retail level.
He stated that the first ships carrying goods fully subject to the new tariffs arrived on Monday, and shipping volumes are expected to decline in the coming weeks. However, due to high inventory levels, the impact on the retail sector may be delayed.
Petersen also expressed concern that a potential rollback of tariffs could introduce a new set of challenges. With ships currently being repositioned globally, a sudden wave of new orders could disrupt logistics networks—especially if markets perceive the suspension of tariffs as only temporary.
In my view, no one really knows how this situation will evolve, as a large portion of imports consists of intermediate goods and components used in final products. My guess is that this could lead to a surge in transshipment and even smuggling, though it could just as easily echo the unexpected consequences seen during the COVID era. We are truly venturing into uncharted territory.
Petersen concludes: “This is a strange era for global logistics, as we must simultaneously prepare for the unimaginable—like full U.S. self-sufficiency—while also planning for a return to something closer to normal trade relations.”
