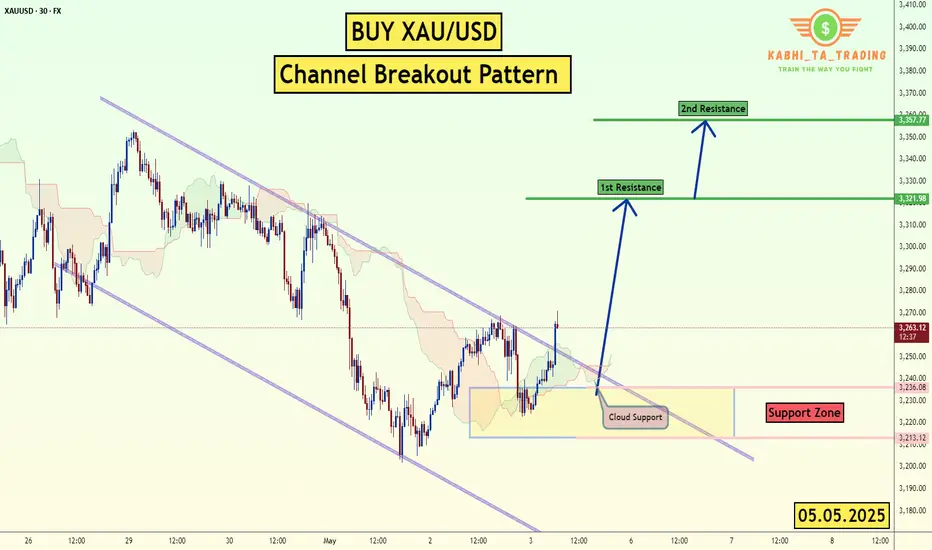
XAU/USD - Channel Breakout (05.05.2025)The XAU/USD pair on the M30 timeframe presents a Potential Buying Opportunity due to a recent Formation of a Channel Breakout Pattern. This suggests a shift in momentum towards the upside and a higher likelihood of further advances in the coming hours.
Possible Long Trade:
Entry: Consider Entering A Long Position around Trendline Of The Pattern.
Target Levels:
1st Resistance – 3321
2nd Resistance – 3357
🎁 Please hit the like button and
🎁 Leave a comment to support for My Post !
Your likes and comments are incredibly motivating and will encourage me to share more analysis with you.
Best Regards, KABHI_TA_TRADING
Thank you.
USD
EURO - Price can rise to top part of flat from support areaHi guys, this is my overview for EURUSD, feel free to check it and write your feedback in comments👊
Some time ago, price entered to wedge, where it bounced from support line and rose to $1.0860 level, breaking $1.0470 level.
Then price broke $1.0860 level too, but then it made correction to support line of wedge and then made upward impulse.
Euro exited from wedge and continued to grow to $1.1260 level, after which broke this level and started to trades in flat.
Inside flat, price rose to top part of flat and then made correction to support area, where it some time traded close.
At the moment, Euro trades inside support area, near support level, so, I think that price can correct to $1.1260 level.
After this movement, in my mind, EUR can start to grow to $1.1570 top part of the flat.
If this post is useful to you, you can support me with like/boost and advice in comments❤️

Bearish reversal?USD/JPY is rising towards the pivot which has been identified as an overlap resistance and could reverse to the 1st support which is a pullback support.
Pivot: 146.90
1st Support: 142.06
1st Resistance: 150.92
Risk Warning:
Trading Forex and CFDs carries a high level of risk to your capital and you should only trade with money you can afford to lose. Trading Forex and CFDs may not be suitable for all investors, so please ensure that you fully understand the risks involved and seek independent advice if necessary.
Disclaimer:
The above opinions given constitute general market commentary, and do not constitute the opinion or advice of IC Markets or any form of personal or investment advice.
Any opinions, news, research, analyses, prices, other information, or links to third-party sites contained on this website are provided on an "as-is" basis, are intended only to be informative, is not an advice nor a recommendation, nor research, or a record of our trading prices, or an offer of, or solicitation for a transaction in any financial instrument and thus should not be treated as such. The information provided does not involve any specific investment objectives, financial situation and needs of any specific person who may receive it. Please be aware, that past performance is not a reliable indicator of future performance and/or results. Past Performance or Forward-looking scenarios based upon the reasonable beliefs of the third-party provider are not a guarantee of future performance. Actual results may differ materially from those anticipated in forward-looking or past performance statements. IC Markets makes no representation or warranty and assumes no liability as to the accuracy or completeness of the information provided, nor any loss arising from any investment based on a recommendation, forecast or any information supplied by any third-party.

Potential bullish rise?The Aussie (AUD/USD) has bounced off the pivot which is a pullback support and could rise to the 1st resistance which has been identified as an overlap resistance.
Pivot: 0.6391
1st Support: 0.6258
1st Resistance: 0.6647
Risk Warning:
Trading Forex and CFDs carries a high level of risk to your capital and you should only trade with money you can afford to lose. Trading Forex and CFDs may not be suitable for all investors, so please ensure that you fully understand the risks involved and seek independent advice if necessary.
Disclaimer:
The above opinions given constitute general market commentary, and do not constitute the opinion or advice of IC Markets or any form of personal or investment advice.
Any opinions, news, research, analyses, prices, other information, or links to third-party sites contained on this website are provided on an "as-is" basis, are intended only to be informative, is not an advice nor a recommendation, nor research, or a record of our trading prices, or an offer of, or solicitation for a transaction in any financial instrument and thus should not be treated as such. The information provided does not involve any specific investment objectives, financial situation and needs of any specific person who may receive it. Please be aware, that past performance is not a reliable indicator of future performance and/or results. Past Performance or Forward-looking scenarios based upon the reasonable beliefs of the third-party provider are not a guarantee of future performance. Actual results may differ materially from those anticipated in forward-looking or past performance statements. IC Markets makes no representation or warranty and assumes no liability as to the accuracy or completeness of the information provided, nor any loss arising from any investment based on a recommendation, forecast or any information supplied by any third-party.

USDJPY - Long Done, Soon Short!Hello TradingView Family / Fellow Traders. This is Richard, also known as theSignalyst.
📈As per our last USDJPY analysis, it rejected the orange support zone and has been trading higher.
What's next? As USDJPY approaches the upper blue trendline, we will be looking for shorts.
🏹 The highlighted red circle is a strong area to look for sell setups as it is the intersection of the upper blue trendline and green supply zone.
📚 As per my trading style:
As #USDJPY retests the red circle zone, I will be looking for bearish reversal setups (like a double top pattern, trendline break , and so on...)
Meanwhile, USDJPY would remain bullish medium-term and a bullish continuation towards the red circle is expected.
📚 Always follow your trading plan regarding entry, risk management, and trade management.
Good luck!
All Strategies Are Good; If Managed Properly!
~Rich
Disclosure: I am part of Trade Nation's Influencer program and receive a monthly fee for using their TradingView charts in my analysis.

EUR/USD Bearish Setup: QM + Breakout Play Targeting Demand Zone!Hello guys!
I think eurusd is bearish! why?
A Range: Market consolidated in a tight horizontal range before breaking out.
QM Pattern: A lower high and lower low structure indicates potential for a trend reversal.
Neckline Break: Bearish confirmation with a strong break and close below neckline support.
Retest Zone: Price is now revisiting the QM supply zone, offering a high-probability short setup.
Bearish Projection: The next expected move is a drop toward the S&D (Support & Demand) zone between 1.12640 and 1.11900, which aligns with historical demand and previous accumulation.
________________________
🎯 Bearish Target Zone:
First TP: 1.12640
Final TP: 1.11900 - 1.12080 (Demand Zone)

Bullish continuation?The Gold (XAU/USD) is falling towards the pivot which lines up with the 61.8% Fibonacci support and could bounce to the 1st resistance which acts as a pullback resistance.
Pivot: 3,148.98
1st Support: 3,051.82
1st Resistance: 3,430.57
Risk Warning:
Trading Forex and CFDs carries a high level of risk to your capital and you should only trade with money you can afford to lose. Trading Forex and CFDs may not be suitable for all investors, so please ensure that you fully understand the risks involved and seek independent advice if necessary.
Disclaimer:
The above opinions given constitute general market commentary, and do not constitute the opinion or advice of IC Markets or any form of personal or investment advice.
Any opinions, news, research, analyses, prices, other information, or links to third-party sites contained on this website are provided on an "as-is" basis, are intended only to be informative, is not an advice nor a recommendation, nor research, or a record of our trading prices, or an offer of, or solicitation for a transaction in any financial instrument and thus should not be treated as such. The information provided does not involve any specific investment objectives, financial situation and needs of any specific person who may receive it. Please be aware, that past performance is not a reliable indicator of future performance and/or results. Past Performance or Forward-looking scenarios based upon the reasonable beliefs of the third-party provider are not a guarantee of future performance. Actual results may differ materially from those anticipated in forward-looking or past performance statements. IC Markets makes no representation or warranty and assumes no liability as to the accuracy or completeness of the information provided, nor any loss arising from any investment based on a recommendation, forecast or any information supplied by any third-party.

EURUSD: Detailed Support & Resistance Analysis 🇪🇺🇺🇸
Here is my latest structure analysis
and important supports & resistances on EURUSD
for next week.
Consider these structures for pullback/breakout trading.
❤️Please, support my work with like, thank you!❤️
I am part of Trade Nation's Influencer program and receive a monthly fee for using their TradingView charts in my analysis.

EURUSD Bulls Reloading — Big Week Ahead? FOMCEURUSD has been riding the uptrend for a while now, but we’ve finally hit a bit of a pause. Recently, the pair posted one of its biggest up-days since 2009 — a huge bullish signal — and momentum carried it even higher! 🔥
Now, price has pulled back slightly from the highs, with last week showing a modest dip as the dollar regained some strength. I do expect we could see a little more pullback in the short term… but overall, my bias remains bullish. I believe the uptrend is still intact, and we could see EURUSD push higher again this week! 📈
What’s your view? Are you buying the dip or expecting a deeper correction?
Drop your thoughts below — and if you found this analysis useful, a boost or follow is always appreciated! 🙌

Falling towards pullback support?The Cable (GBP/USD) is falling towards the pivot which lines up with the 50% Fibonacci retracement and could bounce to the 1st resistance.
Pivot: 1.3100
1st Support: 1.2870
1st Resistance: 1.3442
Risk Warning:
Trading Forex and CFDs carries a high level of risk to your capital and you should only trade with money you can afford to lose. Trading Forex and CFDs may not be suitable for all investors, so please ensure that you fully understand the risks involved and seek independent advice if necessary.
Disclaimer:
The above opinions given constitute general market commentary, and do not constitute the opinion or advice of IC Markets or any form of personal or investment advice.
Any opinions, news, research, analyses, prices, other information, or links to third-party sites contained on this website are provided on an "as-is" basis, are intended only to be informative, is not an advice nor a recommendation, nor research, or a record of our trading prices, or an offer of, or solicitation for a transaction in any financial instrument and thus should not be treated as such. The information provided does not involve any specific investment objectives, financial situation and needs of any specific person who may receive it. Please be aware, that past performance is not a reliable indicator of future performance and/or results. Past Performance or Forward-looking scenarios based upon the reasonable beliefs of the third-party provider are not a guarantee of future performance. Actual results may differ materially from those anticipated in forward-looking or past performance statements. IC Markets makes no representation or warranty and assumes no liability as to the accuracy or completeness of the information provided, nor any loss arising from any investment based on a recommendation, forecast or any information supplied by any third-party.

Bullish bounce off pullback support?The Kiwi (NZD/USD) is falling towards the pivot and could bounce to the pullback resistance.
Pivot: 0.5818
1st Support: 0.5690
1st Resistance: 0.6025
Risk Warning:
Trading Forex and CFDs carries a high level of risk to your capital and you should only trade with money you can afford to lose. Trading Forex and CFDs may not be suitable for all investors, so please ensure that you fully understand the risks involved and seek independent advice if necessary.
Disclaimer:
The above opinions given constitute general market commentary, and do not constitute the opinion or advice of IC Markets or any form of personal or investment advice.
Any opinions, news, research, analyses, prices, other information, or links to third-party sites contained on this website are provided on an "as-is" basis, are intended only to be informative, is not an advice nor a recommendation, nor research, or a record of our trading prices, or an offer of, or solicitation for a transaction in any financial instrument and thus should not be treated as such. The information provided does not involve any specific investment objectives, financial situation and needs of any specific person who may receive it. Please be aware, that past performance is not a reliable indicator of future performance and/or results. Past Performance or Forward-looking scenarios based upon the reasonable beliefs of the third-party provider are not a guarantee of future performance. Actual results may differ materially from those anticipated in forward-looking or past performance statements. IC Markets makes no representation or warranty and assumes no liability as to the accuracy or completeness of the information provided, nor any loss arising from any investment based on a recommendation, forecast or any information supplied by any third-party.

Bearish breakout?EUR/USD is falling toward a support level that acts as both a pullback support aligned with the 127.2% Fibonacci extension and the 61.8% Fibonacci projection and a potential breakout below this level could lead to a further decline, potentially reaching our take-profit target.
Entry: 1.1272
Why we like it:
There is a pullback support level that aligns with the 127.2% Fibonacci extension and the 61.8% Fibonacci projection.
Stop loss: 1.1423
Why we like it:
There is a pullback resistance level.
Take profit: 1.1146
Why we like it:
There is a pullback support level that lines up with the 61.8% Fibonacci retracement.
Enjoying your TradingView experience? Review us!
Please be advised that the information presented on TradingView is provided to Vantage (‘Vantage Global Limited’, ‘we’) by a third-party provider (‘Everest Fortune Group’). Please be reminded that you are solely responsible for the trading decisions on your account. There is a very high degree of risk involved in trading. Any information and/or content is intended entirely for research, educational and informational purposes only and does not constitute investment or consultation advice or investment strategy. The information is not tailored to the investment needs of any specific person and therefore does not involve a consideration of any of the investment objectives, financial situation or needs of any viewer that may receive it. Kindly also note that past performance is not a reliable indicator of future results. Actual results may differ materially from those anticipated in forward-looking or past performance statements. We assume no liability as to the accuracy or completeness of any of the information and/or content provided herein and the Company cannot be held responsible for any omission, mistake nor for any loss or damage including without limitation to any loss of profit which may arise from reliance on any information supplied by Everest Fortune Group.

EURUSD Channel Up favors buying but keep an eye on this.The EURUSD pair has been trading within a Channel Up pattern since the February 28 Low and its current Bearish Leg almost reached the 0.382 Fibonacci retracement level. That is where the previous Bearish Leg made a Higher Low (March 27) and rebounded.
This keeps for now the bullish trend intact and it will remain so for as long as the price remains within the Channel Up. The short-term Target is the -0.236 Fib extension at 1.17500. If on the other hand it breaks below the Channel Up, be ready to take the small loss and sell towards the 1D MA200 (orange trend-line) at 1.08500, which is the level that supported the market on that previous March 27 Low.
-------------------------------------------------------------------------------
** Please LIKE 👍, FOLLOW ✅, SHARE 🙌 and COMMENT ✍ if you enjoy this idea! Also share your ideas and charts in the comments section below! This is best way to keep it relevant, support us, keep the content here free and allow the idea to reach as many people as possible. **
-------------------------------------------------------------------------------
Disclosure: I am part of Trade Nation's Influencer program and receive a monthly fee for using their TradingView charts in my analysis.
💸💸💸💸💸💸
👇 👇 👇 👇 👇 👇

Bearish drop off pullback resistance?GBP/USD has rejected the resistance level, which is a pullback resistance, and could potentially drop from this level to our take profit target.
Entry: 1.3342
Why we like it:
There is a pullback resistance level.
Stop loss: 1.3442
Why we like it:
There is a pullback resistance level.
Take profit: 1.3160
Why we like it:
There is a pullback support level that lines up with the 38.2% Fibonacci retracement.
Enjoying your TradingView experience? Review us!
Please be advised that the information presented on TradingView is provided to Vantage (‘Vantage Global Limited’, ‘we’) by a third-party provider (‘Everest Fortune Group’). Please be reminded that you are solely responsible for the trading decisions on your account. There is a very high degree of risk involved in trading. Any information and/or content is intended entirely for research, educational and informational purposes only and does not constitute investment or consultation advice or investment strategy. The information is not tailored to the investment needs of any specific person and therefore does not involve a consideration of any of the investment objectives, financial situation or needs of any viewer that may receive it. Kindly also note that past performance is not a reliable indicator of future results. Actual results may differ materially from those anticipated in forward-looking or past performance statements. We assume no liability as to the accuracy or completeness of any of the information and/or content provided herein and the Company cannot be held responsible for any omission, mistake nor for any loss or damage including without limitation to any loss of profit which may arise from reliance on any information supplied by Everest Fortune Group.

GOLD - WAVE 4 CORRECTION TO $2,800 (UPDATE)Gold starting the week with some bullish momentum. We've seen a 'BOS' to the downside, which is now being followed by a retest of a supply zone. This zone can either be around $3,317 (0.618% Fib) or higher around $3,400 zone (0.365% Fib).
Don't forget we're in a 'Wave 4 Correction' of the Elliott Wave Theory strategy. Wave 4 always has choppy price action to trap in late buyers & early sellers.

Falling towards 50% Fibonacci support?AUD/USD is falling towards a support level, which is a pullback support that aligns with the 50% Fibonacci retracement, and could bounce from this level toward our take-profit target.
Entry: 0.6418
Why we like it:
There is a pullback support level that lines up with the 50% Fibonacci retracement.
Stop loss: 0.6394
Why we like it:
There is a pullback support level that is slightly above the 78.6% Fibonacci retracement.
Take profit: 0.6466
Why we like it:
There is a pullback resistance level.
Enjoying your TradingView experience? Review us!
Please be advised that the information presented on TradingView is provided to Vantage (‘Vantage Global Limited’, ‘we’) by a third-party provider (‘Everest Fortune Group’). Please be reminded that you are solely responsible for the trading decisions on your account. There is a very high degree of risk involved in trading. Any information and/or content is intended entirely for research, educational and informational purposes only and does not constitute investment or consultation advice or investment strategy. The information is not tailored to the investment needs of any specific person and therefore does not involve a consideration of any of the investment objectives, financial situation or needs of any viewer that may receive it. Kindly also note that past performance is not a reliable indicator of future results. Actual results may differ materially from those anticipated in forward-looking or past performance statements. We assume no liability as to the accuracy or completeness of any of the information and/or content provided herein and the Company cannot be held responsible for any omission, mistake nor for any loss or damage including without limitation to any loss of profit which may arise from reliance on any information supplied by Everest Fortune Group.

Bullish bounce?The Fiber (EUR/USD) is falling towards the pivot and could bounce to the 1st resistance.
Pivot: 1.1183
1st Support: 1.1051
1st Resistance: 1.1514
Risk Warning:
Trading Forex and CFDs carries a high level of risk to your capital and you should only trade with money you can afford to lose. Trading Forex and CFDs may not be suitable for all investors, so please ensure that you fully understand the risks involved and seek independent advice if necessary.
Disclaimer:
The above opinions given constitute general market commentary, and do not constitute the opinion or advice of IC Markets or any form of personal or investment advice.
Any opinions, news, research, analyses, prices, other information, or links to third-party sites contained on this website are provided on an "as-is" basis, are intended only to be informative, is not an advice nor a recommendation, nor research, or a record of our trading prices, or an offer of, or solicitation for a transaction in any financial instrument and thus should not be treated as such. The information provided does not involve any specific investment objectives, financial situation and needs of any specific person who may receive it. Please be aware, that past performance is not a reliable indicator of future performance and/or results. Past Performance or Forward-looking scenarios based upon the reasonable beliefs of the third-party provider are not a guarantee of future performance. Actual results may differ materially from those anticipated in forward-looking or past performance statements. IC Markets makes no representation or warranty and assumes no liability as to the accuracy or completeness of the information provided, nor any loss arising from any investment based on a recommendation, forecast or any information supplied by any third-party.

Dollar Decline Against All Major CurrenciesThe Dollar’s decline didn’t start with the recent ‘Liberation Day’ tariffs. In fact, it has been gradually weakening since the 1970s.
More recently, however, the Dollar has lost value against many currencies since January. Why is that?
Why have the USD/CHF and USD/SGD strengthened against the US Dollar over the past few decades? One reason is that both countries have managed their money supply with discipline. For example, as of end-2024, Switzerland’s net federal debt stood at 141 billion Swiss franc, their debt to GDP ratio at 17.2%.
In contrast, the United States has expanded its national debt at an alarming rate. Some might point out that Japan’s debt-to-GDP ratio is even higher—around 230%. That is why the Japanese Yen has also been in decline for decades.
Why does printing more money through QE and increasing the money supply weaken a currency?
Just imagine in a close economy with 10 people and 1 central bank. If the central bank printed $100 and distributed equally to the 10, each of them will receive $10 to buy 10 available cheesecakes.
But now the central bank decided to print $1,000 and each person will have $100 to buy 10 available cheesecakes.
The global economy is not a close, but an open system.
When the US and other major economies printed massive amounts of money, they didn’t just inflate their own economies—they exported inflation worldwide. This contributes to rising cost of living not all around the world.
In my view, Gold is also a currency pair against the US at the start of 1971. The moment dollar unpeg itself from gold, gold appreciates. With each QE, we can see how the currencies have diluted with gold and inflation appreciating over these years.
Why different currencies have started to appreciate against the USD since January this year?
We can see all the currencies have either reached its bottomed in January and started moving higher or it formed a reversal pattern like the Aussie dollar and the Dollar Yuan, in this case with this inverted hammer, it is indicating Dollar Yuan to reverse downward, meaning dollar coming off and yuan to appreciate.
January was President Trump inauguration and February was when he rolled out tariffs against Canada, Mexico and China, and the market do not like that and has been selling the USD against the rest of the currencies?
If US has printed the so much money, but why other than Swiss franc and Singapore Dollar, many other currencies have been depreciating against dollars over the past decades?
I’d like to hear your thoughts on this.
Euro FX Futures & Options
Ticker: 6E
Minimum fluctuation:
0.000050 per Euro increment = $6.25
Disclaimer:
• What presented here is not a recommendation, please consult your licensed broker.
• Our mission is to create lateral thinking skills for every investor and trader, knowing when to take a calculated risk with market uncertainty and a bolder risk when opportunity arises.
CME Real-time Market Data help identify trading set-ups in real-time and express my market views. If you have futures in your trading portfolio, you can check out on CME Group data plans available that suit your trading needs www.tradingview.com
Trading the Micro: www.cmegroup.com

Bearish drop?USD/CHF is reacting to a resistance level, which is a pullback resistance aligning with the 61.8% Fibonacci retracement, and could decline from this level toward our take-profit target.
Entry: 0.8279
Why we like it:
There is a pullback resistance level that lines up with the 61.8% Fibonacci retracement.
Stop loss: 0.8313
Why we like it:
There is a pullback resistance level.
Take profit: 0.8226
Why we like it:
There is a pullback support level.
Enjoying your TradingView experience? Review us!
Please be advised that the information presented on TradingView is provided to Vantage (‘Vantage Global Limited’, ‘we’) by a third-party provider (‘Everest Fortune Group’). Please be reminded that you are solely responsible for the trading decisions on your account. There is a very high degree of risk involved in trading. Any information and/or content is intended entirely for research, educational and informational purposes only and does not constitute investment or consultation advice or investment strategy. The information is not tailored to the investment needs of any specific person and therefore does not involve a consideration of any of the investment objectives, financial situation or needs of any viewer that may receive it. Kindly also note that past performance is not a reliable indicator of future results. Actual results may differ materially from those anticipated in forward-looking or past performance statements. We assume no liability as to the accuracy or completeness of any of the information and/or content provided herein and the Company cannot be held responsible for any omission, mistake nor for any loss or damage including without limitation to any loss of profit which may arise from reliance on any information supplied by Everest Fortune Group.

NAS100 - Stock Market, Waiting for FOMC?!The index is above the EMA200 and EMA50 on the 4-hour timeframe and is trading in its ascending channel. I expect corrective moves from the specified range, but if the index continues to move upwards towards 21,000 points, we can look for the next Nasdaq short positions with a risk-reward ratio.
Last week, U.S. equity markets experienced $8.9 billion in capital outflows, while equity markets in Japan and the European Union saw net inflows. Additionally, U.S. Treasury bonds recorded an outflow of $4.5 billion—the largest since December 2023. Meanwhile, the gold market witnessed its first weekly investment decline since January.
Looking ahead, financial markets are focused on the upcoming earnings reports from major companies across sectors such as technology, healthcare, automotive, energy, and financial services. These reports are expected to significantly influence equity trends, investment strategies, and corporate outlooks. Below is a daily breakdown of key companies set to release earnings this week:
Monday, May 5, 2025
The week starts with a focus on the healthcare and biotech sectors:
• Before market open: Companies such as Palantir, Ford, Onsemi, and Tyson Foods will report earnings. Palantir and Ford are particularly noteworthy for investors in the tech and auto sectors.
• After market close: Healthcare firms like Hims & Hers Health, Axsome Therapeutics, and financial company CNA Financial will report.
Tuesday, May 6, 2025
Tuesday highlights several key tech earnings:
• Before market open: Celsius, Datadog, Rivian, and Tempus will publish their results. Rivian’s report is especially anticipated due to the intense competition in the electric vehicle space.
• After market close: Tech giants like AMD and Arista Networks will release earnings, along with Marriott from the hospitality sector.
Wednesday, May 7, 2025
A packed day for earnings reports:
• Before market open: Reports from Uber and Teva are expected, along with ARM Holdings, a key player in semiconductors.
• After market close: AppLovin, Unity, and Robinhood will release their reports—representing digital gaming, software, and fintech respectively.
Thursday, May 8, 2025
This day centers on digital health, cryptocurrency, and e-commerce:
• Before market open: Peloton and Shopify will report. Shopify’s performance is particularly critical in the online retail sector.
• After market close: Crypto firm Coinbase and online sports betting platform DraftKings are in focus.
Friday, May 9, 2025
Fewer companies will report, but some are of strategic interest:
• Firms like 1stdibs, Ani Pharmaceuticals, and Embecta are scheduled, as well as Telos and Algonquin—key names in energy and cybersecurity investing.
This week, markets are closely monitoring Wednesday’s FOMC meeting. At the March session, the Fed left rates unchanged and signaled only two potential cuts totaling 50 basis points for the year, based on its dot plot—suggesting a cautious approach to monetary easing.
Simultaneously, April’s U.S. Services PMI is set to be released today, providing clearer insights into post-tariff business activity.
Amazon’s CEO stated that, so far, there is no indication of reduced demand due to tariff concerns. Some inventory spikes were noted in specific categories, likely driven by stockpiling ahead of tariff implementation. Retail prices, on average, have not significantly increased, and most sellers have yet to raise prices—though that could change depending on how tariff policies evolve. Notably, essential goods have grown at twice the rate of other categories and now account for a third of all unit sales in the U.S.
Following April’s jobs report, the likelihood of a Fed rate cut in June dropped from 75% to 42%. With only one more employment report due before the June 18 meeting, hopes for an early policy shift have faded. Some analysts argue that without the tariff conflict, the Fed might already be cutting rates, given the downward trend in inflation, steady growth, and Congressional focus on fiscal measures.
The April jobs data showed that the U.S. labor market remains resilient—neither too strong to spark inflation fears nor too weak to trigger panic. After the release, with market confidence rebounding, Goldman Sachs forecasted the Fed’s first rate cut to come at the July 30 meeting.
The consensus expectation is for the Fed funds rate to remain in the current 4.25%-4.5% range, unchanged since January. The CME FedWatch tool currently assigns just a 1.8% chance of a rate cut at the upcoming meeting.
Economists warn that Trump’s newly imposed tariffs—active since April—could drive up prices and hurt employment, challenging the Fed’s dual mandate of controlling both inflation and joblessness. However, recent data shows inflation remained mild in March and the labor market held steady in April.
Nancy Vanden Houten, Chief U.S. Economist at Oxford Economics, wrote: “The data is strong enough for the Fed to stay on the sidelines and monitor how tariffs influence inflation and expectations.” While hard data remains stable, forecasts and sentiment surveys signal looming challenges. Business leaders and individuals express concern that rising costs may burden consumers and businesses in the coming months or years, possibly even tipping the economy into recession.

Watching carefully USDCAD this weekWith the abundance of US & CAN data this week, we may see some interesting action in USDCAD pair.
Let's dig in.
Let us know what you think in the comments below.
Thank you.
77.3% of retail investor accounts lose money when trading CFDs with this provider. You should consider whether you understand how CFDs work and whether you can afford to take the high risk of losing your money. Past performance is not necessarily indicative of future results. The value of investments may fall as well as rise and the investor may not get back the amount initially invested. This content is not intended for nor applicable to residents of the UK. Cryptocurrency CFDs and spread bets are restricted in the UK for all retail clients.

DXY (US Dollar Index) – Bullish Setup📊 DXY (US Dollar Index) – Bullish Setup from FVG & Trendline Confluence
Price tapped into a well-defined Fair Value Gap (FVG UP) aligning with bullish trendline support. I'm anticipating a small retracement toward the 99.88–99.81 area before continuation upward.
📍 Entry Zone: 99.88 – 99.81 (FVG + Trendline)
🛑 Stop Loss: 99.71
🎯 Target (TP): 100.32
📐 RR: Approx. 1:3
Confluences:
Bullish market structure
FVG filled & respected
Ascending trendline support
Liquidity taken below previous lows
🔔 Watching for bullish reaction after the minor pullback for confirmation.

USD/TWDLarge selloff driven by price action in a macro rising wedge
- Look for support hold
- Island bottom or bounce with a wick less than half the body candle
- Could see highs again by 2026/2027
- Could be a concern over Chinese invasion
- China says not ready until 2027 to do so
