USDJPY .. LONGOANDA:USDJPY
Price is nearing a critical level around .
No setup, no trade. For me, a solid plan always comes before any prediction.
****If the zone is broken and confirmed with a retest, I’ll adjust my plan accordingly for a possible reverse trade.
USDJPY
LOOKING FOR USDJPY TO TARGET 149.400 Looking for a retrace into 143.9 and then a move to 149.400 weekly and monthly supply .

XAUUSD DETAILED ANALYSIS TECHNICAL AND FUNDAMENTALS XAUUSD is currently trading around the 3256 level and is clearly respecting a descending channel on the 1-hour timeframe. The price is now pushing higher from the lower boundary of the channel, suggesting short-term bullish momentum. Based on the current technical structure, I am anticipating a clean breakout above the channel resistance, with the next key target at 3300. The marked purple resistance zone around 3310–3320 also acts as a magnet for price once the breakout is confirmed.
On the fundamental side, gold remains supported by ongoing geopolitical uncertainty and speculation around the Fed's next rate decision. With recent U.S. economic data showing mixed signals—strong labor market figures but slowing inflation momentum—the market is pricing in fewer rate hikes, which weakens the USD and favors upside in XAUUSD. Additionally, central bank gold demand remains strong globally, acting as a long-term support for bullion.
Traders are currently reacting to a softening dollar index and treasury yields, which further underpins bullish sentiment in gold. A clear break above the upper boundary of this channel, ideally with strong volume confirmation, could set the stage for a swift move to retest the 3300 psychological level. From a risk-reward perspective, the breakout trade setup here aligns well with institutional strategies that favor trend continuation post-consolidation.
In summary, XAUUSD is trading inside a clean descending channel, with buyers stepping in aggressively near the support zone. A breakout above the structure could trigger a bullish continuation move toward 3300, backed by strong macro tailwinds and technical confirmation. This setup offers an excellent opportunity for swing traders to capitalize on short-term momentum. Are you also tracking gold fundamentals this week?

USD/JPY Eyes Breakout After Healthy Wave 4 CorrectionThe USD/JPY pair is currently unfolding a clean impulsive 5-wave structure to the upside. The price action has already completed Waves 1, 2, and 3, and has entered a probable Wave 4 correction.
Wave 3 appears extended and tapped into a key Fair Value Gap (FVG), which acted as resistance.
Wave 4 is likely to develop as a shallow retracement, possibly forming a bull flag or expanded flat before launching into Wave 5.
The ascending channel supports the bullish structure with both Wave 2 and Wave 4 respecting lower bounds.
Targets: 144.750 - 144.351
Stoploss: 146.268

Could the price reverse from here?USD/JPY is reacting off the resistance level which is a pullback resistance that lines up with the 161.8% Fibonacci extension and the 78.6% Fibonacci projection and could reverse from this level to our take profit.
Entry: 145.59
Why we like it:
There is a pullback resistance level that lines up with the 161.8% Fibonacci extension and the 78.6% Fibonacci projection.
Stop loss: 146.75
Why we like it:
There is a pullback resistance level that line sup with the 78.6% Fibonacci retracement.
Take profit: 143.86
Why we like it:
There is a pullback support level.
Enjoying your TradingView experience? Review us!
Please be advised that the information presented on TradingView is provided to Vantage (‘Vantage Global Limited’, ‘we’) by a third-party provider (‘Everest Fortune Group’). Please be reminded that you are solely responsible for the trading decisions on your account. There is a very high degree of risk involved in trading. Any information and/or content is intended entirely for research, educational and informational purposes only and does not constitute investment or consultation advice or investment strategy. The information is not tailored to the investment needs of any specific person and therefore does not involve a consideration of any of the investment objectives, financial situation or needs of any viewer that may receive it. Kindly also note that past performance is not a reliable indicator of future results. Actual results may differ materially from those anticipated in forward-looking or past performance statements. We assume no liability as to the accuracy or completeness of any of the information and/or content provided herein and the Company cannot be held responsible for any omission, mistake nor for any loss or damage including without limitation to any loss of profit which may arise from reliance on any information supplied by Everest Fortune Group.

USD/JPY : Get Ready for another Rally! (READ THE CAPTION)By analyzing the USD/JPY chart on the daily timeframe, we can see that, as expected, the price has finally started to rise. So far, it has successfully reached the 143.5 and 144 targets, and extended up to 145.76, delivering a solid 350-pip move.
The main analysis remains valid, and I expect the price to hit the next target at 146.2 soon.
The total gain from this setup has now exceeded 570 pips, and the key upcoming supply zones are at 146.2, 148.7, and 150.
This analysis will be updated accordingly!
THE MAIN ANALYSIS :
Please support me with your likes and comments to motivate me to share more analysis with you and share your opinion about the possible trend of this chart with me !
Best Regards , Arman Shaban

USD/JPY "The Ninja" Forex Bank Money Heist (Bullish)🌟Hi! Hola! Ola! Bonjour! Hallo! Marhaba!🌟
Dear Money Makers & Robbers, 🤑 💰💸✈️
Based on 🔥Thief Trading style technical and fundamental analysis🔥, here is our master plan to heist the USD/JPY "The Ninja" Forex Market Heist. Please adhere to the strategy I've outlined in the chart, which emphasizes long entry. Our aim is to escape near the high-risk YELLOW MA Zone. It's a Risky level, overbought market, consolidation, trend reversal, trap at the level where traders and bearish robbers are stronger. 🏆💸"Take profit and treat yourself, traders. You deserve it!💪🏆🎉
Entry 📈 : "The vault is wide open! Swipe the Bullish loot at any price - the heist is on!
however I advise to Place buy limit orders within a 15 or 30 minute timeframe most recent or swing, low or high level. I Highly recommended you to put alert in your chart.
Stop Loss 🛑:
Thief SL placed at the Nearest / Swing low level Using the 1H timeframe (143.000) Day trade basis.
SL is based on your risk of the trade, lot size and how many multiple orders you have to take.
🏴☠️Target 🎯: 147.000
💰💵💸USD/JPY "The Ninja" Forex Money Heist Plan is currently experiencing a bullishness,., driven by several key factors. .☝☝☝
📰🗞️Get & Read the Fundamental, Macro, COT Report, Quantitative Analysis, Sentimental Outlook, Intermarket Analysis, Future trend targets.... go ahead to check 👉👉👉🔗🔗🌎🌏🗺
⚠️Trading Alert : News Releases and Position Management 📰🗞️🚫🚏
As a reminder, news releases can have a significant impact on market prices and volatility. To minimize potential losses and protect your running positions,
we recommend the following:
Avoid taking new trades during news releases
Use trailing stop-loss orders to protect your running positions and lock in profits
💖Supporting our robbery plan 💥Hit the Boost Button💥 will enable us to effortlessly make and steal money 💰💵. Boost the strength of our robbery team. Every day in this market make money with ease by using the Thief Trading Style.🏆💪🤝❤️🎉🚀
I'll see you soon with another heist plan, so stay tuned 🤑🐱👤🤗🤩

DeGRAM | USDJPY Keeps the Demand Zone📊 Technical Analysis
● USD/JPY has broken the falling-wedge top and is holding above the 142.20 breakout line; that keeps 144.03 → 147.5 in scope.
💡 Fundamental Analysis
● U.S. March retail sales surged 1.4 %, underscoring resilient demand.
✨ Summary
A wedge breakout plus firm U.S. data, a hawkish Fed and a dovish BOJ favour more dollar strength; holding above 142.20 keeps USD/JPY on track for $144.03–147.5.
-------------------
Share your opinion in the comments and support the idea with like. Thanks for your support!

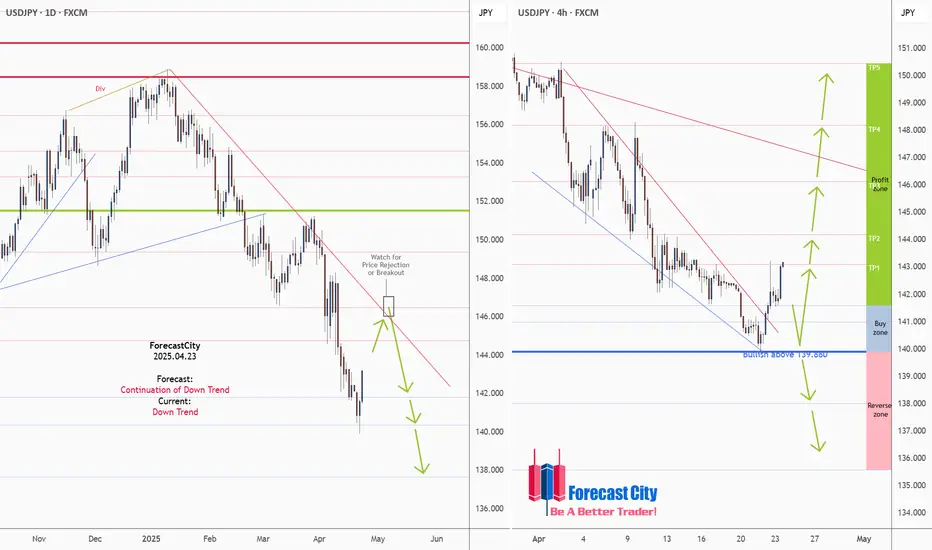
USDJPY Daily & H4 Forecasts, Technical Analysis & Trading IdeaTechnical analysis is on the chart!
No description needed!
FX:USDJPY
________________________________________________________________
❤️ If you find this helpful and want more FREE forecasts in TradingView,
. . . . . . . . Hit the 'BOOST' button 👍
. . . . . . . . . . . Drop some feedback in the comments below! (e.g., What did you find most useful? How can we improve?)
🙏 Your support is appreciated!
Now, it's your turn!
Be sure to leave a comment; let us know how you see this opportunity and forecast.
Have a successful week,
ForecastCity Support Team
USDJPY: 300+ Pips From Previous Idea, What Hold Next? Hey Everyone
USDJPY is on a roll! It’s rebounded a whopping 300+ pips and is now on the positive side. We reckon it’s going to keep climbing in the coming days as DXY is starting to regain its strength.
And here’s the cherry on top: there’s some exciting news coming up, including the NFP tomorrow. This could really boost the USDJPY to a new record high.
But remember, when trading, it’s crucial to manage your risk carefully.
Now, let’s talk about the potential for a significant market movement. We’ve spotted a chance for a substantial bullish swing that could reach around 2050 pips. We’ve also identified three potential targets, so you can choose the one that best fits your analysis.
The main driver behind this move is the reversal of the Japanese Yen (JPY) from a bullish trend to a bearish one. So, let’s be cautious and use precise risk management techniques during this period.
Good luck and happy trading! 😊
Oh, and if you’d like to help us out, here are a few things you can do:
- Like our ideas
- Comment on our ideas
- Share our ideas
Thanks a bunch for your support! 😊
Cheers,
The Setupsfx_ Team

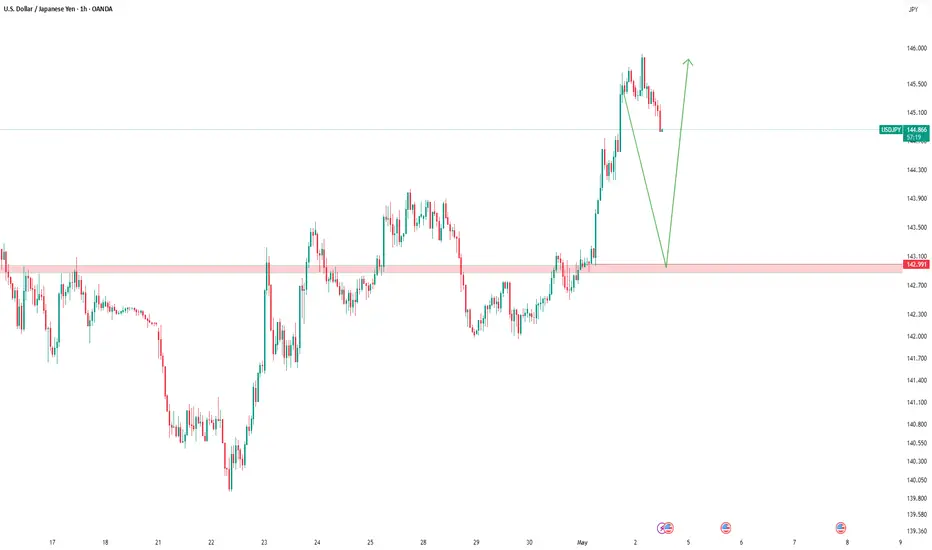
USDJPY Poised to Retest Broken Trendline After Dovish BOJWe discussed the potential battle between bulls and bears near the trendline in our early April post. USDJPY bears ultimately won that battle, and the 140 target was reached. You can view the earlier post here:
Following the breakdown, the 140 level acted as support, and now an upward reaction has begun. At today’s meeting, the BOJ held rates steady at 0.50% as expected, and Governor Ueda delivered a dovish message. The BOJ lowered its core inflation forecast by 0.2% to 2.2% for 2025 and to 1.7% for 2026. The GDP forecast was also revised down from 1.1% to 0.5%.
These projections suggest the BOJ lacks full confidence in consistently reaching its 2% inflation target, though it's very close. However, the risk of tariffs complicates the outlook. Tariffs could negatively impact both growth and inflation, and the BOJ will likely hold off on further rate hikes for at least a few meetings to observe early effects.
In the context of a more dovish BOJ and the dollar index stabilizing after weeks of declines, USDJPY is staging a positive correction. A retest of the broken trendline appears likely, with potential for the short-term rally to extend toward 148.50. Beyond that point, the market will face a critical decision. If the upward reaction stalls, another medium-term move back toward 140 remains a strong possibility.

Fundamental Market Analysis for March 01, 2025 USDJPYThe USD/JPY pair is trading with small losses, hovering around the mid-143.00s after disappointing US economic growth data and weak Japanese economic reports caused a divergence in sentiment between the two currencies. The US economy contracted 0.3 per cent in the first quarter of 2025, the first contraction since 2022, missing growth expectations and highlighting the impact of rising imports and government spending cuts. At the same time, Japan released weaker-than-expected industrial production and retail sales data, limiting the yen's gains even as global risk appetite declined.
On the macroeconomic front, the US Bureau of Economic Analysis reported that real GDP contracted 0.3% in Q1, missing the market forecast for a 0.4% increase and slowing sharply from the 2.4% growth in Q4 2024. The contraction was primarily driven by a 41 per cent rise in imports and lower government spending. Meanwhile, core PCE inflation, the Fed's preferred measure of inflation, fell to 2.3 per cent year-on-year, in line with expectations and below February's 2.5 per cent. Other data showed a slowdown in job creation, with the ADP report showing just 62,000 new jobs in April against expectations of 108,000.
Despite the softer data, personal spending remained flat in March, rising 0.7%, while incomes rose 0.5%. However, market sentiment turned cautious, with the Dow Jones Industrial Average falling more than 200 points to stagnate around 40,300.
In Japan, the yen weakened 0.5% against the dollar as industrial production and retail sales data disappointed, highlighting the fragility of the domestic economy.
Trade recommendation: BUY 144.20, SL 144.00, TP 145.00

$JPINTR -BoJ Holds Rates but Cuts GDP Growth Outlook (May/2025)ECONOMICS:JPINTR
May/2025
source: Bank of Japan
-The Bank of Japan (BoJ) kept its key short-term interest rate at 0.5% during its May meeting, in line with expectations.
The unanimous decision came amid growing concerns over the impact of U.S. tariffs.
In its quarterly outlook, the BoJ slashed its FY 2025 GDP growth forecast to 0.5%, from January’s estimate of 1.0%.
The growth outlook for FY 2026 was also lowered to 0.7% from the prior forecast of 1.0%.

Technicals USDJPY Key Level (Horizontal Resistance)
A horizontal resistance zone around 143.90 has been tested multiple times.
Price is currently retesting this zone, marked as an "Entry Zone", suggesting a potential breakout or rejection.
2. Price Structure
Prior downtrend bottomed near 140.00, then formed higher lows, showing a potential trend reversal.
Current price is approaching the resistance with strong bullish candles, indicating possible momentum buildup.
3. Volume
Volume spikes align with swing highs and lows, suggesting these moves were backed by stronger participation.
4. Scenarios Outlined
Bullish Path (Black Arrow): Breakout above the entry zone could lead to targets near 147.00–150.00, continuing a bullish reversal.
Bearish Path (Red Wave): Rejection at the resistance may cause a drop toward 140.00, forming a ranging or distribution pattern.
The Fed (USD) maintains relatively high interest rates, while the BoJ (JPY) continues a dovish stance, creating upward pressure on USD/JPY.

XAUUSD/GOLD | 4H | SWING TRADEHey There,
Guys, I advise you to just wait for the breakout in gold. This is swing trading. I am just waiting for a breakout; if this breakout is to the downside, the target will be at least 3.215 level.
I hope this matches your desired tone.
Don't forget to click the like button at the bottom of this post to stay up to date with the latest changes!
Dear friends, your likes are always the biggest motivation for me to share my analysis. Therefore, I would like to ask each and every one of my followers; please keep your likes coming.
I sincerely thank everyone who supports me with their likes.

USDJPY Bearish Forecast, More Bearish Order FlowAfter the recent change of character from Monday, UJ continued lower and broke the H1 structure. As we all know, whenever you get a break of structure, expect a pullback. On the H4 there is a nice bearish OB which serves as a nice point of interest for price to rally back towards, be mindful this OB is big so we don't know what to expect once price reaches it.
For now this is how I see the dollar heading towards.

Could the price bounce from here?USD/JPY is falling towards the support level which is a pullback support that aligns with the 61.8% Fibonacci retracement and could bounce from this level to our take profit.
Entry: 142.39
Why we like it:
There is a pullback support level that line sup with the 61.8% Fibonacci retracement.
Stop loss: 141.95
Why we like it:
There is a pullback support level.
Take profit: 143.13
Why we like it:
There is a pullback resistance level.
Enjoying your TradingView experience? Review us!
Please be advised that the information presented on TradingView is provided to Vantage (‘Vantage Global Limited’, ‘we’) by a third-party provider (‘Everest Fortune Group’). Please be reminded that you are solely responsible for the trading decisions on your account. There is a very high degree of risk involved in trading. Any information and/or content is intended entirely for research, educational and informational purposes only and does not constitute investment or consultation advice or investment strategy. The information is not tailored to the investment needs of any specific person and therefore does not involve a consideration of any of the investment objectives, financial situation or needs of any viewer that may receive it. Kindly also note that past performance is not a reliable indicator of future results. Actual results may differ materially from those anticipated in forward-looking or past performance statements. We assume no liability as to the accuracy or completeness of any of the information and/or content provided herein and the Company cannot be held responsible for any omission, mistake nor for any loss or damage including without limitation to any loss of profit which may arise from reliance on any information supplied by Everest Fortune Group.

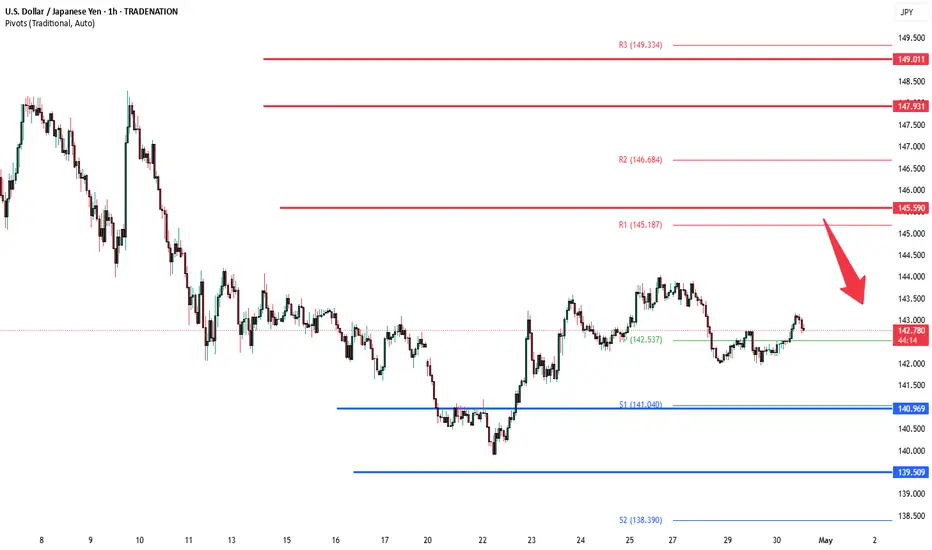
USDJPY INTRADAY downtrend continuationThe USDJPY pair is exhibiting a bearish sentiment, reinforced by the ongoing downtrend. The key trading level to watch is at 145.60, which represents the current intraday swing low and the falling resistance trendline level.
In the short term, an oversold rally from current levels, followed by a bearish rejection at the 145.60 resistance, could lead to a downside move targeting support at 141.00, with further potential declines to 139.50 and 138.40 over a longer timeframe.
On the other hand, a confirmed breakout above the 145.60 resistance level and a daily close above that mark would invalidate the bearish outlook. This scenario could pave the way for a continuation of the rally, aiming to retest the 147.90 resistance, with a potential extension to 149.00 levels.
Conclusion:
Currently, the USDJPY sentiment remains bearish, with the 145.60 level acting as a pivotal resistance. Traders should watch for either a bearish rejection at this level or a breakout and daily close above it to determine the next directional move. Caution is advised until the price action confirms a clear break or rejection.
This communication is for informational purposes only and should not be viewed as any form of recommendation as to a particular course of action or as investment advice. It is not intended as an offer or solicitation for the purchase or sale of any financial instrument or as an official confirmation of any transaction. Opinions, estimates and assumptions expressed herein are made as of the date of this communication and are subject to change without notice. This communication has been prepared based upon information, including market prices, data and other information, believed to be reliable; however, Trade Nation does not warrant its completeness or accuracy. All market prices and market data contained in or attached to this communication are indicative and subject to change without notice.
USDJPY 4h Long Setup | Low Risk High Reward Market broke the descending structure with strong bullish impulse followed by higher lows respecting new trendline
Price retested the previous resistance now turned support zone with a bullish reaction
Entry is taken after confirmation of the retest holding and bullish continuation signs
Entry : 142.494
SL : 140.676
TP : 148.270
RR 1 : 3.2
Price action aligned with short-term bullish reversal structure and clear demand zone defense
Let price do the work

Bullish bounce off pullback support?USD/JPY is falling towards the pivot which is a pullback support and could rise to the 1st resistance.
Pivot: 141.63
1st Support: 141.00
1st Resistance: 142.75
Risk Warning:
Trading Forex and CFDs carries a high level of risk to your capital and you should only trade with money you can afford to lose. Trading Forex and CFDs may not be suitable for all investors, so please ensure that you fully understand the risks involved and seek independent advice if necessary.
Disclaimer:
The above opinions given constitute general market commentary, and do not constitute the opinion or advice of IC Markets or any form of personal or investment advice.
Any opinions, news, research, analyses, prices, other information, or links to third-party sites contained on this website are provided on an "as-is" basis, are intended only to be informative, is not an advice nor a recommendation, nor research, or a record of our trading prices, or an offer of, or solicitation for a transaction in any financial instrument and thus should not be treated as such. The information provided does not involve any specific investment objectives, financial situation and needs of any specific person who may receive it. Please be aware, that past performance is not a reliable indicator of future performance and/or results. Past Performance or Forward-looking scenarios based upon the reasonable beliefs of the third-party provider are not a guarantee of future performance. Actual results may differ materially from those anticipated in forward-looking or past performance statements. IC Markets makes no representation or warranty and assumes no liability as to the accuracy or completeness of the information provided, nor any loss arising from any investment based on a recommendation, forecast or any information supplied by any third-party.

Daily Price Action: USDJPY Tuesday 4/29/2025In this video, we will be looking into the potential price action USDJPY.

USDJPY ready for another drop?After daily break of structure USDJPY just has managed to form another head and shoulder with strong liquidity grab has started to move in the major direction of the trend. After yesterdays drop, price today so far has done pullback and formed another possible bearish market structure.
As of upcoming USD and JPY news may push that price back to the support as shown in sketch.
A sell trade is high probability

USD/JPY : Bull or Bear? Let's See! (READ THE CAPTION)Upon reviewing the USD/JPY chart on the daily timeframe, we observe that due to the sharp drop in the Dollar Index, the price has reached the 140.850 level. This decline was very strong and impulsive; however, as seen on the chart, the price has now approached a significant demand zone between 139.6 and 141. If the price manages to close and stabilize above this area, we can expect a further bullish move from this pair.
Please support me with your likes and comments to motivate me to share more analysis with you and share your opinion about the possible trend of this chart with me !
Best Regards , Arman Shaban
