The beginning of the carry trade unwind part 2?If we look at the chart, the current structure looks very similar to what happened right before the market decline in August.
We've formed a head and shoulders (albeit not perfect as it's slanted), and price seems to be breaking down.
If price action accelerates to do downside, it's likely to take the market with it just like it did the last time.
Paying attention to this over the coming weeks.
USDJPY

USDJPY: Bulls Eye Key Support as Trade Optimism Lifts DollarHey Traders, We are currently monitoring USDJPY for a potential buying opportunity as price approaches the 143.200 level, an important area that has acted as both support and resistance in recent sessions. Technically, the pair remains in a well-defined uptrend, and this pullback appears to be part of a healthy correction phase rather than a trend reversal. The 143.200 zone also aligns with a dynamic trendline support, increasing the likelihood of a bullish reaction if price holds above this level. From a fundamental perspective, recent developments have started to tilt in favor of the dollar. News of progress toward a trade agreement between the U.S. and India has sparked optimism, as it may lay the groundwork for similar deals with other key global partners. This has been compounded by unconfirmed reports out of China suggesting potential tariff exemptions in specific sectors, which has further boosted investor sentiment and triggered a broader “risk-on” shift in markets. As geopolitical tensions around trade show signs of easing, the U.S. dollar is regaining strength, fueling the case for further upside in USDJPY. Taken together, the convergence of technical support and improving macroeconomic signals presents a compelling opportunity for bulls, provided we see signs of price stability or a confirmed bounce near the 143.200 area.
Trade safe, Joe.

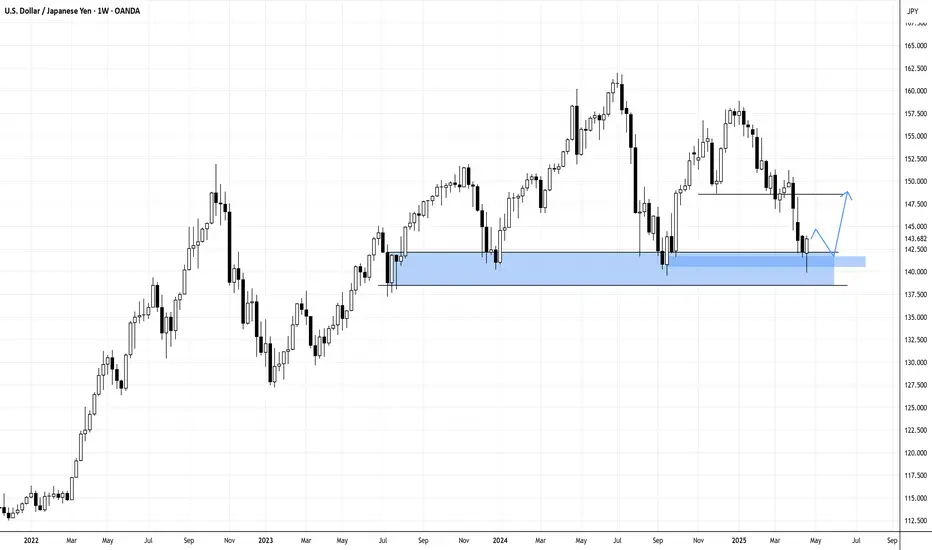
USDJPY Weekly Rejection at Support-Revisit Bearish Order Block?USDJPY pair last trading week got rejected at the same level that the pair has previously acted as a support level. Will this rejection cause USDJPY to rally towards a bearish order block above 147.50?
Risk Zones: 146.50
N.B!
- USDJPY price might not follow the drawn lines . Actual price movements may likely differ from the forecast.
- Let emotions and sentiments work for you
- ALWAYS Use Proper Risk Management In Your Trades
#usdjpy
#usd
#jpy
Why Yen — When the Dollar Pays 4.5%?USD/JPY recently dropped to its lowest level since September 2024, hovering near the weekly moving average. The market buzzes with concerns over potential U.S. instability and speculation that a Trump administration could weigh on the dollar — prompting some investors to seek safety in the yen.
However, the yield story tells a different tale.
The U.S. still offers an attractive 4.5% overnight interest rate, while Japan lags far behind at just 0.5%. With USD currently undervalued, the yield differential may once again tilt investor preference back toward the dollar.
Looking ahead, a potential rebound toward resistance at 148.639 could be in play in the coming weeks.

JPY ( YEN )BASKET FORECAST Q2 W18 Y25JPY ( YEN )BASKET FORECAST Q2 W18 Y25
Professional Risk Managers👋
Welcome back to another FRGNT chart update📈
Diving into some Forex setups using predominantly higher time frame order blocks alongside confirmation breaks of structure.
Let’s see what price action is telling us today!
✅The JPY Basket trackS the overall strength of the JPY against a weighted average of other currencies.
✅It can be used as an indicator of YEN strength which can be a tool for analysing and potentially hedging for or against the Index.
✅ Pairs to watch - GBPJPY, USDJPY EURJPY, CADJPY, AUDJPY
🔑 Remember, to participate in trading comes always with a degree of risk, therefore as professional risk managers it remains vital that we stick to our risk management plan as well as our trading strategies.
📈The rest, we leave to the balance of probabilities.
💡Fail to plan. Plan to fail.
🏆It has always been that simple.
❤️Good luck with your trading journey, I shall see you at the very top.
🎯Trade consistent, FRGNT X

I've Cracked the BEARISH Code for Japanese Yen Using COTJapanese Yen is setup for sells based on COT positioning and other underlying fundamental conditions.

USDJPY - Already Over-Sold!Hello TradingView Family / Fellow Traders. This is Richard, also known as theSignalyst.
📈USDJPY has been overall bearish trading within the falling wedge pattern marked in blue and it is currently hovering around the lower bound of it.
Moreover, the orange zone is a strong weekly support.
🏹 Thus, the highlighted blue circle is a strong area to look for buy setups as it is the intersection of support and lower blue trendline acting as a non-horizontal support.
📚 As per my trading style:
As #USDJPY approaches the blue circle zone, I will be looking for bullish reversal setups (like a double bottom pattern, trendline break , and so on...)
📚 Always follow your trading plan regarding entry, risk management, and trade management.
Good luck!
All Strategies Are Good; If Managed Properly!
~Rich
Disclosure: I am part of Trade Nation's Influencer program and receive a monthly fee for using their TradingView charts in my analysis.

XAU/USD: Bull or Bear? (READ THE CAPTION)By analyzing the gold chart on the 30-minute timeframe, we can see that yesterday, right after posting the analysis, the price quickly hit the first target at $3307, then experienced a bounce and rallied to the $3369 supply zone. From there, gold faced more downward pressure and eventually reached the targets at $3303, $3297, and nearly $3285.
Currently, gold is trading around $3291, and if $3285 is broken, we could expect further downside toward levels below $3259.
Please support me with your likes and comments to motivate me to share more analysis with you and share your opinion about the possible trend of this chart with me !
Best Regards , Arman Shaban

BOJ Faces Inflation ChallengeThe Japanese yen weakened to around 143 per dollar on Friday, reversing Thursday’s gains as the U.S. dollar rebounded on easing global trade tensions. President Trump reassured markets that U.S.-China trade talks are ongoing, despite China’s denial, and optimism over talks with Japan and South Korea also supported the dollar. Trump also eased monetary policy concerns by clarifying he never intended to remove Fed Chair Jerome Powell.
In Japan, Tokyo’s core inflation rose to 3.4% in April, the highest in two years, posing a challenge for the Bank of Japan as it balances rising inflation with external risks from U.S. tariffs. The BOJ is expected to keep rates steady.
Key resistance is at 144.00, with further levels at 145.90 and 146.75. Support stands at 139.70, followed by 137.00 and 135.00.

USDJPY 1 Hour Timeframe Impulsive Upwave, Break of StructureUSDJPY is potentially ready for the long term upwave. In the 1 hour timeframe, the last impulse broke the previous structure. Waiting on the formation of corrective structure before trading the next upwave.

USDJPY – Searching for a Bottom After a Brutal DropSince the start of the year, USDJPY has been in an almost free fall, losing nearly 2,000 pips and breaking multiple key supports, including the critical 150 level.
Yesterday, we even saw a spike below 140, a level not touched for quite some time.
🔄 However, after that spike, the pair reversed sharply to the upside, showing strong demand in that area.
Interestingly, this zone was tested at the start of 2024 and again back in September, adding even more technical relevance.
📊 Despite the poor outlook for the USD overall, I now expect a meaningful rebound from here, aiming for a retest of the former 146 support, which has now turned into resistance.
💡 Trading Plan:
I will be looking to buy dips near the current support, targeting a 1:3 Risk/Reward setup toward the 146 resistance area.
Disclosure: I am part of Trade Nation's Influencer program and receive a monthly fee for using their TradingView charts in my analyses and educational articles.

USDJPY Buy UpdateUSDJPY Buyers stepping in fully...
Analyzing the information from what the yearly candle printed a strong buy is building up at these level

Bullish bounce?USD/JPY is falling towards the pivot and could bounce to the 1st resistance.
Pivot: 141.82
1st Support: 140.15
1st Resistance: 144.52
Risk Warning:
Trading Forex and CFDs carries a high level of risk to your capital and you should only trade with money you can afford to lose. Trading Forex and CFDs may not be suitable for all investors, so please ensure that you fully understand the risks involved and seek independent advice if necessary.
Disclaimer:
The above opinions given constitute general market commentary, and do not constitute the opinion or advice of IC Markets or any form of personal or investment advice.
Any opinions, news, research, analyses, prices, other information, or links to third-party sites contained on this website are provided on an "as-is" basis, are intended only to be informative, is not an advice nor a recommendation, nor research, or a record of our trading prices, or an offer of, or solicitation for a transaction in any financial instrument and thus should not be treated as such. The information provided does not involve any specific investment objectives, financial situation and needs of any specific person who may receive it. Please be aware, that past performance is not a reliable indicator of future performance and/or results. Past Performance or Forward-looking scenarios based upon the reasonable beliefs of the third-party provider are not a guarantee of future performance. Actual results may differ materially from those anticipated in forward-looking or past performance statements. IC Markets makes no representation or warranty and assumes no liability as to the accuracy or completeness of the information provided, nor any loss arising from any investment based on a recommendation, forecast or any information supplied by any third-party.

Potential bullish rise?USD/JPY has reacted off the support level which is a pullback support that lines up with the 38.2% Fibonacci retracement and could rise from this level to our take profit.
Entry: 142.39
Why we like it:
There is a pullback support level that aligns with the 38.2% Fibonacci retracement.
Stop loss: 140.91
Why we like it:
There is a pullback support level that is slightly above the 78.6% Fibonacci retracement.
Take profit: 144.32
Why we like it:
There is a pullback resistance level that is slightly above the 50% Fibonacci retracement.
Enjoying your TradingView experience? Review us!
Please be advised that the information presented on TradingView is provided to Vantage (‘Vantage Global Limited’, ‘we’) by a third-party provider (‘Everest Fortune Group’). Please be reminded that you are solely responsible for the trading decisions on your account. There is a very high degree of risk involved in trading. Any information and/or content is intended entirely for research, educational and informational purposes only and does not constitute investment or consultation advice or investment strategy. The information is not tailored to the investment needs of any specific person and therefore does not involve a consideration of any of the investment objectives, financial situation or needs of any viewer that may receive it. Kindly also note that past performance is not a reliable indicator of future results. Actual results may differ materially from those anticipated in forward-looking or past performance statements. We assume no liability as to the accuracy or completeness of any of the information and/or content provided herein and the Company cannot be held responsible for any omission, mistake nor for any loss or damage including without limitation to any loss of profit which may arise from reliance on any information supplied by Everest Fortune Group.

USDJPY Idea for short....This chart is a trade setup for the USD/JPY currency pair on a 1-hour timeframe. Here's a breakdown of the key elements in the chart:
Pair: USD/JPY
Timeframe: 1 Hour
🔸 Entry Zone (Sell Area):
Marked in light orange
Price range approximately from 143.000 to 142.710
This is the suggested zone to enter a short (sell) trade.
🔴 Stop Loss (SL):
Level: 143.660
If the price hits this level, the trade should be exited to limit loss.
✅ Targets:
Target 1: 141.828
Target 2: 141.105
Final Target: 140.196
These are take-profit levels where you can partially or fully close the trade to secure profits.
📈 Trade Idea:
The strategy shown in the chart is a short setup, expecting the price to reverse downward after entering the sell zone. The trader anticipates a decline toward the targets, with a clear risk-to-reward plan.

USDJPY On The Verge Of A CollapseA simple trade setup with good risk/reward but with huge economic implications should this structure CRACK!
With all H&S patterns, the risk is that it head tests before breaking down.
We've seen this play out recently in NFLX
That is why it is important to wait for the CRACK! And not front-run the trade.

#USDJPY: 2050+ Pips Swing Buy| Trend Confirmed| Comment Views? **FX:USDJPY** A significant market movement has confirmed, indicating the potential for a substantial bullish swing that could reach approximately 2050 pips. Three targets have been identified, allowing you to select the one that aligns best with your analysis. The primary catalyst for this move is the reversal of the Japanese Yen (JPY) to a bearish trend. It is crucial to employ precise risk management techniques and exercise caution during this period.
Good luck and trade safely.
Thanks for your support! 😊
If you want to help us out, here are a few things you can do:
- Like our ideas
- Comment on our ideas
- Share our ideas
Team Setupsfx_
❤️

USDJPY Short Term Buy Trading Plan Update!!!Hi Traders, on April 23rd I shared this idea "USDJPY Short Term Buy Trading Plan"
I expected bullish continuation higher from the marked Fibonacci support zones. You can read the full post using the link above.
Price reached the first Fibonacci support zone, respected it and bounced higher as expected!!!
If you enjoy this idea, don’t forget to LIKE 👍, FOLLOW ✅, SHARE 🙌, and COMMENT ✍! Drop your thoughts and charts below to keep the discussion going. Your support helps keep this content free and reach more people! 🚀
-------------------------------------------------------------------------------------------------------------------
Disclosure: I am part of Trade Nation's Influencer program and receive a monthly fee for using their TradingView charts in my analysis.

If you are trading JPY, keep an eye on the Tokyo CPIs tomorrowTomorrow, the 25th of April, we are getting the Tokyo CPI figures, which are expected to come out on the higher side. That said, we are looking at the core YoY number, which has a relatively high forecast.
Let's dig in.
FX_IDC:AUDJPY
FX_IDC:USDJPY
FX_IDC:EURJPY
FX_IDC:GBPJPY
Let us know what you think in the comments below.
Thank you.
77.3% of retail investor accounts lose money when trading CFDs with this provider. You should consider whether you understand how CFDs work and whether you can afford to take the high risk of losing your money. Past performance is not necessarily indicative of future results. The value of investments may fall as well as rise and the investor may not get back the amount initially invested. This content is not intended for nor applicable to residents of the UK. Cryptocurrency CFDs and spread bets are restricted in the UK for all retail clients.

USDJPY: This Pattern Shows Global Reversal USDJPY is on the brinks to trigger global reversal to the downside
as large Head & Shoulders reversal pattern has been built on the chart
Bearish Trigger is on the Neckline breakdown
Target is on 117 (height of the Head below Neckline)
Massive drop is expected
It matches the area (blue trendline) where the breakout to upside occured
Invalidation is above the Right Shoulder

GBPAUD DETAILED ANALYSIS FUNDAMENTALS AND TECHNICALSGBPAUD is currently showing strong bullish momentum after a clean bounce from a key support level around 2.0600–2.0700. The pair has formed a textbook bullish flag pattern on the 12H chart, indicating a potential continuation of the prevailing uptrend. Price action is respecting the trend structure well, and a breakout above the descending flag resistance could open the doors toward the next major resistance around 2.20. I'm currently watching the 2.0870–2.0900 zone closely, as a sustained close above this level may trigger a high-probability upside continuation.
From a technical standpoint, this consolidation within the bullish flag is healthy after a strong impulsive move that started in late March. Volume is gradually decreasing within the flag, which often precedes a breakout. The risk-reward setup here is compelling, with a clear invalidation below 2.0450 and a defined target at 2.2000, aligning perfectly with the recent highs and psychological round number.
On the fundamental side, GBP remains well-supported due to the Bank of England’s hawkish tone. Sticky inflation data in the UK is pushing market expectations for further tightening or at least a delay in rate cuts. Meanwhile, AUD continues to lag behind amid concerns over China’s economic recovery and the Reserve Bank of Australia's cautious policy stance. Recent Australian CPI data showed signs of easing inflation, which strengthens the divergence between BOE and RBA, favoring more upside in GBPAUD.
This setup is ideal for swing traders and position traders looking to capture a trend continuation with a clear structure and clean price action. GBPAUD is now on breakout watch and remains one of the top-performing GBP pairs in April. If momentum aligns post-breakout, the 2.20 target could be reached swiftly. Keep this pair on your radar—momentum, structure, and fundamentals are in sync for a bullish scenario.

Bullish bounce off 50% Fibonacci support?USD/JPY is falling towards the pivot and could bounce to the pullback resistance.
Pivot: 141.82
1st Support: 140.15
1st Resistance: 144.52
Risk Warning:
Trading Forex and CFDs carries a high level of risk to your capital and you should only trade with money you can afford to lose. Trading Forex and CFDs may not be suitable for all investors, so please ensure that you fully understand the risks involved and seek independent advice if necessary.
Disclaimer:
The above opinions given constitute general market commentary, and do not constitute the opinion or advice of IC Markets or any form of personal or investment advice.
Any opinions, news, research, analyses, prices, other information, or links to third-party sites contained on this website are provided on an "as-is" basis, are intended only to be informative, is not an advice nor a recommendation, nor research, or a record of our trading prices, or an offer of, or solicitation for a transaction in any financial instrument and thus should not be treated as such. The information provided does not involve any specific investment objectives, financial situation and needs of any specific person who may receive it. Please be aware, that past performance is not a reliable indicator of future performance and/or results. Past Performance or Forward-looking scenarios based upon the reasonable beliefs of the third-party provider are not a guarantee of future performance. Actual results may differ materially from those anticipated in forward-looking or past performance statements. IC Markets makes no representation or warranty and assumes no liability as to the accuracy or completeness of the information provided, nor any loss arising from any investment based on a recommendation, forecast or any information supplied by any third-party.

XAUUSD BULLISH OR BEARISH DETAILED ANALYSISAs a professional forex trader, I'm closely monitoring XAUUSD, currently trading around $3,329. After reaching an all-time high of $3,500 earlier this week, gold has pulled back due to profit-taking and improved risk sentiment following President Trump's softened stance on the Federal Reserve and U.S.-China trade relations. citeturn0news46 Despite this correction, the broader trend remains bullish, with the market finding support near $3,228, a level that has attracted buying interest.
Technically, gold is rebounding from this key support level, suggesting the potential for a renewed upward move. The price action indicates that buyers are stepping in, viewing the dip as a buying opportunity within the ongoing uptrend. A sustained move above $3,400 could open the path toward the next resistance levels, with a target price around $3,500.
Fundamentally, expectations for Federal Reserve rate cuts in 2025, starting as early as June, are supportive of gold prices. citeturn0news35 Additionally, ongoing geopolitical uncertainties and concerns about global economic growth continue to underpin demand for safe-haven assets like gold. These factors contribute to a favorable environment for gold bulls in the medium term.
In summary, the recent pullback in XAUUSD appears to be a healthy correction within a larger bullish trend. The rebound from support levels, combined with supportive fundamentals, suggests that gold may be poised for another leg higher. Traders should watch for a break above $3,400 as confirmation of the next bullish wave.
