USDJPY On The Verge Of A CollapseA simple trade setup with good risk/reward but with huge economic implications should this structure CRACK!
With all H&S patterns, the risk is that it head tests before breaking down.
We've seen this play out recently in NFLX
That is why it is important to wait for the CRACK! And not front-run the trade.
USDJPY

#USDJPY: 2050+ Pips Swing Buy| Trend Confirmed| Comment Views? **FX:USDJPY** A significant market movement has confirmed, indicating the potential for a substantial bullish swing that could reach approximately 2050 pips. Three targets have been identified, allowing you to select the one that aligns best with your analysis. The primary catalyst for this move is the reversal of the Japanese Yen (JPY) to a bearish trend. It is crucial to employ precise risk management techniques and exercise caution during this period.
Good luck and trade safely.
Thanks for your support! 😊
If you want to help us out, here are a few things you can do:
- Like our ideas
- Comment on our ideas
- Share our ideas
Team Setupsfx_
❤️

USDJPY Short Term Buy Trading Plan Update!!!Hi Traders, on April 23rd I shared this idea "USDJPY Short Term Buy Trading Plan"
I expected bullish continuation higher from the marked Fibonacci support zones. You can read the full post using the link above.
Price reached the first Fibonacci support zone, respected it and bounced higher as expected!!!
If you enjoy this idea, don’t forget to LIKE 👍, FOLLOW ✅, SHARE 🙌, and COMMENT ✍! Drop your thoughts and charts below to keep the discussion going. Your support helps keep this content free and reach more people! 🚀
-------------------------------------------------------------------------------------------------------------------
Disclosure: I am part of Trade Nation's Influencer program and receive a monthly fee for using their TradingView charts in my analysis.

If you are trading JPY, keep an eye on the Tokyo CPIs tomorrowTomorrow, the 25th of April, we are getting the Tokyo CPI figures, which are expected to come out on the higher side. That said, we are looking at the core YoY number, which has a relatively high forecast.
Let's dig in.
FX_IDC:AUDJPY
FX_IDC:USDJPY
FX_IDC:EURJPY
FX_IDC:GBPJPY
Let us know what you think in the comments below.
Thank you.
77.3% of retail investor accounts lose money when trading CFDs with this provider. You should consider whether you understand how CFDs work and whether you can afford to take the high risk of losing your money. Past performance is not necessarily indicative of future results. The value of investments may fall as well as rise and the investor may not get back the amount initially invested. This content is not intended for nor applicable to residents of the UK. Cryptocurrency CFDs and spread bets are restricted in the UK for all retail clients.

USDJPY: This Pattern Shows Global Reversal USDJPY is on the brinks to trigger global reversal to the downside
as large Head & Shoulders reversal pattern has been built on the chart
Bearish Trigger is on the Neckline breakdown
Target is on 117 (height of the Head below Neckline)
Massive drop is expected
It matches the area (blue trendline) where the breakout to upside occured
Invalidation is above the Right Shoulder

GBPAUD DETAILED ANALYSIS FUNDAMENTALS AND TECHNICALSGBPAUD is currently showing strong bullish momentum after a clean bounce from a key support level around 2.0600–2.0700. The pair has formed a textbook bullish flag pattern on the 12H chart, indicating a potential continuation of the prevailing uptrend. Price action is respecting the trend structure well, and a breakout above the descending flag resistance could open the doors toward the next major resistance around 2.20. I'm currently watching the 2.0870–2.0900 zone closely, as a sustained close above this level may trigger a high-probability upside continuation.
From a technical standpoint, this consolidation within the bullish flag is healthy after a strong impulsive move that started in late March. Volume is gradually decreasing within the flag, which often precedes a breakout. The risk-reward setup here is compelling, with a clear invalidation below 2.0450 and a defined target at 2.2000, aligning perfectly with the recent highs and psychological round number.
On the fundamental side, GBP remains well-supported due to the Bank of England’s hawkish tone. Sticky inflation data in the UK is pushing market expectations for further tightening or at least a delay in rate cuts. Meanwhile, AUD continues to lag behind amid concerns over China’s economic recovery and the Reserve Bank of Australia's cautious policy stance. Recent Australian CPI data showed signs of easing inflation, which strengthens the divergence between BOE and RBA, favoring more upside in GBPAUD.
This setup is ideal for swing traders and position traders looking to capture a trend continuation with a clear structure and clean price action. GBPAUD is now on breakout watch and remains one of the top-performing GBP pairs in April. If momentum aligns post-breakout, the 2.20 target could be reached swiftly. Keep this pair on your radar—momentum, structure, and fundamentals are in sync for a bullish scenario.

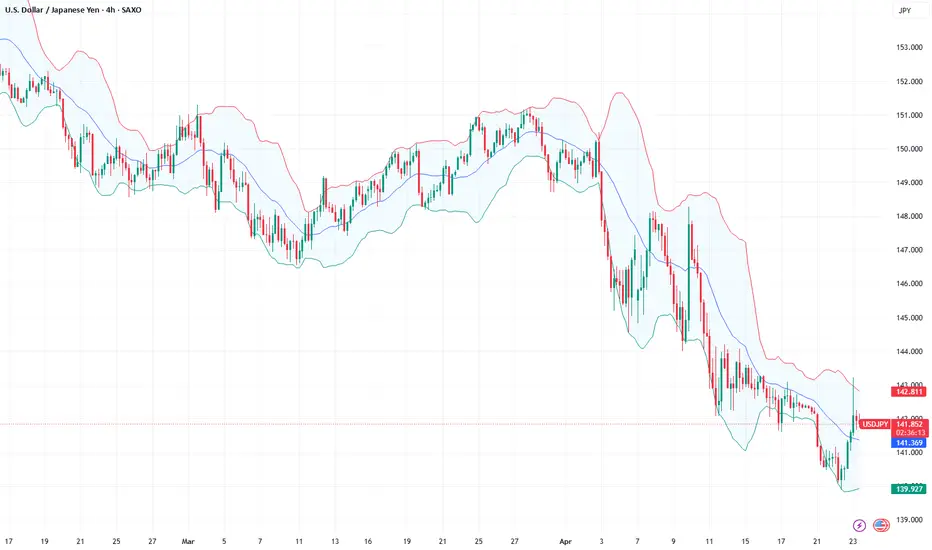
Bullish bounce off 50% Fibonacci support?USD/JPY is falling towards the pivot and could bounce to the pullback resistance.
Pivot: 141.82
1st Support: 140.15
1st Resistance: 144.52
Risk Warning:
Trading Forex and CFDs carries a high level of risk to your capital and you should only trade with money you can afford to lose. Trading Forex and CFDs may not be suitable for all investors, so please ensure that you fully understand the risks involved and seek independent advice if necessary.
Disclaimer:
The above opinions given constitute general market commentary, and do not constitute the opinion or advice of IC Markets or any form of personal or investment advice.
Any opinions, news, research, analyses, prices, other information, or links to third-party sites contained on this website are provided on an "as-is" basis, are intended only to be informative, is not an advice nor a recommendation, nor research, or a record of our trading prices, or an offer of, or solicitation for a transaction in any financial instrument and thus should not be treated as such. The information provided does not involve any specific investment objectives, financial situation and needs of any specific person who may receive it. Please be aware, that past performance is not a reliable indicator of future performance and/or results. Past Performance or Forward-looking scenarios based upon the reasonable beliefs of the third-party provider are not a guarantee of future performance. Actual results may differ materially from those anticipated in forward-looking or past performance statements. IC Markets makes no representation or warranty and assumes no liability as to the accuracy or completeness of the information provided, nor any loss arising from any investment based on a recommendation, forecast or any information supplied by any third-party.

XAUUSD BULLISH OR BEARISH DETAILED ANALYSISAs a professional forex trader, I'm closely monitoring XAUUSD, currently trading around $3,329. After reaching an all-time high of $3,500 earlier this week, gold has pulled back due to profit-taking and improved risk sentiment following President Trump's softened stance on the Federal Reserve and U.S.-China trade relations. citeturn0news46 Despite this correction, the broader trend remains bullish, with the market finding support near $3,228, a level that has attracted buying interest.
Technically, gold is rebounding from this key support level, suggesting the potential for a renewed upward move. The price action indicates that buyers are stepping in, viewing the dip as a buying opportunity within the ongoing uptrend. A sustained move above $3,400 could open the path toward the next resistance levels, with a target price around $3,500.
Fundamentally, expectations for Federal Reserve rate cuts in 2025, starting as early as June, are supportive of gold prices. citeturn0news35 Additionally, ongoing geopolitical uncertainties and concerns about global economic growth continue to underpin demand for safe-haven assets like gold. These factors contribute to a favorable environment for gold bulls in the medium term.
In summary, the recent pullback in XAUUSD appears to be a healthy correction within a larger bullish trend. The rebound from support levels, combined with supportive fundamentals, suggests that gold may be poised for another leg higher. Traders should watch for a break above $3,400 as confirmation of the next bullish wave.

Haven play: Long yen back in focusAmid growing uncertainty surrounding U.S. equities and the US dollar, investors could be returning to a traditional defensive strategy: going long on the Japanese yen.
While some analysts believe the recent yen rally is not yet overstretched, the International Monetary Fund (IMF) has noted that Japan’s central bank is likely to push back the timing of further interest rate hikes, a factor that could limit the yen's potential to strengthen further. As such, we are looking at the support level of 140.00 and the bearish-yen sentiment seen today, and the potential resistance at 144.80.
Up next: a scheduled meeting between Japan’s Finance Minister Kato and U.S. Treasury Secretary Bessent later this week.

Weekly FOREX Forecast: Mid-Week UPDATES! In this video, we will update Sunday's forecasts for the following FX markets:
USD Index
EURUSD
GBPUSD
AUDUSD
NZDUSD
USDCAD
USDCHF
USDJPY
Enjoy!
May profits be upon you.
Leave any questions or comments in the comment section.
I appreciate any feedback from my viewers!
Like and/or subscribe if you want more accurate analysis.
Thank you so much!
Disclaimer:
I do not provide personal investment advice and I am not a qualified licensed investment advisor.
All information found here, including any ideas, opinions, views, predictions, forecasts, commentaries, suggestions, expressed or implied herein, are for informational, entertainment or educational purposes only and should not be construed as personal investment advice. While the information provided is believed to be accurate, it may include errors or inaccuracies.
I will not and cannot be held liable for any actions you take as a result of anything you read here.
Conduct your own due diligence, or consult a licensed financial advisor or broker before making any and all investment decisions. Any investments, trades, speculations, or decisions made on the basis of any information found on this channel, expressed or implied herein, are committed at your own risk, financial or other wise. In this video, we will update the forecasts for the following FX markets:

EUR/USD Explosion or Trap?EUR Futures
Asset Managers: Strongly net long and continuously increasing since December 2024 → a clear sign of institutional confidence in the euro.
Leveraged Money: Also rising, moving from net short to net long → sentiment reversal even from speculators.
✅ Interpretation: Both institutional categories are bullish on the euro, suggesting potential upward support for EUR/USD.
USD Index Futures
Asset Managers: Decreasing since the end of February → reducing long exposure on the dollar.
Leveraged Money: Recovering from net short, but still uncertain → mixed sentiment.
⚠️ Interpretation: The dollar is structurally weakening. This reinforces the bullish bias on EUR/USD.
🧠 Technical Analysis – EUR/USD Weekly Chart
Current price: 1.13150, right in the middle of a weekly/monthly supply zone, marked by upper wicks → clear seller presence.
Price has made a strong rally from 1.03600, breaking through all intermediate supply zones.
RSI: Slightly declining after previously reaching overbought territory.
📌 Key levels:
Major support: 1.1000–1.1080
Structural resistance: 1.1350–1.1450 (current zone)
🧠 Technical Scenario:
If price holds above 1.1250, we could see an extension toward 1.1500.
If it breaks below 1.1200, a pullback toward 1.1080–1.1000 is likely.
✅ Trade Summary:
COT bias: Bullish EUR/USD → strong EUR, weakening USD
Technical: Watch price behavior in the 1.1350 zone → if rejection continues, expect a technical retracement before potential continuation.
🎯 Potential Setups:
Long on pullback toward 1.1080
Breakout long above 1.1450 → targeting 1.1600
Short-term short if bearish price action appears in the current zone

Daily Price Action: USDJPY Wednesday 4/23/2025In this video, we will be looking into the potential price action of USDJPY.

USDJPY INTRADAY Bearish below resistance at 144.60The USDJPY pair is exhibiting a bearish sentiment, reinforced by the ongoing downtrend. The key trading level to watch is at 145.60, which represents the current intraday swing low and the falling resistance trendline level.
In the short term, an oversold rally from current levels, followed by a bearish rejection at the 145.60 resistance, could lead to a downside move targeting support at 141.00, with further potential declines to 139.50 and 138.40 over a longer timeframe.
On the other hand, a confirmed breakout above the 145.60 resistance level and a daily close above that mark would invalidate the bearish outlook. This scenario could pave the way for a continuation of the rally, aiming to retest the 147.90 resistance, with a potential extension to 149.00 levels.
Conclusion:
Currently, the USDJPY sentiment remains bearish, with the 145.60 level acting as a pivotal resistance. Traders should watch for either a bearish rejection at this level or a breakout and daily close above it to determine the next directional move. Caution is advised until the price action confirms a clear break or rejection.
This communication is for informational purposes only and should not be viewed as any form of recommendation as to a particular course of action or as investment advice. It is not intended as an offer or solicitation for the purchase or sale of any financial instrument or as an official confirmation of any transaction. Opinions, estimates and assumptions expressed herein are made as of the date of this communication and are subject to change without notice. This communication has been prepared based upon information, including market prices, data and other information, believed to be reliable; however, Trade Nation does not warrant its completeness or accuracy. All market prices and market data contained in or attached to this communication are indicative and subject to change without notice.

USDJPY Short Term Buy Trading PlanM15 - Strong bullish momentum followed by a pullback
No opposite signs
Expecting bullish continuation until the two Fibonacci support zones hold.
If you enjoy this idea, don’t forget to LIKE 👍, FOLLOW ✅, SHARE 🙌, and COMMENT ✍! Drop your thoughts and charts below to keep the discussion going. Your support helps keep this content free and reach more people! 🚀
--------------------------------------------------------------------------------------------------------------------
Disclosure: I am part of Trade Nation's Influencer program and receive a monthly fee for using their TradingView charts in my analysis.

USDJPY Is Going Up! Buy!
Take a look at our analysis for USDJPY.
Time Frame: 9h
Current Trend: Bullish
Sentiment: Oversold (based on 7-period RSI)
Forecast: Bullish
The market is testing a major horizontal structure 141.912.
Taking into consideration the structure & trend analysis, I believe that the market will reach 145.882 level soon.
P.S
The term oversold refers to a condition where an asset has traded lower in price and has the potential for a price bounce.
Overbought refers to market scenarios where the instrument is traded considerably higher than its fair value. Overvaluation is caused by market sentiments when there is positive news.
Disclosure: I am part of Trade Nation's Influencer program and receive a monthly fee for using their TradingView charts in my analysis.
Like and subscribe and comment my ideas if you enjoy them!

Market Analysis: USD/JPY Eyes Fresh IncreaseMarket Analysis: USD/JPY Eyes Fresh Increase
USD/JPY is rising and might gain pace above the 142.45 resistance.
Important Takeaways for USD/JPY Analysis Today
- USD/JPY climbed higher above the 141.00 and 141.65 levels.
- There was a break above a connecting bearish trend line with resistance at 141.20 on the hourly chart at FXOpen.
USD/JPY Technical Analysis
On the hourly chart of USD/JPY at FXOpen, the pair started a fresh upward move from the 140.00 zone. The US Dollar gained bullish momentum above 141.65 against the Japanese Yen.
There was a break above a connecting bearish trend line with resistance at 141.20. It even cleared the 50-hour simple moving average and 142.45. The pair climbed above 143.00 and traded as high as 143.21 before there was a downside correction.
The pair dipped below the 23.6% Fib retracement level of the upward move from the 139.88 swing low to the 143.21 high. The current price action above the 141.65 level is positive.
Immediate resistance on the USD/JPY chart is near 142.45. The first major resistance is near 143.20. If there is a close above the 143.20 level and the RSI moves above 75, the pair could rise toward 144.50.
The next major resistance is near 145.00, above which the pair could test 148.00 in the coming days. On the downside, the first major support is 141.65 and the 50% Fib retracement level of the upward move from the 139.88 swing low to the 143.21 high.
The next major support is visible near the 141.00 level. If there is a close below 141.00, the pair could decline steadily. In the stated case, the pair might drop toward the 139.90 support zone. The next stop for the bears may perhaps be near the 137.50 region.
This article represents the opinion of the Companies operating under the FXOpen brand only. It is not to be construed as an offer, solicitation, or recommendation with respect to products and services provided by the Companies operating under the FXOpen brand, nor is it to be considered financial advice.

Fundamental Market Analysis for April 23, 2025 USDJPYThe Japanese yen (JPY) declined against its US counterpart for a second straight day on Wednesday and retreated further from the multi-month peak reached the previous day. The Trump administration officials' comforting comments on US-China trade talks triggered a sharp rebound in global risk sentiment, which in turn had a strong impact on traditional safe-haven assets, including the yen. Moreover, a slight recovery in the US dollar (USD) from multi-year lows, supported by easing concerns over Federal Reserve (Fed) independence, pushed the USD/JPY pair to a one-week high, a level above 143.000 during the Asian session.
Growing optimism that the US and Japan are moving closer to a temporary trade agreement is helping the yen, which reacted weakly to unimpressive domestic PMIs, to pause its intraday decline. In addition, strengthening expectations that the Bank of Japan (BoJ) will continue to raise interest rates in 2025 is keeping JPY bears from betting aggressively. Meanwhile, investors are losing confidence in the US economy amid Trump's rapidly shifting stance on trade policy. This, as well as bets that the Fed will soon resume its rate-cutting cycle, is holding back the dollar and taking the USD/JPY pair below 142.000 in the last hour.
Trading recommendation: SELL 141.700, SL 142.100, TP 140.500
USDJPY Potential DownsidesHey Traders, in today's trading session we are monitoring USDJPY for a selling opportunity around 141.600 zone, USDJPY is trading in downtrend and currently is in a correction phase in which it is approaching the trend at 141.600 support and resistance area.
Trade safe, Joe.

Potential bullish rise?USD/JPY is falling towards the support level which is a pullback support and could bounce from this level to our take profit.
Entry: 140.98
Why we like it:
There is a pullback support level.
Stop loss: 140.24
Why we like it:
There is a pullback support level that lines up with the 78.6% Fibonacci retracement.
Take profit: 142.41
Why we like it:
There is a pullback resistance level that lines up with the 78.6% Fibonacci retracement.
Enjoying your TradingView experience? Review us!
Please be advised that the information presented on TradingView is provided to Vantage (‘Vantage Global Limited’, ‘we’) by a third-party provider (‘Everest Fortune Group’). Please be reminded that you are solely responsible for the trading decisions on your account. There is a very high degree of risk involved in trading. Any information and/or content is intended entirely for research, educational and informational purposes only and does not constitute investment or consultation advice or investment strategy. The information is not tailored to the investment needs of any specific person and therefore does not involve a consideration of any of the investment objectives, financial situation or needs of any viewer that may receive it. Kindly also note that past performance is not a reliable indicator of future results. Actual results may differ materially from those anticipated in forward-looking or past performance statements. We assume no liability as to the accuracy or completeness of any of the information and/or content provided herein and the Company cannot be held responsible for any omission, mistake nor for any loss or damage including without limitation to any loss of profit which may arise from reliance on any information supplied by Everest Fortune Group.


Yen extends gains, BOJ Core CPI lower than expectedThe Japanese yen has rallied for a third straight day. In the European session, USD/JPY is trading at 140.38, down 0.33% on the day. The yen has climbed 1.3% since Thursday, as the US dollar is under pressure against the major currencies.
BoJ Core CPI, a key inflation indicator, remained at 2.2% for a third consecutive month in March, shy of the forecast of 2.4%. This follows Japan's National Core CPI, which rose 3.2% y/y, matching expectations but higher than the 3.0% gain in February. National CPI eased to 3.6%, down from 3.7% in February and below the market estimate of 3.7%.
The inflation data comes a week before the BoJ's policy meeting next week. The central bank has signaled that it will continue to raise interest rates as wages and inflation have been rising. However, the risks to inflation and growth from US tariffs have muddied the rate outlook and the BoJ may decide to push off another hike until later in the year.
The finance ministers of Japan and the US will meet later this week, as Tokyo looks to carve out some tariff exemptions. The BoJ is likely to sit tight and see if the talks lead to a breakthrough. The US is expected to bring up the exchange rate, as President Trump has accused Japan of deliberately keeping the yen weak in order to protect its export sector.
There are no key releases out of the US today, but we'll hear from three FOMC members later today. The markets have priced in a rate cut in May at 10%, with a 62% probability of a rate cut in June.

USD/JPY Analysis: Exchange Rate Falls Below 140 Yen per DollarUSD/JPY Analysis: Exchange Rate Falls Below 140 Yen per Dollar Today
As shown on the USD/JPY chart today, the exchange rate between the US dollar and Japanese yen has fallen below 140 yen per dollar – marking the first time this has occurred in 2025. Since the beginning of the year, the rate has dropped by approximately 11%.
Among the main driving factors is the White House's tariff policy, which has triggered a sell-off in US government bonds and a weakening of the dollar. One of the more recent developments includes the release of the Consumer Price Index report by the Bank of Japan, which revealed that the CPI remained steady at 2.2%, despite analysts (according to ForexFactory) forecasting a rise to 2.4%.
It’s possible that, due to the lack of inflationary pressure in Japan, the yen is in a relatively stronger position compared to the US currency, where concerns persist that trade wars and Trump’s push for lower interest rates may lead to a spike in inflation and a devaluation of the dollar.
Technical Analysis of the USD/JPY Chart
It’s worth noting that the psychological level of 140 yen per dollar has acted as key support since late 2023. On the rare occasions when the rate has dipped below this mark, the bulls have soon regained confidence, prompting a reversal.
It’s quite possible we may witness a similar attempt on the USD/JPY chart in the coming weeks or even days. However, the current outlook remains bearish, as the price has broken below the Descending Wedge pattern (marked with black lines), indicating that supply is outweighing demand.
This article represents the opinion of the Companies operating under the FXOpen brand only. It is not to be construed as an offer, solicitation, or recommendation with respect to products and services provided by the Companies operating under the FXOpen brand, nor is it to be considered financial advice.

USD/JPY in Free Fall: What’s Behind the Break Below 140?🔍 Technical Analysis – USD/JPY
The weekly chart shows a sharp rejection in the macro zone between 155–158, where strong supply is present (highlighted in red). After brushing historical highs, USD/JPY experienced a vertical drop down to 140, decisively breaking through the key zone at 148–146.
Price has now broken the weekly structure and is approaching an area that previously triggered significant rallies (blue zone between 138–141). Monthly support is in danger, with the RSI deeply in oversold territory, but no clear reversal signals just yet.
📊 COT Report – USD Index
Asset Managers: Slight recovery on long positions, but still in neutral territory.
Leverage Money: Increasing net shorts, indicating speculative bets against the dollar.
The divergence between the falling USD Index and speculative positions confirms a growing lack of confidence in the greenback.
📊 COT Report – JPY Futures
Asset Managers: Strong increase in long positions on the yen since December 2024.
Leverage Money: Reinforcing long bias since February 2025.
This confirms that institutional players are accumulating yen, possibly anticipating BoJ interventions or a broader flight-to-safety.
💥 Trade Outlook
USD/JPY is in full bearish breakout mode. If the 140 level breaks decisively, the next technical targets are:
137.00 → historical mid-level support
134.00 → base of the 2023 structure
Keep an eye on the RSI: a bullish divergence with strong volume could trigger a technical rebound. But as long as the overall sentiment remains strongly risk-off, every rally is a selling opportunity.
