Weekly FOREX Forecast: USD Is Bullish Vs EUR, GBP, AUD NZDWelcome back to the Weekly Forex Forecast!
This is Part 1 of the FOREX futures outlook for the week of Nov 24-28th.
In this video, we will analyze the following FX markets:
USD Index, EUR, GBP, AUD, NZD
Enjoy!
May profits be upon you.
Leave any questions or comments in the comment section.
I appreciate any feedback from my viewers!
Like and/or subscribe if you want more accurate analysis.
Thank you so much!
Disclaimer:
I do not provide personal investment advice and I am not a qualified licensed investment advisor.
All information found here, including any ideas, opinions, views, predictions, forecasts, commentaries, suggestions, expressed or implied herein, are for informational, entertainment or educational purposes only and should not be construed as personal investment advice. While the information provided is believed to be accurate, it may include errors or inaccuracies.
I will not and cannot be held liable for any actions you take as a result of anything you read here.
Conduct your own due diligence, or consult a licensed financial advisor or broker before making any and all investment decisions. Any investments, trades, speculations, or decisions made on the basis of any information found on this channel, expressed or implied herein, are committed at your own risk, financial or otherwise.
DJ FXCM Index

Forex: Weekly Review Overall market sentiment was, at best, 'choppy' during the week starting Monday 17 November.
A continuation of recent themes (AI overvaluation concerns / hawkish FED repricing) ensured an underlying tentativiity throughout the week and any positivity was short lived (NVIDEA earnings / GOOGLE positivity). Even the return of NFP, with a headline beat, ultimately proved negative as a December FED rate cut diminished to 30%.
All in all, it's a difficult environment, correlations have broken down, particularly the JPY, which struggled throughout the week thanks to the government stimulus. And It currently appears the BOJ don't have rate hike plans until spring 2026. Which brings intervention chatter to the fore. It's likely the BOJ will synchronise intervention with 'soft' US data. And once the BOJ do intervene, it will ultimately be a 'short JPY opportunity'. In the meantime 'verbal intervention threats' (jawboning) will be a 'risk' to any short JPY trades.
The AUD continues to under perform its fundamentals, weighed down by the tepid environment. And the run of soft UK data continues, the GBP remains remarkably resilient. All eyes are on the upcoming UK budget.
On Friday, we did get a FED twist, against the grain, New York FED president WILLIAMS mooted a near term rate cut. There is a theory this was a coordinated speech, lining up a December cut, appeasing the market and swinging the FED RATE MONITOR back towards a December cut. Whether it will prove to be a short lived 'relief bounce', only time will tell. The sooner we get a run of 'real time' US data, the better.
I begin the new week without a clear bias, I'll be reading headlines and watching the VIX in an attempt to guage how serious the market is one way or the other.
On a personal note, it was a week I found difficult to form a solid conviction, only one trade. And it was a particularly speculative AUD CHF short, when I felt the chart was going to roll over. The trade stopped out quite quickly during one of those brief periods of positivity. I'm currently envisioning a continuation of only one or two trades per week and I'm content to slightly up my risk percentage in an attempt to make up the numbers.
Let's see what the new week brings.

Potential bullish rise?US Dollar Index (DXY) has bounced off the pivot and could rise to the 1st resistance.
Pivot: 99.41
1st Support: 98.61
1st Resistance: 101.92
Disclaimer:
The opinions given above constitute general market commentary and do not constitute the opinion or advice of IC Markets or any form of personal or investment advice.
Any opinions, news, research, analyses, prices, other information, or links to third-party sites contained on this website are provided on an "as-is" basis, are intended to be informative only, and are not advice, a recommendation, research, a record of our trading prices, an offer of, or solicitation for, a transaction in any financial instrument and thus should not be treated as such. The information provided does not involve any specific investment objectives, financial situation, or needs of any specific person who may receive it. Please be aware that past performance is not a reliable indicator of future performance and/or results. Past performance or forward-looking scenarios based upon the reasonable beliefs of the third-party provider are not a guarantee of future performance. Actual results may differ materially from those anticipated in forward-looking or past performance statements. IC Markets makes no representation or warranty and assumes no liability as to the accuracy or completeness of the information provided, nor any loss arising from any investment based on a recommendation, forecast, or any information supplied by any third party.

US Dollar: Look For Buys As The Pullback Ends!Welcome back to the Weekly Forex Forecast for the week of Nov. 17 - 21st.
In this video, we will analyze the following FX market: USD Dollar
The USD was in retracement last week. It looks like that may be ending, and a new bullish leg could potential start early this week.
Wait patiently for the bullish shift in the market at a key poi... like the Weekly +FVG highlighted in the video. The 1H TF should make this obvious, and look to long the USD against its currency counterparts.
Enjoy!
May profits be upon you.
Leave any questions or comments in the comment section.
I appreciate any feedback from my viewers!
Disclaimer:
I do not provide personal investment advice and I am not a qualified licensed investment advisor.
All information found here, including any ideas, opinions, views, predictions, forecasts, commentaries, suggestions, expressed or implied herein, are for informational, entertainment or educational purposes only and should not be construed as personal investment advice. While the information provided is believed to be accurate, it may include errors or inaccuracies.
I will not and cannot be held liable for any actions you take as a result of anything you read here.
Conduct your own due diligence, or consult a licensed financial advisor or broker before making any and all investment decisions. Any investments, trades, speculations, or decisions made on the basis of any information found on this channel, expressed or implied herein, are committed at your own risk, financial or otherwise.

USDJPY long-term bullish within 3-year Channel UpThe USDJPY pair has been trading within a 3-year Channel Up ever since the October 17 2022 High.
Right now it has been unfolding its latest Bullish Leg since the April 21 2025 bottom (Higher Low), turning its 1W RSI this week overbought (>70.00).
This signal along with the similarities with the June 26 2023 local High, point towards a potential short-term pull-back to test the 1W MA50 (blue trend-line) - 1D MA100 (red trend-line) Support cluster.
As you can see, those have been the two Support levels on every major rally within this 3-year pattern.
As a result, we will look for an additional opportunity to buy there, maintaining a medium-term Target for this pair at 161.500 (Resistance 1).
---
** Please LIKE 👍, FOLLOW ✅, SHARE 🙌 and COMMENT ✍ if you enjoy this idea! Also share your ideas and charts in the comments section below! This is best way to keep it relevant, support us, keep the content here free and allow the idea to reach as many people as possible. **
---
💸💸💸💸💸💸
👇 👇 👇 👇 👇 👇

GBP/USD - Fundamental Ahead - UK Tax & Upcoming Budget The GBP/USD Pair, Price has been trading within a wedge Pattern on the H1 chart, forming consistent lower highs and lower lows. Price action is now testing the lower boundary of the pattern, signalling a possible breakdown. FPMARKETS:GBPUSD
✅Market Context:
1️⃣Downward structure building inside the pattern.
2️⃣Sellers are showing strength near support levels.
3️⃣Breakdown below the trendline indicates momentum continuation toward lower zones.
✅Trade Plan:
Entry: Sell after confirmed breakdown below the support (Candle close below trendline or retest of the breakout).
💰Take Profit (TP): At the Key Zone – major support area identified ahead.
🛑Stop Loss (SL): Above the pattern structure / recent swing high.
✅Psychological Discipline:
1️⃣Stick to plan – No Revenge Trades.
2️⃣Accept losing trades as part of the strategy.
3️⃣Risk only 1–2% of your account balance per trade.
✅ Support this analysis with a
LIKE 👍 | COMMENT 💬 | FOLLOW 🔔
It helps a lot & keeps the ideas coming!
⚠️ Disclaimer: This analysis is for educational purposes only and does not constitute financial advice. Forex trading involves high risk. Trade only with capital you can afford to lose and always do your own research.

Bullish bounce off?US Dollar Index (DXY) is falling towards the pivot and could bounce to the 1st resistance resistance.
Pivot: 99.78
1st Support: 99.34
1st Resistance: 100.71
Disclaimer:
The opinions given above constitute general market commentary and do not constitute the opinion or advice of IC Markets or any form of personal or investment advice.
Any opinions, news, research, analyses, prices, other information, or links to third-party sites contained on this website are provided on an "as-is" basis, are intended to be informative only, and are not advice, a recommendation, research, a record of our trading prices, an offer of, or solicitation for, a transaction in any financial instrument and thus should not be treated as such. The information provided does not involve any specific investment objectives, financial situation, or needs of any specific person who may receive it. Please be aware that past performance is not a reliable indicator of future performance and/or results. Past performance or forward-looking scenarios based upon the reasonable beliefs of the third-party provider are not a guarantee of future performance. Actual results may differ materially from those anticipated in forward-looking or past performance statements. IC Markets makes no representation or warranty and assumes no liability as to the accuracy or completeness of the information provided, nor any loss arising from any investment based on a recommendation, forecast, or any information supplied by any third party.

USD Re-Tests Massive Resistance Level as Rate Cut Rally Goes OnSeptember 18th of last year - that's when the Fed cut rates for the first time in that cycle, and the US Dollar set a fresh low at 100.22, building a falling wedge in the currency at the time.
That was a 'jumbo' rate cut, by the way, with the Fed knocking rates back by 50 basis points and it was the first rate cut since they had to quickly tighten rates to try to soften inflation following the spike in 2021 and 2022.
But that seemed to matter little, even though markets held expectation for more softening in 2024 which the Fed delivered with another 50 bps of moderation. That 100.22 level stood as key support - bulls rallied out of the falling wedge, and as we went into Q4, buyers took over in a very big way.
That rally held through the New Year open and then another theme took over - fear - driven by the very unknown prospect of massive tariffs levied by the US on pretty much the rest of the world. Quickly forecasts began to turn dim and fears of recession took over which, of course, were expected to be met by rate cuts.
While Trump took a step back from tariff implementation in April, allowing for both equities and USD/JPY to recover, there's remained an expectation for FOMC softening, and we've already seen two rate cuts.
But, interestingly, ever since the first cut on September 17th of this year, DXY has been pushing both higher-highs and higher-lows - and right now - the same swing low from last year of 100.22 is in-play as resistance.
This retains a bullish appearance for the greenback as the test at this level two weeks ago marked a fresh four month high. The monthly chart showed a morning star that completed in October, and the weekly and daily chart clearly shows the falling wedge breakout - all factors that point to potential strength.
Perhaps the bigger item at the moment is in that large component of DXY of the Euro, which is a 57.6% clip of the Dollar basket. EUR/USD is bearing down for another test of the 1.1500 figure, which, historically speaking, is not a level that gives way easily in the pair. - js

GBP/USD - H1 - Trendline Breakout (19.11.2025)🧠 Setup Overview FX:GBPUSD
GBP/USD has broken below a long-term ascending trendline, followed by a clean retest rejection — a strong bearish confirmation signal.
Price also remains below the resistance zone (1.3180–1.3200) and is showing consistent lower highs, indicating sellers are gaining control.
With bearish fundamentals supporting USD strength, further downside pressure is expected.
📊 Trading Plan🔻 Sell Bias (Primary Scenario)
Look for bearish candles forming below the trendline retest
Target the next support levels
🎯 Targets:
1st Support: 1.3077
2nd Support: 1.3039
❌ Invalidation:
A break and close above 1.3200 (resistance zone) cancels the bearish view
⚡ Fundamental Outlook – Today (19 Nov 2025)
🇺🇸 USD Fundamentals
1️⃣ U.S. yields continue to climb as investors expect the Federal Reserve to maintain tight policy for longer due to sticky inflation.→ Higher yields → Stronger USD
2️⃣ Risk sentiment remains weak, with markets rotating into safe-haven assets, supporting USD strength.
🇬🇧 GBP Fundamentals
3️⃣ UK economy shows slowing momentum, and BoE policymakers remain cautious.
→ Weaker GBP outlook
➡️ Combined outlook favors a bearish continuation on GBP/USD.
#GBPUSD #Forex #TechnicalAnalysis #PriceAction #TrendlineBreak #BearishSetup #USD #GBP #ForexSignals #TradingView #KABHI_TA_TRADING #ChartsDontLieTradersDontQuit #FXMarket #SupportAndResistance #MarketBreakdown
⚠️ Disclaimer
This analysis is for educational purposes only.
Not financial advice — always confirm entries and manage your risk properly.
💬 Support My Work ❤️
If you find this helpful:👍 LIKE💬 COMMENT🔔 FOLLOW
Your support motivates me to post more daily trade setups!

GBP/USD - Triangle Breakout (18.11.2025)🧠 Setup Overview
GBP/USD has broken below the triangle structure, signaling a shift toward bearish momentum after repeated rejections from the upper trendline.
Price is sitting under the breakout region, indicating that sellers are gaining control.
With fundamentals supporting USD strength, the downside continuation scenario looks favorable.
📊 Trading Plan🔻 Primary Bias: Sell
Wait for a retest & rejection near the triangle support-turned-resistance
Look for continuation toward the lower support zones
🎯 Targets:
1st Support: 1.3091
2nd Support: 1.3062
#GBPUSD #Forex #TechnicalAnalysis #PriceAction #TriangleBreakout #BearishBias #USD #GBP #ForexSignals #TradingView #KABHI_TA_TRADING #ChartsDontLieTradersDontQuit #FXMarket #TrendlineBreak #SupportAndResistance
⚠️ Disclaimer
This analysis is for educational purposes only and does not constitute financial advice.
Always follow your confirmation signals and risk management rules before trading.
💬 Support My Work ❤️
If this analysis helps you: 👍 LIKE💬 COMMENT🔔 FOLLOW
Your support motivates me to post more clean and consistent chart breakdowns!

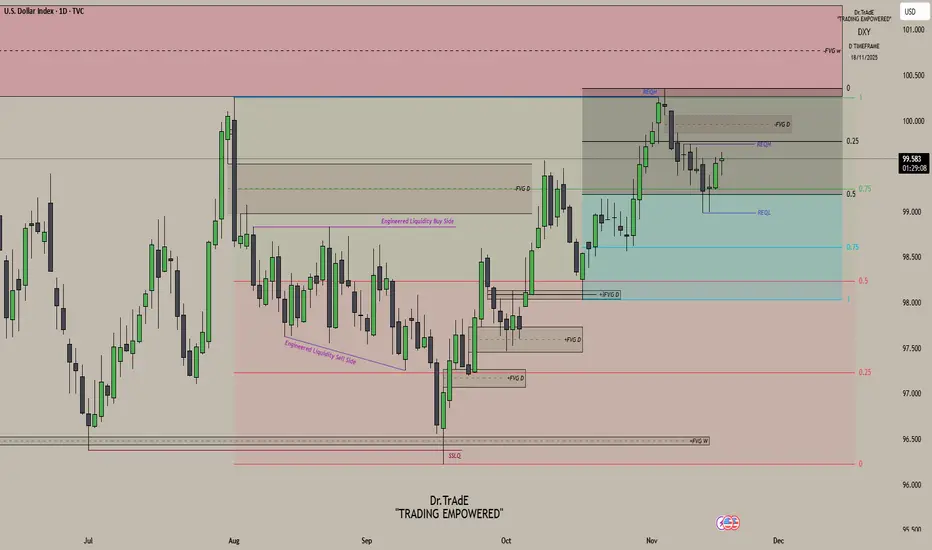
Understanding Dollar Structure and DeliveryCurrent price action is unfolding inside the Intermediate Dealing Range, defined by the November 5 high and the October 17 low. DXY is trading in the premium of its 20 day IPDA range, with equal highs sitting just under the 0.25 level as my first draw on liquidity and a Daily SIBI resting right above it. If price reacts at those equal highs, fine, that is expected. But if it keeps pressing higher, the Daily SIBI is the next draw, no question. And if price shifts with displacement from either of those levels, I am looking straight to the relative equal lows first, then 98.563 below the 0.75 level. With NFP coming up, the fundamentals can blow through structure, but if the dollar shows weakness, price is reaching into discount. That is the only direction it can go.
If you want to understand the delivery here, study this chart from August 1. Watch how price cleans up inefficiencies, hunts liquidity, and moves between premium and discount with every shift in order flow. Every displacement points to the next target. The PD arrays along the path are not decoration, they are the roadmap. I have marked the August 1 high and the September 18 low as the larger dealing range, and the November 5 high with the October 17 low as the Intermediate Dealing Range. That is the framework. That is where price is operating right now. If you want to understand the current delivery, this is the range you need to focus on.
Study the chart and you will see exactly why price moved the way it did. Yes, it is hindsight, and that is the whole point. Understanding past delivery helps you see future price action with real precision. The levels that got targeted here were not random. They were the logical draws. Learn that, and you stop guessing. The same delivery repeats again and again.
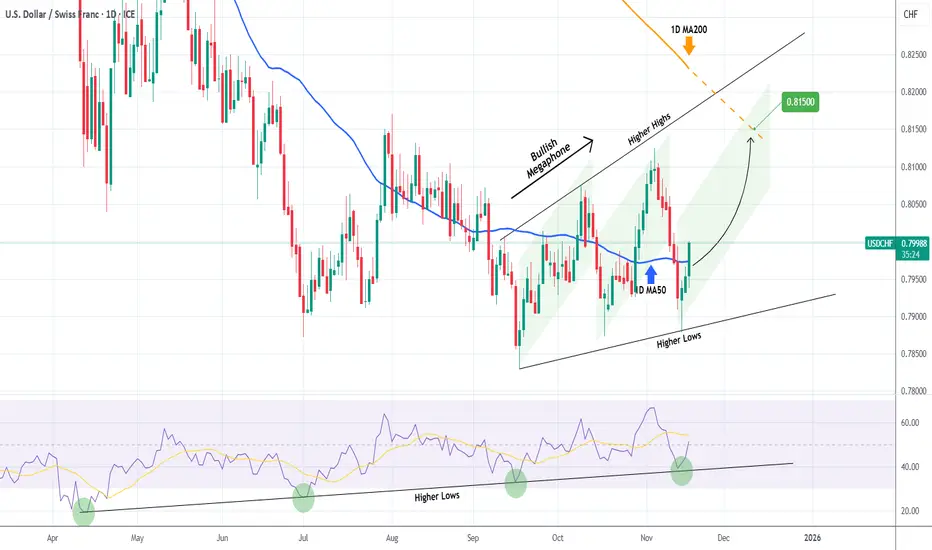
USDCHF Megaphone started its new Bullish Leg.The USDCHF pair has been trading within a 2-month Bullish Megaphone that was initiated after the huge 1D RSI Bullish Divergence of Higher Lows caused a market bottom in September and the price flipped the Lower Lows to Higher Lows and started rising.
Having broken above its 1D MA50 (blue trend-line) today, the new Bullish Leg has been confirmed and we expect it to make contact with the 1D MA200 (orange trend-line) around 0.81500.
---
** Please LIKE 👍, FOLLOW ✅, SHARE 🙌 and COMMENT ✍ if you enjoy this idea! Also share your ideas and charts in the comments section below! This is best way to keep it relevant, support us, keep the content here free and allow the idea to reach as many people as possible. **
---
💸💸💸💸💸💸
👇 👇 👇 👇 👇 👇
BTC SPX Ratio At Its LimitsAs BTC has matured, it has revealed its limits relative to SPX. Any time the price rises above 15, a correction follows.
While it has not yet cracked I find myself violating my own rules again and compelled to share this chart with you BEFORE the crack.
Markets are volatile and I am simply trying to keep people from getting hurt. Do not make the mistake of thinking BTC is a safe asset.
Bulls best to take profits.
Click boost, follow, subscribe, and let me help you navigate these crazy markets.

EURUSD Channel Down has started its new Bearish Leg.The EURUSD pair has been trading within a Channel Down since the October 01 High and price its latest Lower High last Thursday, getting rejected exactly on the 1D MA50 (red trend-line) for the first time in 1 month.
Today it broke below its 4H MA50 (blue trend-line) after 10 days and such break-outs have confirmed both previous Bearish Legs. As a result, we turn bearish again on this pair and since both previous Legs declined by at least -2.03%, we are targeting 1.14200.
As you can see, this can make a perfect technical Lower Low on the 1D MA200 (black trend-line) a major long-term market Support. Another metric to look for, is the 4H RSI, which provides a Buy Signal when it double bottoms below 30.00.
---
** Please LIKE 👍, FOLLOW ✅, SHARE 🙌 and COMMENT ✍ if you enjoy this idea! Also share your ideas and charts in the comments section below! This is best way to keep it relevant, support us, keep the content here free and allow the idea to reach as many people as possible. **
---
💸💸💸💸💸💸
👇 👇 👇 👇 👇 👇

EUR/USD - Ascending Triangle (17.11.2025)🧠 Setup Overview TICKMILL:EURUSD
EUR/USD has formed an ascending triangle, but instead of breaking upward, price failed at the horizontal resistance and slipped below the rising trendline — signaling potential bearish reversal. The pair is rejecting the 1.1650–1.1660 supply zone, and downside momentum is building as fundamentals shift in favor of USD strength.
📊 Trading Plan🔻 Bearish Scenario (Primary Bias)
Look for trendline retest rejection for confirmation
Expect continuation to the downside toward key support zones
🎯 Targets:
1st Support: 1.1581
2nd Support: 1.1561
🔰 Resistance Zone: 1.1650 – 1.1660
⚡ Fundamental Updates (Today – 17 Nov 2025)
1️⃣ Fed officials remain cautious about easing policy due to persistent inflation risks.
• This reduces the chances of a near-term rate cut → USD strengthens.
2️⃣ U.S. government bond yields rise as investors move into safer assets during stock market weakness.
• Higher yields = stronger USD → bearish pressure on EUR/USD.
These fundamentals align with the technical breakdown, supporting further downside.
#EURUSD #Forex #TechnicalAnalysis #PriceAction #AscendingTriangle #BearishSetup #USD #EUR #FundamentalAnalysis #ForexSignals #TradingView #KABHI_TA_TRADING #ChartsDontLieTradersDontQuit #FXMarket #TrendlineBreak #SupplyZone
⚠️ Disclaimer
This is not financial advice.All content is for educational purposes only. Always confirm signals and apply strict risk management before entering trades.
💬 Support My Work ❤️
If this analysis helps you —
👍 Like 💬 Comment 🔔 Follow
Your support motivates me to post more daily setups & clean chart analysis!

DXY firmed between the hawkish Fed and Waller call of cuts.
The dollar strengthened despite the contrast between the Fed’s overall hawkish tone and Waller’s support for rate cuts.
Cleveland Fed President Hammack noted that policy must remain somewhat restrictive to bring inflation back to target, while St. Louis Fed President Musalem also emphasized that any policy easing should proceed cautiously.
In contrast, Fed Governor Waller said he is not concerned about a renewed acceleration in inflation and argued that several months of labor-market softness justify additional rate cuts. He added that tariffs are unlikely to have a lasting impact on inflation and that restrictive policy is increasingly weighing on the economy, particularly on lower- and middle-income households.
DXY briefly tested the support at 99.30 before climbing above both EMAs. The converging EMAs indicate a potential shift toward a bullish trend.
If DXY closes above both EMAs, the index may advance toward 99.80.
Conversely, if DXY breaks below both EMAs and 99.30, the index could retreat toward the next support at 99.00.

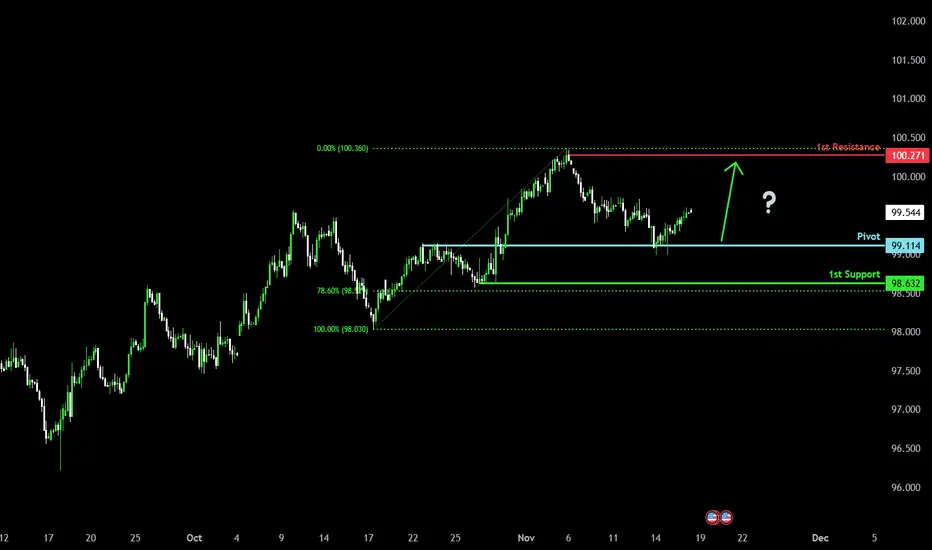
Bullish momentum to extend?US Dollar Index (DXY) has bounced off the pivot, which is a pullback support, and could potentially rise to the 1st resistance.
Pivot: 99.11
1st Support: 98.63
1st Resistance: 100.27
Disclaimer:
The opinions given above constitute general market commentary and do not constitute the opinion or advice of IC Markets or any form of personal or investment advice.
Any opinions, news, research, analyses, prices, other information, or links to third-party sites contained on this website are provided on an "as-is" basis, are intended to be informative only, and are not advice, a recommendation, research, a record of our trading prices, an offer of, or solicitation for, a transaction in any financial instrument and thus should not be treated as such. The information provided does not involve any specific investment objectives, financial situation, or needs of any specific person who may receive it. Please be aware that past performance is not a reliable indicator of future performance and/or results. Past performance or forward-looking scenarios based upon the reasonable beliefs of the third-party provider are not a guarantee of future performance. Actual results may differ materially from those anticipated in forward-looking or past performance statements. IC Markets makes no representation or warranty and assumes no liability as to the accuracy or completeness of the information provided, nor any loss arising from any investment based on a recommendation, forecast, or any information supplied by any third party.
EURUSD:LIVE TRADEHello friends
Given the good growth we had, the price is now correcting and it is expected that buyers will support the price in this area and the price will rise to the specified targets.
Don't forget risk and capital management.
*Trade safely with us*

Forex: Weekly Review The week starting Monday 10 November began with positivity. It was mooted the US government shutdown was coming to an end, combined with dovish rhetoric from Japan's government and all was well.
But by Wednesday, the shutdown ending announcement didn't bring with it an extension of the positive mood. Aside from a bit of mixed China data, there wasn't particularly any new information but the market started to re-focus on AI overvaluation concerns and hawkish repricing of the FED interest rate path.
From there it all got a bit messy, the JPY and USD didn't particularly strengthen as the S&P fell, it was left to the CHF to sweep all aside, the CHF was bouyed all week (even in times of positivity) helped by SWISS / US tariff news. The negative tone did put the skids on the mighty AUD though. I felt the AUD would really kick on once positive employment data was released, but it was a tepid end to the week for the Aussie. The GBP had another week of negative data, the recent theme of the pound weakening and then recovering continued. I suspect partly due to the UK's relatively high interest rate but also the GBP and EUR appeared to rise in tandem with the CHF as the European currencies have a habit of tracking each other.
All in all, with the S&P sitting at daily support and the VIX below 20, I'm 'hopefull' positive risk sentiment will return in the week ahead. I'm particularly interested in JPY short trades given the overall pushback against a rate hike before year end.
Of course, the return of US data will be very interesting, particularly regarding the status of the USD, hopefully we'll get some good old fashioned 'US red flag catalyst opportunities' in the weeks ahead.
On a personal note, it was a little disappointing to only place one trade, at least it hit profit. A EUR USD long during the early week positivity. At the time the AUD was the obvious long choice but I preferred the stop loss the EUR USD chart was offering.
Aside from that one trade, it was a week of ideas that didn't come to fruition. Or if they did, I wasn't at the charts at the correct time to take advantage. Unless you have the time (or desire) to be glued to the charts 24 hours a day, missed opportunities is just something you have to accept.
Let's see what the new week brings.

EUR/USD – H4 Wedge Pattern | Dollar Weakness & Fed Cut Bets🧠 Setup Overview:
EUR/USD is forming a falling wedge pattern on the H4 chart — a potential bullish reversal structure after weeks of downside pressure. The pair is testing the upper wedge trendline, suggesting a possible breakout, but confirmation is still pending. FX:EURUSD
📊 Trading Plan: ✅ Bullish Scenario:
🟢Watch for a confirmed breakout above the wedge and cloud resistance zone.
🟢If confirmed, expect a move toward 1.1730 (1st Resistance) and 1.1800 (2nd Resistance).
⚙️ Technical Levels:
🟢 1st Resistance: 1.1732
🟢 2nd Resistance: 1.1804
🔴 Support Zone: 1.1500 – 1.1470
🧩 Fundamental Updates (Today – 9 Nov 2025):
1️⃣ U.S. Treasury yields slipped slightly as surveys showed weaker consumer confidence, softening the dollar’s tone.
2️⃣ Fed rate cut expectations increased — markets now price a 66% chance of a 25 bps cut in December, according to CME FedWatch.
3️⃣ Government funding worries: renewed concerns over a potential U.S. government shutdown weighed on sentiment and limited USD demand.
🔴These factors combined create short-term bearish pressure on USD, which may fuel a EUR/USD rebound if momentum sustains above the wedge.🔴
#EURUSD #Forex #PriceAction #TechnicalAnalysis #ChartPattern #FallingWedge
#FundamentalAnalysis #FedWatch #USD #EUR #ForexSignals #KABHI_TA_TRADING #ChartsDontLieTradersDontQuit #SwingTrading #ForexEducation #FXMarket #TradingView
⚠️ Disclaimer:
This post is for educational purposes only — not financial advice. Always perform your own analysis and manage risk carefully before entering trades.
💬 Support My Work ❤️
If you like this analysis — drop a LIKE 👍, leave a COMMENT 💭, and FOLLOW 🔔 to stay updated with more Forex setups, price action insights, and live market fundamentals!

USD/CAD - Fundamental Drives (13.11.2025)🧠 Setup Overview OANDA:USDCAD
USD/CAD continues to face strong rejection from the resistance zone, with price failing multiple times to break above the 1.4020–1.4045 supply area.
The market structure remains bearish as the pair forms lower highs and struggles to sustain upside momentum.
With fundamentals also favoring CAD strength, the downside scenario remains more probable.
📊 Trading Plan🔻 Sell Bias
Look for bearish confirmation near or below the resistance zone
Continuation to the downside expected toward key support levels
🎯 Targets:
1st Support: 1.3969
2nd Support: 1.3950
🔰 Resistance Zone: 1.4020 – 1.4045
⚡ Fundamental Updates (Today – 13 Nov 2025)
1️⃣ Bank of Canada (BoC) signaled no further interest rate cuts, which strengthened the CAD.
• A stable or moderately hawkish BoC typically supports CAD appreciation.
2️⃣ US Treasury yields continue to fall as markets increase bets on the Federal Reserve easing policy in the coming months.
• Lower yields = weaker USD, helping push USD/CAD lower.
📌 High Impact Event Today:
USD - CPI (Inflation Rate) → A softer CPI reading could accelerate USD weakness.
#USDCAD #Forex #TechnicalAnalysis #PriceAction #ResistanceZone #FXMarket #FundamentalAnalysis #ChartPatterns #KABHI_TA_TRADING #ChartsDontLieTradersDontQuit #USD #CAD #TradingView #ForexSignals #BearishSetup #IntradayTrading
⚠️ Disclaimer
This analysis is for education only. It is not financial advice.
Always apply proper risk management and trade based on your own confirmation.
💬 Support My Work ❤️
If this analysis helps you —👉 LIKE 👍 👉 COMMENT 💬 👉 FOLLOW 🔔
Your support motivates more daily chart breakdowns and setups!

Bullish bounce off?US Dollar Index (DXY) is reacting off the pivot and could bounce to the 1st resistance.
Pivot: 99.08
1st Support: 98.08
1st Resistance: 99.80
Disclaimer:
The opinions given above constitute general market commentary and do not constitute the opinion or advice of IC Markets or any form of personal or investment advice.
Any opinions, news, research, analyses, prices, other information, or links to third-party sites contained on this website are provided on an "as-is" basis, are intended to be informative only, and are not advice, a recommendation, research, a record of our trading prices, an offer of, or solicitation for, a transaction in any financial instrument and thus should not be treated as such. The information provided does not involve any specific investment objectives, financial situation, or needs of any specific person who may receive it. Please be aware that past performance is not a reliable indicator of future performance and/or results. Past performance or forward-looking scenarios based upon the reasonable beliefs of the third-party provider are not a guarantee of future performance. Actual results may differ materially from those anticipated in forward-looking or past performance statements. IC Markets makes no representation or warranty and assumes no liability as to the accuracy or completeness of the information provided, nor any loss arising from any investment based on a recommendation, forecast, or any information supplied by any third party.

GBP/USD – Head & Shoulders Pattern (13.11.2025)🧠 Setup Overview FX:GBPUSD
GBP/USD is forming a Head & Shoulders pattern on the 1H chart — a classical bullish reversal structure after a prolonged downtrend.
Price is currently holding above the right-shoulder support zone, showing early signs of accumulation. A breakout above the neckline would confirm bullish momentum toward the next resistance targets.
📊 Trading Plan✅ Bullish Scenario
If confirmed → Expect bullish continuation toward:
🟢 1st Resistance: 1.3287
🟢 2nd Resistance: 1.3360
⚡ Fundamental Updates
1️⃣ U.S. Treasury yields eased slightly as consumer confidence declined.
2️⃣ Markets now price a 66% chance of a rate cut in December, according to CME’s FedWatch Tool.
3️⃣ U.S. government shutdown concerns keep the dollar under mild pressure as investors watch debt issuance risk.
💬 Summary
A clear trendline rejection combined with fundamental USD weakness supports a short bias.
Wait for confirmation before entering — patience protects capital.
#GBP/USD #ForexAnalysis #TradingView #PriceAction #Trendline #Ichimoku #TechnicalAnalysis #ForexTrader #Fundamentals #SwingTrading #KABHI_TA_TRADING
⚠️ Disclaimer
This analysis is for educational purposes only and not financial advice.
Always do your own research and manage risk wisely.
📢 Support My Work
💚 Like, Comment & Share this idea to motivate more chart updates!
🧠 “Charts Don’t Lie, Traders Don’t Quit.”
