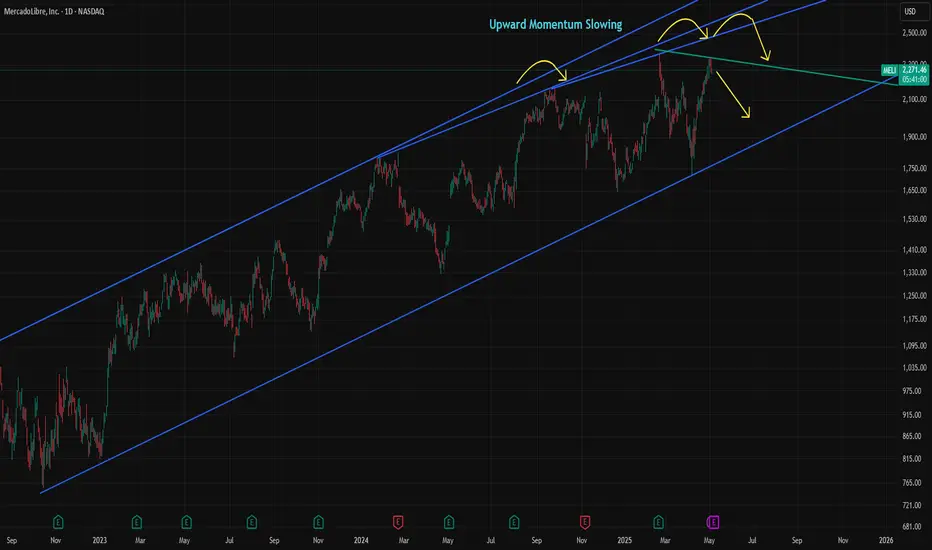
MELI at Risk from Momentum Shift and High ValuationMELI has gained over 35% since the April dip, but momentum has been fading since September. The slowdown has become increasingly visible, and last week's high may remain the top for some time unless Wednesday’s earnings report surprises the market on the upside.
The consensus estimate for MELI’s revenue is $5,497.05 million, representing a 26.86% year-over-year increase but a 9.27% decline quarter-over-quarter. MELI is currently trading at a forward P/E of 41.9x, which is significantly higher than the 19.8x average of comparable companies. Its geographic advantage over U.S.-based peers gave MELI an edge in April, but without strong earnings to support the high valuation, the stock could become vulnerable.
Over the past five years, MELI averaged 56.2% annual sales growth. That figure is expected to fall to an average of 22.1% over the next three years, which remains solid but signals a clear deceleration.
MELI could move more than 7% on earnings day, depending on the report. If the stock falls below 2,000, it may present a buying opportunity. However, the loss of momentum is usually a negative signal for sustaining trends, so the risk of buying the dip is higher than before.
Value
Week ahead analysis May 4th to 11th**Week Ahead Analysis (May 5 – May 11, 2025)**
### **Baseline: Market Expectations**
- **Tariffs & Fed Policy:** Trump's tariff announcement has heightened concerns about economic slowing, prompting bond markets to price in up to four Federal Reserve rate cuts this year.
- **Trade Talks & Sentiment Shift:** Reports suggest China may restart trade negotiations, boosting risk sentiment. However, China insists the U.S. must first remove all unilateral tariffs, adding uncertainty to the discussions.
- **Market Reaction:** Risk assets—equities and high-beta currencies like AUD, NZD, and CAD—are climbing as volatility cools. Meanwhile, safe havens such as JPY, CHF, and gold are facing selling pressure, though overall risk sentiment remains cautious.
### **Potential Surprise Scenarios**
- **Trade Deal Secured:** A deal would likely send equities higher, strengthen risk-sensitive currencies, and drive safe havens lower.
- **No Deal Reached:** In contrast, safe havens could gain while risk assets retreat.
### **Big Picture Outlook**
Regardless of the immediate outcome, the market's medium-term trajectory hinges on the broader effects of trade policy. If tariffs persist, economic uncertainty may sustain the Fed’s dovish stance. A successful trade deal, however, could restore confidence, shifting expectations back toward growth stabili

Trend Reversal With Low Demand Natural Gas Outlook: Bearish signals dominate NATGAS with a Head & Shoulders pattern, Shooting Star, and Bearish Engulfing on the chart.
Technical Indicators: RSI is declining, and MACD shows bearish momentum, supporting further downside.
Weather Impact: The UK forecast for the next two weeks shows mixed conditions—initial sunshine but turning unsettled with rain and wind.
Heating Demand: Temperatures will range between 2°C and 13°C, potentially affecting natural gas consumption.
March 28-31: Breezy conditions with low clouds and occasional showers, possibly moderating demand.
Market Reaction: UK NATGAS price projections show stability around 58.2 on March 28 and 57.7 on March 31.
Key Resistance & Support: Watch $4.00 resistance and $3.60 support for potential breakouts.
Bearish Confirmation: If price closes below $3.80, further downside towards $3.50 could be expected.
Fundamental Factors: Geopolitics and supply dynamics still play a major role in volatility.
Risk Management: Monitor weather updates and gas storage reports for potential reversals.
Short-Term Traders: Bearish entries could target $3.60 with tight stop losses above $4.00.
Long-Term Investors: May look for buying opportunities near strong support zones.
Caution: Unexpected cold snaps or supply disruptions could invalidate bearish scenarios.
Stay Updated: Keep track of weather forecasts and fundamental changes impacting demand/supply.
Not Financial Advice: Do your own research before trading.

ORAS Stock Fundamental AnalysisORAS trend was neutral between the support line 266.851 and the resistance line 291.935, the trend was down by 0.14%. The stock rose, and broke the first support line to reach the second support line 267.905, then the third support line 268.432. It's expected to keep rising till reaching the resistance line 290.144, then 290.671, because of the CBE's decision about cutting the interest rate by 2.25% which will have a positive impact on corporates because according to the current reasons behind the economic activity decreasing interest rate will lead to decreasing the cost of borrowing which will decrease the cost of production and will increase the corporates' profit and their monetary value. On the other side, this will decrease the products' price and individuals will have a higher will to diversify their investment beside increasing their purchasing power as well.

Could the gap remain unfilled?If BTC doesn't fill the CME gap at around 92K, it will be the first unfilled CME gap since October 2020.

This stock has strong pumpomentalsJust bought couple shares of $DJT. Think its gonna moon, because a lot of traders do love President Trump. They said description is too short, but idk how come its short if I going to Long this stock. I think those who short sell NASDAQ:DJT will regret eventually. Cuz it's definitely gonna moon and rip all short sellers apart

SHORT AGAIN 100 95run it back they still dont make enough money for this valuation risky short yet again. grabbed may 23 100 90P

OVERSOLD NKELooking for the closest gap fill and to retest the down slopping trend line. China or Vietnam tariff deal like most stocks this would easily move +10% instantly, current valuation is like buying in 1997! down 70% from the highs fair value $112.

Under 400$ is a steal Strong move off 150 support. They had a 180 sell downgrade announced from some clowns today they'll be revising there targets shortly. COIN will be used be everyone and there grandma soon enough. Consumer/government dollars pouring in is insane this company is not going anywhere they also just realsed plans for BTC Yield Fund, offering 4-8% APY to non-US institutional investors through a limited leverage cash-and-carry trade strategy.
I don't think we'll be falling below 178 would be a great entry if your lucky enough.

If the price enter these red-marked zones!Gold Market Analysis (Engulfing & Zone-Based Strategy)
This analysis is based on a straightforward zone-trading method using engulfing patterns and filtered key levels. The marked zones on the chart highlight high-probability trading areas.
Red Zones (Sell Areas):
If the price enters these red-marked zones, we look for bearish confirmation to enter sell trades.
These zones are derived from the 4H timeframe, making them more reliable. If the market reacts from here, you can target around 60–80 pips in profit.
A second sell zone offers potential for a larger move—up to 150+ pips—if the price respects it.
Green Zones (Buy Areas):
If the price drops and enters the green-marked zone, it’s a signal to look for buy setups.
This area may deliver a strong bounce, potentially yielding 100+ pips.
There’s no need for complicated patterns or indicators—just follow the zones. If the price hits a zone and shows confirmation, you trade it.
Trade at your own risk DYOR!!

Solana | BULLISH ON SOL | SOL Dominates Blockchain RevenueEven with a dip in activity particularly around memecoins, Solana has managed to hold its ground impressively when it comes to generating revenue.
While you might think fewer transactions would automatically mean less money coming in, Solana's performance shows otherwise. This ability points to the solid value being created by the different applications and uses on the network right now.
A big reason for this financial resilience is the continued strength of dApps on Solana. These apps have been really effective at bringing in fees and adding value to the network. It seems that while the hype around certain speculative tokens has died down significantly, the core utility and economic activity within Solana's dApps are still going strong. This shift towards more fundamental uses for generating revenue is a really positive sign for how the network can keep growing in the long run.
Looking ahead the future for SOL is bright imo as more projects are linking Artificial Intelligence with Solana, taking advantage of its speed and low costs to build new things. Plus, the introduction of Solana ETFs in Canada is a big step.
Other Solana-based alts including Official Trump (TRUMP), Jupiter (JUP), Raydium (RAY), and Bonk (BONK), have followed SOL with good price increases.
It seems like the focus is shifting towards building more lasting and useful applications. With ongoing support for developers and increasing interest from the traditional financial world, Solana seems well-positioned to handle market ups and downs and keep finding new ways to create value in the future. I'll definitely be watching to accumulate for the long-term.
______________________________
BINANCE:SOLUSDT

ETH Bottomed last week!This chart illustrates the ratio of the market capitalization of the top three stablecoins and that of Ethereum (ETH).
The correlation is quite evident, as anticipated.
We are likely approaching a phase where these stablecoins will be deployed, with Ethereum being a key beneficiary, signalling that we are entering a period of increased risk appetite and overall market buoyancy.
#ALTS
#USDT
#USDC
#DAI
#ETH

GE Healthcare Technology | GEHC | Long at $62.25GE Healthcare Technology $NASDAQ:GEHC. An aging and unhealthy population will only create an increased need for healthcare imaging services. Add AI to the diagnostic mix, and imaging will be imperative for routine health maintenance and screening. With a P/E of 15x, debt-to equity of 1x, earnings forecast growth of 8.36% per year, and bullish analyst ratings, this could be a good value play for the patient.
Thus, at $62.25, NASDAQ:GEHC is in a personal buy zone. Further drops are possible if trade wars make imaging materials/technology difficult to obtain, but that general statement applies to the whole market at this time...
Targets:
$70.00
$78.00

4/24 Gold Trading StrategyYesterday's intraday recommendation to buy near 3260 has paid off, with gold trending upward after the market opened today and generating solid profits.
The current pullback appears to be a healthy support retest. However, caution is needed—if the price breaks below 3306, momentum could drag it under 3300 again.
Should that happen, a renewed long position at lower levels is still worth considering. The rebound so far lacks both strength and duration, suggesting a potential shakeout. While it could also be a bull trap, entering at lower levels limits downside risk—with the worst case being reduced profits, not significant losses.
Today's Trading Strategy:
Sell Zone: 3410–3440
Buy Zone: 3267–3230
Flexible Trading Zones: 3383–3340 / 3288–3336

Acadia Healthcare Company | ACHC | Long at $21.98Acadia Healthcare's NASDAQ:ACHC stock has fallen nearly -76% in a year, primarily due to weak 2024 results, missed revenue and EPS expectations, and a soft 2025 revenue guidance. Ongoing federal investigations into billing practices and lawsuits have further eroded investor confidence. However, it is currently trading at a price-to-earnings ratio of 7.42x and earnings are forecast to grow 7.07% per year. The profitable company is trading at a good value compared to other healthcare companies. Debt-to-equity is relatively low (0.64x), but legal risks (DOJ probe, lawsuits) strain margins.
The stock has entered my "major crash" simple moving average territory and there is a lot of downward / selling pressure. But, more often than not, this area (which... I caution... still extends down near $16) can often signal a temporary or longer-term bottom. Personally, this is a buy area ($16-$21) even if it turns into a short-term bounce in 2025. But I believe the overall market moves in the S&P 500, etc. will guide this stock more than anything at this point (unless more bad news about the company emerges).
One thing to note is that there are open price gaps on the daily chart near $17, $10, and $8. These gaps, which often (but not always) get closed in the lifetime of a stock, are a potential signal for further declines - at least at some point. There could be a drop near $16, then a $10-$20 bullish price increase after that, followed by more declines (trapping investors). Time will tell, but NASDAQ:ACHC is currently attractively valued. From a technical analysis standpoint, it is in a personal "buy zone", even if purely for a swing trade.
Targets:
$27.00
$33.00
$39.00

AT&T I Tipping Point : Short Opportunity with Head & ShouldersHey traders after a previous trade trade on the hood hitting targets of 16.4%. Today I bring you NYSE:T
Technical + Fundamental View
Pro Tip
- Breakdown below the Entry Line will be considered at Trade Initiation. (Risky Traders)
R:R= 5.4
- Rest can follow entry at day close post breakdown SL above Entry Candle.
- The Breakdown Below the Entry Line will confirm the head and shoulder pattern
Entry Line - 26.93
Stoploss - 27.53
Target 1 - 25.59 (Neckline of head and shoulder)
Target 2 - 24.74
Target 3 - 23.68
Technical View
- Head And Shoulder on Daily Time frame
- On the hourly timeframe, the chart looks weak, showing a potential double top pattern where the second peak is lower than the first, indicating growing investor fear.
Fundamental View
- High Debt: Over $140 billion in debt limits investment capacity and consumes significant cash flow.
- Network Issues: Poor service quality and outages risk losing customers to competitors.
- Strong Competition : T-Mobile and Verizon offer better plans, making customer retention harder.
- Market Saturation: The U.S. wireless market is nearly saturated, limiting new customer growth.
- Execution Risks: Growth and debt reduction depend on flawless asset sales and network upgrades; delays could harm finances and stock performance.
Additional Considerations
- AT&T’s valuation is higher than some peers, potentially capping upside.
- Telecom market competitiveness means growth hinges on successful 5G and fiber rollouts.
- Dividend yield (~3.9%) is attractive but lower than some rivals, which may impact income investors.

Google - Last earnings call before tariffs affect revenue?Hi guys please find below the analysis we did for Google (ALPHABET)
Alphabet Inc. (NASDAQ: GOOG) is poised to deliver a robust Q1 2025 earnings report, with analysts projecting revenue of $89.22 billion—an 11% year-over-year increase—and net income of $24.71 billion ($2.01 per share), up from $23.66 billion ($1.89 per share) a year ago . This anticipated growth is largely driven by Alphabet's strategic investments in artificial intelligence (AI) and cloud computing, which have bolstered its core businesses, including Google Search and YouTube .
Resilience Amid Tariff Concerns
While recent U.S. tariffs have disrupted global supply chains, particularly affecting hardware-dependent sectors, Alphabet's business model is predominantly digital and service-oriented. Its primary revenue streams—digital advertising, cloud services, and AI-driven platforms—are less susceptible to such trade tensions. Analysts from Citi and Morgan Stanley have expressed confidence in Alphabet's ability to navigate macroeconomic challenges, citing the company's AI-driven innovations as key growth drivers.
General analyst Confidence and Stock Performance
Despite a 20% decline in Alphabet's stock value earlier in 2025, the company's strong fundamentals have led to bullish sentiments among analysts. Price targets have been set as high as $195, suggesting a potential upside of up to 29% from recent levels . The company's continued focus on AI and cloud services positions it well for sustained growth, even amidst global economic uncertainties. In summary, Alphabet's upcoming earnings call is expected to highlight the company's robust performance and resilience, underscoring its ability to thrive despite external economic pressures.
📌 Trade Plan
📈 Entry: 155.41
✅ Target: 181.30
❌ SL: 121
We are looking for +-20% increase in the upcoming days/weeks!

GREAT TIME TO BUY DJTWent long when it was down 3% yesterday calls up 40%, massive crytpo.com news dropped today like every time before djt hit the lows, it's about to run massively. I'm not betting against trump.
Any pullback towards 20 would be great for entry.

Gold at the $3394-3392 level citing the presence of an engulfingGold Buying Opportunity Analysis
Considering buying gold at the $3394-3392 level, citing the presence of an engulfing buy filter zone that indicates pending buying orders. This technical setup suggests potential support at this level, which could lead to a price bounce.
Potential Upside:
- Conservative estimate: 40-70 pips
- Optimistic scenario: up to 100 pips or more, depending on market conditions and momentum
Key Factors to Consider:
1. Engulfing buy filter zone: This technical indicator suggests buying interest at this level.
2. Pending buying orders: These orders could contribute to a price increase if executed.
3. Market sentiment: Overall market conditions, news, and trends will influence gold's price movement.
Important Reminder:
This analysis is for informational purposes only and should not be considered financial advice. It's essential to conduct your own research (DYOR) and consult with a financial advisor if needed. Trading carries risks, and it's crucial to manage your positions responsibly.
Next Steps:
You'll be waiting for the market to reach the specified level. If it does, carefully evaluate the market conditions and make an informed decision based on your trading strategy and risk tolerance.
How do you plan to manage your trade, and what are your risk management strategies?

4/21 Gold Trading StrategyGood morning, everyone! A brand new week begins—wishing us smooth trades and great success ahead.
Looking back to last Thursday, our gold short strategy hit the mark perfectly. Prices dropped nearly $60 as expected, and we captured around $45 in profit from that move. Overall, we secured over $200 in profit space last week—an excellent performance.
Today, gold opened higher and continues to climb. Technically, bulls still have room to push higher, with 3360 as a key resistance level. However, judging by the current momentum, we may even see a test of 3400. That said, trading is about precision, not perfection. If prices approach 3380 and the upward momentum stalls, it may be time to watch for a pullback. On the other hand, if strength continues, holding some light long positions remains a relatively low-risk strategy.
Trading Strategy for Today:
📉 Sell in the 3380–3410 range
📈 Buy in the 3307–3280 range
🔁 Flexible trades between 3360–3330 / 3272–3315

Jesus Coin (JESUS) Price Jumps Over 50% in a Week Jesus Coin (JESUS) has experienced notable price action this week, rising by 52.90% in the past seven days. At the time of writing, the token trades at $0.00000006999. Despite a -7.61% drop in the past 24 hours, the coin maintains momentum, supported by increased attention within its community.
The project holds a market capitalization of approximately $7.19 million, positioning it at rank #1101 in the crypto market. Daily trading volume has declined to $110.11K, showing a 61.50% drop, signaling reduced short-term interest despite recent price movements.
Jesus Coin was created as a decentralized, community-led initiative aimed at promoting generosity and faith-based values in crypto. It brands itself as an “anti-meme coin,” built to counter dishonest projects and scams that have plagued the space.
Unlike typical crypto ventures, Jesus Coin launched without a team allocation and functions entirely through community efforts. Its mission focuses on inspiring generosity and cultural transformation through blockchain.
From a technical perspective, Jesus Coin shows signs of renewed bullish activity after a prolonged consolidation phase. The 3-day candlestick chart highlights a recent push attempt. JESUS has also moved above the 50-day moving average (0.00000006201), suggesting short-term bullish momentum. However, it remains below the 200-day moving average, indicating that long-term sentiment has not yet flipped.
The token’s trading range remains tight, with historical support near 0.0000000513 and recent highs around 0.000000071. Trading volume remains modest, implying cautious interest from market participants.
With strong community involvement and recent technical signals, Jesus Coin may continue to draw attention. Watch for sustained volume and price movement above resistance for further confirmation of trend direction.

Altseason and a Weak Dollar — Will History Repeat in 2025?The altseason of 2017 started at the same time as the U.S. dollar index (DXY) began to fall. This likely helped bring more money into the crypto market. In 2020–2021, a similar thing happened: the falling dollar was followed by a strong rise in altcoins. But that time, altseason started closer to the end of the dollar’s decline.
A weaker dollar makes risky assets like crypto more attractive. In April 2020, the total crypto market cap was around $218 billion. Today, it’s about $2.63 trillion — around 12 times bigger.
However, to start a new altseason now, the market may need a lot more cheap money than in 2020. I’m not sure if the 2025 altseason can be as strong as in the past.
Now it seems that the only way to repeat that success is if a big part of the capital moves from Bitcoin into altcoins. This would need a sharp drop in Bitcoin dominance. But this brings new questions. After the launch of Bitcoin ETFs, the ownership structure has changed. Many people now own Bitcoin through investment funds, not directly. These funds may not be very excited to invest in altcoins.
What do you think about it? Share your opinion in the comments.

DXYBased on 6 consecutive bearish Commitment of Traders (COT) the US Dollar Index (DXY) is exhibiting a sustained bearish momentum, potentially indicating a decline in the US dollar's value relative to other major currencies.
