VRA - MAAN its triangle with A@EHuuuge accumulation
High volume in this area, weekly macd almost crossing.
Verasity

🆓Verasity (VRA) Apr-07 #VRA $VRA
VRA is having 2 strong support zones of this uptrend at $0.024 and $0.022, the current selling force is still not a concern with the real uptrend of VRA. Therefore, VRA can still continue its uptrend to the $0.036 and $0.044 zones this April.
📈RED PLAN
♻️Condition : If 1-Day closes ABOVE 0.022$ zone
🔴Buy : 0.024 - 0.022
🔴Sell : 0.03 - 0.036 - 0.044
📉BLUE PLAN
♻️Condition : If 1-Day closes BELOW 0.022$ zone
🔵Sell : 0.022
🔵Buy : 0.019 - 0.016
❓Details
📈Red Arrow : Main Direction as RED PLAN
📉Blue Arrow : Back-Up Direction as BLUE PLAN
🟩Green zone : Support zone as BUY section
🟥Red zone : Resistance zone as SELL section

$VRA Swing Long Set Up Cup & Handle$VRA is currently making a cup and handle formation which is usually a bullish indication of price movement to the upward side. It has bounced from the 0.618 fib level as most charts do before they bullish momentum to the upward side.
Targets for this long setup are the green fib levels.

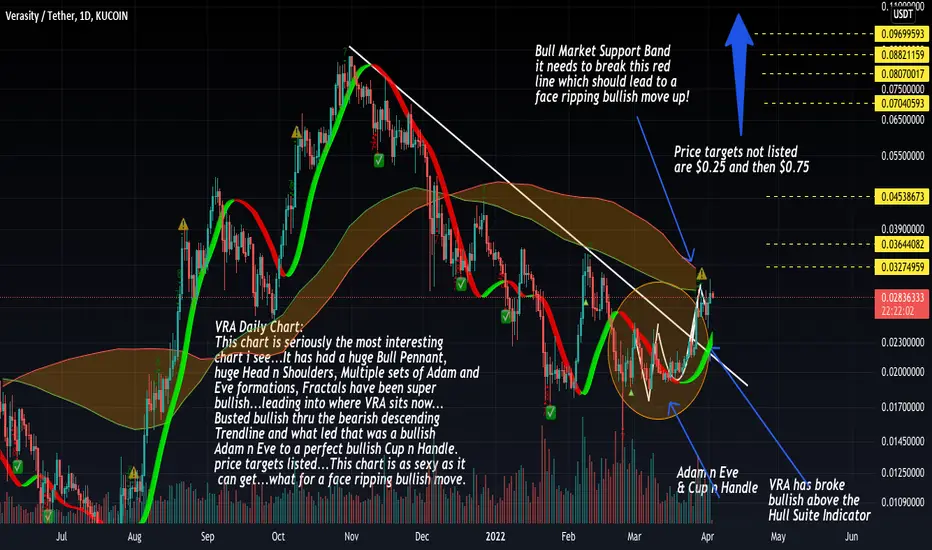
VRA daily chart is going to RIP your face offVRA Daily Chart:
This chart is seriously the most interesting
chart i see...It has had a huge Bull Pennant,
huge Head n Shoulders, Multiple sets of Adam and
Eve formations, Fractals have been super
bullish...leading into where VRA sits now...
Busted bullish thru the bearish descending
Trendline and what led that was a bullish
Adam n Eve to a perfect bullish Cup n Handle.
price targets listed...This chart is as sexy as it
can get...what for a face ripping bullish move.
Fantastic entry point for Verasity. 300% to ATH 🐱🏍Verasity (VRA) is a protocol and product layer platform for esports and video entertainment.
Total market cap is around 100 million.
The 3day chart shows a strong sign of recovery and can be taken as a future outlook of the weekly.
Bullish stuff:
We did find a strong support around 0.02$.
Currently it looks like we get a W shaped recovery which is one of the more reliable patterns.
The RSI shows a strong healthy rise.
Trading volume is increasing even during the price drop. This is a good sign for an upcoming recovery.
Bearish stuff:
We did not create higher highs yet and are in a consolidation phase during a down trend.
Technically we are still not above the bull market support band consisting of the 20 week SMA and 21 week EMA .
As a middle cap altcoin VRA heavily depends on the health of Bitcoin and Bitcoin did not break the bull market support band yet.
VRA keeps integrating and developing.
Check their Roadmap for 2022 on their official website.
A 1 billion market cap seems not out of the cards which is a 10x from here.
It could take some weeks but we believe that VRA will rise again.
Feel free to comment or ask anything you like.
Always do your own research and keep in mind that my charts and comments cannot be considered financial advice.
Cheers
Ctumblery

VRA Veracity can break the triangle an reach $0.08 or $0.1There are a bigger triangle breaking, but everything is up to the line of support of the smaller one. If the $0.02 support tail we are seeing a re-test of $0.018 area before breaking up.
If it breaks right now we can see VRA be directed to ATH, possibly by June, with a price around $0.08 or even $0.1 with a max given by the corridor of $0.120.


VRA price prediction on 4hrs chart - Kucoin1)Fib retracement (.5 and .68) from ATH to LL
2)Fib retracement (.5 and .68) from Feb HL to LL
VRA price prediction on 4hrs chart - Kucoin

VRA updateNothings changed here, still waiting for $VRA to reclaim the bottom of the channel 0.025.
Overall lacking relative strength compared to a lot of other Alts and BTC.

VRA - TO FALL TO $0.0185 & RISE TO $0.023Please support this idea with a LIKE👍 if you find it useful🥳
Not a financial advice🙅🏼♂️
This is a descending triangle pattern. We have price approaching the lower trendline at $0.018 - $0.019 region.
A bounce back from this region will take price to the upper trendline around $0.023.
What do you think?
Share your opinion in the comment section✍️
You can also demand for analysis of your preferred coin
Follow me stay updated about this coin and more helpful projects like this🎁
Happy Trading💰🥳🤗

VRA - at least scenarioVerasity is set for falling wedge breakout. Abnormal rising volume and bullish divergence.

VRA update$VRA levels of interest.
Bit of ground to make up, first step is a reclaim of the bottom of the channel and then to flip the 0.382 into support.
Any signs of weakness along the way I will go short as we're still in a downtrend until we can put in a higher low/higher high...

vra is ready for some uptrend momentum$vra will moon, if $btc bounces some
1- fluctuating around 4-hour volume profile that acts as a good support
2- great meme support that bounced from many times before
3- significant trading volume on Kucoin
4- oversold RSI situation
5- great fundamental

VRA daily Head & Shoulders and Adam and Eve remains bullishVRA is showing that all indicators
are bullish...We can not control
black swan events, but even
then, its staying in a bullish
scenario.
CHART AND RSI IS CHARTING
HIDDEN BULLISH DIVERGENCE
Meaning, The price has a higher low
and the RSI has a lower low. which
is very bullish. Zoom in to the chart
for all the details concerning
each indicator i can see.

Verasity (VRA) is Breaking The ChannelVerasity (VRA) is trying to hold on to 50 SMA on this 8 H chart and if Bitcoin cooperates, it might break higher; if not, more downside could be possible. 50 SMA is a very strong indicator which is very hard to break on downside movements but it is a strong support on most bullish movements. Lets see...

Verasity VRA looking like it's bull flag has held! Verasity, do some research, Huge potentialnin the Crypto Gaming Arena, the Twitch of crypto gaming

VERASITY LONG ZONESPress the Follow Button to see more of my Daily Detailed Analysis across all assets. Also, if you have any questions please do ask them in the comments Section.
For those VERASITY HOLDERS.. These are TECH points for long/shorts. All markets operate the same way technically and rely on the same rules, only the potential volatility and larger swings in price deviate. This is why you must trade such assets SMALL repeatedly or you will be WIPED OUT...
If you are looking to RE long then you will need a dip in price back towards some early support and Lower MA's. These areas form a strong bias to the NORTH side.
Eclipse symbol(s) Denote Exit(s).

VRA updateHey all, been a while since I updated, just been riding it up since the bottom, still long and haven't taken any profit yet.
I'm cautiously optimistic the bottom is in but keeping a close eye on price action in case this does correct, if it does I will be looking for a higher low rather than a move back to the lows.
BTC looks like it wants to go higher to me, if it does VRA should push to the top of the channel 0.048 to 0.05.
We've reclaimed the centre and retested, usually this suggests a move to the top of the channel.
The Daily OB at 0.043 could be a reversal area so be weary of that if we SFP price action to the left.
Still the chance that we pull back here i'll post a new chart if that happens.
Have a good day.

VRA #VRA To The Moon✔🐱🏍Verasity breaks a downward channel and is ready to move upwards. The resistances and goals in front of it are plotted on the chart.In addition to the break of the downtrend, a positive divergence is observed in the indicator, which can confirm the beginning of an uptrend.
I hope you find this analysis useful🌹
Follow for more...
#DYOR

💥VERASITY IS RETRACINGPlease support this idea with a LIKE👍 if you find it useful🥳
Not a financial advice🙅🏼♂️
We all know that after an impulsive move, there will always be a retracement or a a correction.
Vra broke out consolidation and rose by 50% from $0.2 to $0.3.
It’s currently resting for another leg up.
If you are late to the vra setup and still want to bag the vra token, buy within $0.23 and $0.27
What do you think?
Share your opinion in the comment section✍️
Follow me to receive more updates on VERASITY(VRAUSDT ) 🤗
Happy Trading💰🥳🤗

$VRA - 475% to 780% Bullish RallyOn Logarithmic scale, we can see on the daily that VRA has touched and pivoted off a MAJOR trendline with alternated support in play. Using a linear scale fib extension, I've marked targets at the 1.618 and 2.618 levels.

💥VRA - READY FOR NEW NEW ATH BY 500% TO $0.10Please support this idea with a LIKE👍 if you find it useful🥳
Not a financial advice🙅🏼♂️
With Bitcoin indicating a start of bull season, we have more than one factor confirming the continuity of the veracity trend.
First, we have there major areas on the trendline serving as support which reversed price to the upside.
Second, price break out of the consolidation.
And lastly, it broke out of the trendline too.
These three factors are major confirmations to long verasity to a new ATH.
What do you think?
Share your opinion in the comment section✍️
Follow me to receive more updates on VERASITY (VRAUSDT) 🤗
Happy Trading💰🥳🤗

$VRA exactly 6 months ago THIS HAPPENEDYesterday VRA closing buying volume was the highest since the 8th of December.
Have a look at the volume after the 8th very low volume until yesterday 26th Jan 2022.
It was exactly 6 months ago where the same structure occured, where the Volume was very low and on the 26th of July a spike of Buying volume came in, just like yesterday.
VRA has a move upward in 2- 5 days.
Thanks
These charts are based on my opinion of how I read the data put to me.
