US 100 Index - Is 17404/749 Support Important?As European traders return from their extended Easter break they turn on their screens to find US assets back under pressure. The US 100 index dropped 2.2% yesterday to close at 17779, which included a late rally from a mid session low at 17570.
These moves are potentially reflecting a growing unease around numerous important issues, including, a lack of progress in trade talks with US allies, US economic growth concerns and President Trump's on-going challenge to Federal Reserve independence.
Looking forward, US 100 traders have a lot to focus on this week, Tesla reports its earnings after the close tonight, against a backdrop of weekend news reports which suggested it may be about to delay production of cheaper EVs. That aside, investors may also be focused on sales projections for 2025, autonomous driving plans and the impact of tariffs on the company's profitability.
It may well be a similar story when Alphabet reports its earnings after the close on Thursday.
Throw in the latest April Preliminary PMI Survey releases on Wednesday from the developed economies, which could well start to show the impact of tariffs on growth, business sentiment and inflation, and it is possible that the recent US 100 index volatility could continue across the week.
Technical Update: Could Potential Support at 17404/17749 Be Important?
As impressive as the 18% recovery in the US 100 index from the April 7th 2025 low to the April 10th 2025 high (16290 up to 19222) appeared, after the latest price weakness, this upside may prove to be a limited reactive move, although further confirmation may still be required.
As the chart above shows, the latest upside strength saw the index back to what some traders may have viewed as an important resistance, marked by a combination of the declining Bollinger mid-average (18992 at the time) and the 50% Fibonacci retracement of the February 18th 2025 to April 7th 2025 weakness, which stands at 19258.
With the latest price activity seeing weakness materialise again, it might now be suggested
this potential resistance range remains the important focus on the topside, although much will depend on future market sentiment and price trends.
With this in mind, what are the potential supports we might wish to monitor, to help us gauge how much further the current weakness may have to carry?
Possible Support Levels:
Fibonacci retracements can offer an insight into potential support zones, with them possibly able to hold, even reverse price weakness back to the upside. Therefore, 17404/17749, which is equal to the 50% and 61.8% Fibonacci retracements of the April price strength, maybe an area traders are currently focusing on.
However, there could still be potential for a further period of price weakness if this 17404/17749 range is broken on a closing basis. In that case, the next support may well then be represented by the April 7th 2025 session low at 16290, possibly further, if this in turn gives way.
Possible Resistance Levels:
The 17404/17749 support range is still intact, and while this remains the case on a closing basis, attempts at price strength could still be seen. However, with the declining Bollinger mid-average currently at 18648 and having recently seen it reverse attempts at price strength, closing breaks above this level might be required to trigger a more extended phase of strength.
That said, as proved the case in early April, 19258, the 50% Fibonacci retracement level, may also now need to give way on a closing basis, to suggest further attempts to develop price strength towards higher resistance levels.
The material provided here has not been prepared in accordance with legal requirements designed to promote the independence of investment research and as such is considered to be a marketing communication. Whilst it is not subject to any prohibition on dealing ahead of the dissemination of investment research, we will not seek to take any advantage before providing it to our clients.
Pepperstone doesn’t represent that the material provided here is accurate, current or complete, and therefore shouldn’t be relied upon as such. The information, whether from a third party or not, isn’t to be considered as a recommendation; or an offer to buy or sell; or the solicitation of an offer to buy or sell any security, financial product or instrument; or to participate in any particular trading strategy. It does not take into account readers’ financial situation or investment objectives. We advise any readers of this content to seek their own advice. Without the approval of Pepperstone, reproduction or redistribution of this information isn’t permitted.
Volatility

NQ Power Range Report with FIB Ext - 4/22/2025 SessionCME_MINI:NQM2025
- PR High: 17934.25
- PR Low: 17863.75
- NZ Spread: 157.5
No key scheduled economic events
Rollover to 17700 inventory
- Responding above previous session close, beginning inside print
Session Open Stats (As of 12:45 AM 4/22)
- Session Open ATR: 744.58
- Volume: 42K
- Open Int: 242K
- Trend Grade: Bear
- From BA ATH: -20.6% (Rounded)
Key Levels (Rounded - Think of these as ranges)
- Long: 20954
- Mid: 19246
- Short: 16963
Keep in mind this is not speculation or a prediction. Only a report of the Power Range with Fib extensions for target hunting. Do your DD! You determine your risk tolerance. You are fully capable of making your own decisions.
BA: Back Adjusted
BuZ/BeZ: Bull Zone / Bear Zone
NZ: Neutral Zone

UVXY shortVIX above regular range
After SPY quick down, VIX is high, there might be sideway consolidation.
Short entry 40
Stop 50,
Target 35
Risk management is much more important than a good entry point.
I am not a PRO trader.
In my trading plan, the Max Risk of each short term trade should be less than 1% of an account.

TRG, Buy Opportunity is coming up !Buy once price closes above BB50
Price target1: 92.59
Price Target2: 150

VXX shortVIX above regular range
After SPY quick down, VIX is high, there might be sideway consolidation.
Long entry 76
no Stop ,
Target 40
Risk management is much more important than a good entry point.
I am not a PRO trader.
In my trading plan, the Max Risk of each short term trade should be less than 1% of an account.

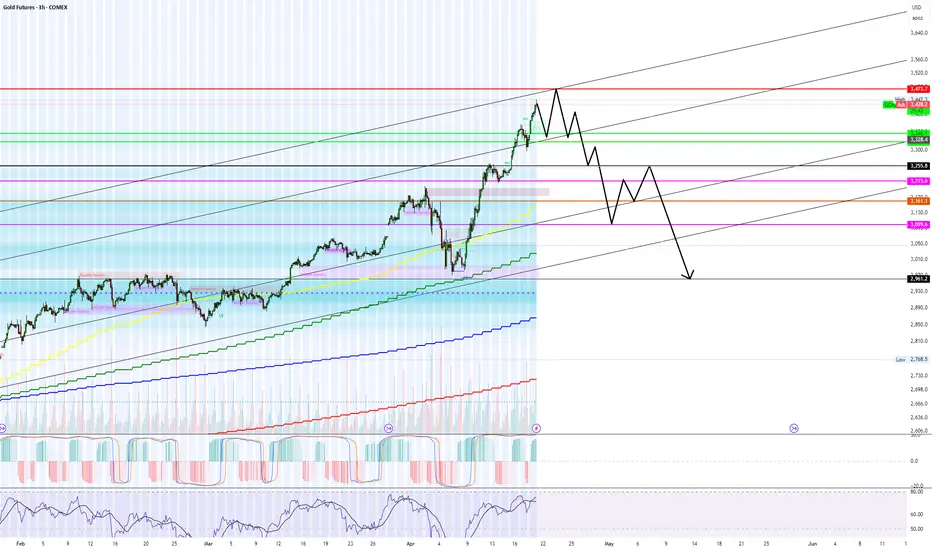
Agree to disagree... Gold is topping right now.My price path seen above is a complete guess but it stems from long term trend lines and more importantly order flow from last week.
On Thursday there was a #1 trade on AMEX:PHYS for $200+ Million at the green levels in my chart above (Equivalent levels). PRICE WILL 100% go to my green lines by end of this week 04/25.
We are over shooting the dark pool sale but a lot, however, this is always to trap retail and create fomo/peak fear.
In the correction/recession cycles, gold ALWAYS TOPS LAST before the crash...
Weekly plan for SolanaMarked the important levels in this video for this week and considered a few scenarios of price performance
I would like to see price support at the 130 level
Write a comment with your coins & hit the like button, and I will make an analysis for you
The author's opinion may differ from yours,
Consider your risks.
Wish you successful trades! MURA

NQ Power Range Report with FIB Ext - 4/21/2025 SessionCME_MINI:NQM2025
- PR High: 18383.50
- PR Low: 18231.25
- NZ Spread: 340.75
No key scheduled economic events
First day back after a week off for work
- Unfilled weekend gap of -0.24%
Session Open Stats (As of 12:25 AM 4/21)
- Session Open ATR: 751.20
- Volume: 34K
- Open Int: 238K
- Trend Grade: Bear
- From BA ATH: -19.5% (Rounded)
Key Levels (Rounded - Think of these as ranges)
- Long: 20954
- Mid: 19246
- Short: 16963
Keep in mind this is not speculation or a prediction. Only a report of the Power Range with Fib extensions for target hunting. Do your DD! You determine your risk tolerance. You are fully capable of making your own decisions.
BA: Back Adjusted
BuZ/BeZ: Bull Zone / Bear Zone
NZ: Neutral Zone

EURUSD - EURO's behavior towards the dollar is changing!Soon the EURO will shake the dollar's throne. Hold on to your Euros!

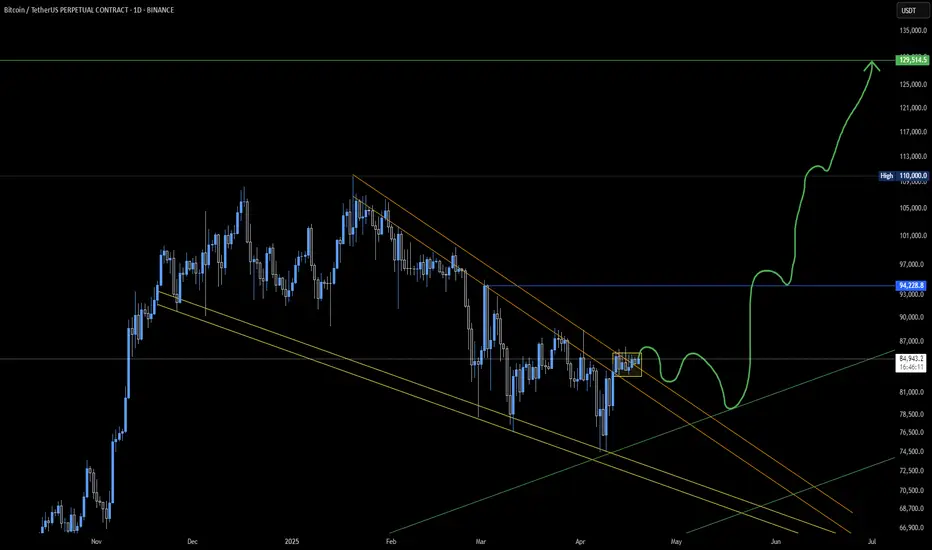
Bitcoin UP!A new Bitcoin ATH appearance is possible after saying Hello! to our green rising trend line from way back!
Charging Stations, Reduced Rates and Politics.With the future of the car industry looking dark and bright at the same time, HTZ has been over sold and bullied hard since its last pump with tesla ect.
My long term target I know it will hit is $8 over the next year.
I rarely call on meme stocks but no one is seeing this one coming ;)

Gold Price Rollercoaster: Is the Rally Just Beginning?The gold price has had a pretty crazy six days, jumping from 3,014 USD on April 9, 2025, to 3,357 USD on April 17 – that’s a solid 11%+ gain. So, what’s going on now? Is the gold rally over, or could we see even more upside? Let’s break it down.
🔥 What’s driving the gold price?
The big reason behind the recent surge is the trade war between the US and China. Trump has slapped new tariffs on imports from China, Mexico, and Canada, which has shaken things up in the markets. The Fed has also warned that these tariffs are bigger than expected, and could slow down growth and increase inflation.
When things get uncertain, investors tend to rush to safe havens like gold, and that’s exactly what’s happening right now. The demand for gold is up, and so is the price.
📉 What does the ECB rate cut mean?
The European Central Bank (ECB) has lowered interest rates by 0.25% today, dropping from 4.5% to 4.25%. They’re trying to help the economy out and ease inflation.
Lower rates mean fixed-income investments aren’t as attractive, which makes gold a better option. But, the US Fed has made it clear they won’t cut rates before June 2025, which could strengthen the US dollar and make gold a little less appealing.
🕊️ What if there’s a trade deal?
Now, imagine there’s a breakthrough – a trade deal, fairer tariffs, and everyone’s calming down. That could change things for gold:
📉 Less risk = less demand for gold: If things chill out, less capital will flow into gold.
💵 Stronger Dollar?: A trade deal could make the US dollar stronger, which isn’t necessarily great for gold. But Trump has made it clear that he doesn't want a strong dollar, since it makes US goods less competitive abroad. Even if the dollar does strengthen, it might put pressure on gold since it becomes more expensive for people using other currencies.
🔁 Money shifts: If things get calmer, investors might move away from gold and back into stocks or bonds for better returns.
So, a deal could definitely slow down or even end this gold rally.
🧭 What does this mean for investors?
Daytraders
For day traders, the current ups and downs can offer some good opportunities, but they also come with risks. The markets are super sensitive to news about the trade war and rate cuts. Quick gains are possible, but you’ve got to be careful. If a trade deal happens, expect the classic “Sell the News” scenario where the market cools off.
Medium-Term Investors (1 Month)
Over the next few weeks, we’ll see if more trade war news or central bank decisions impact the gold price. The rally could keep going, but nothing is guaranteed. If you’re in it for the medium-term, keep your positions flexible and manage risk closely. A trade deal could be bad news for gold, though.
Long-Term Investors
Long-term, gold is still a great way to hedge against inflation and geopolitical risks. The current trends could help gold prices, but keep in mind there could be some ups and downs. If the price drops due to a trade deal, it might actually be a good opportunity to buy.
📊 The Bottom Line
Gold has been on a hot streak lately, driven by the trade war and central bank moves. Whether this rally continues or cools down depends on what happens next. A trade deal could bring a correction. So, keep an eye on things and adjust your strategy accordingly.
-------------------------------------------------------------------------
This is just my personal market idea and not financial advice! 📢 Trading gold and other financial instruments carries risks – only invest what you can afford to lose. Always do your own analysis, use solid risk management, and trade responsibly.
Good luck and safe trading! 🚀📊

$30 imminent GME’s momentum is ROARING— Ever since the BTC news dropped GME has had significant volume front ran $27, flexed a savage pullback to lock in support, and handed us a golden entry last week. Went long and snatched shares at $24, $27, and $30—stacked for the next month’s fireworks. All eyes on BTC holding that weekly 50MA; if it cracks probably crashing to $60K+ to test support at that snooze-fest of a pattern. GME insider buys are screaming conviction. A dip close to $20 would be another gift. We are exactly at some weekly resistance and the floor could fall out of the market Wednesday with tariffs taking effect. Volatility has been off the charts across the board seems like the perfect storm. ANNND 4/20 is around the corner. “The most entertaining outcome is the most likely,”

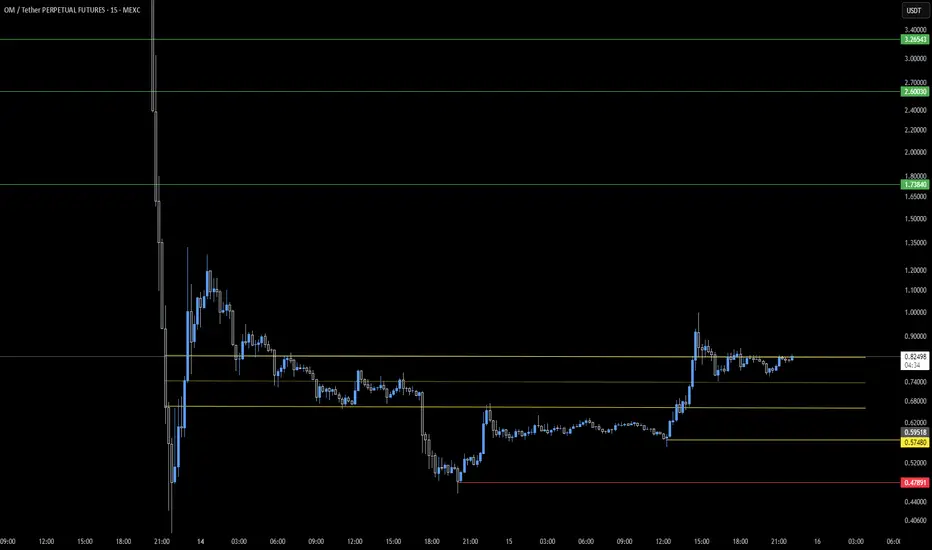
OM Coin - Last Status!All targets are on the table in OM. As long as there is no daily close below our yellow support box below, the direction is up!
COCORO. Do Only Good Everyday.Cocoro price is hold above moving average and if you use the basic strategy through Fibonacci retracement - now is an excellent entry point with 400% potential gain.
" Cocoro is latest family member adopted by Atsuko, the mother of Kabosu (aka Doge). This is the official IP token from the Own The Doge family, fully licensed and authenticated. When you own this token, you're not just collecting something cute - you're helping support Atsuko and non-profits that benefit both humans and dogs! "


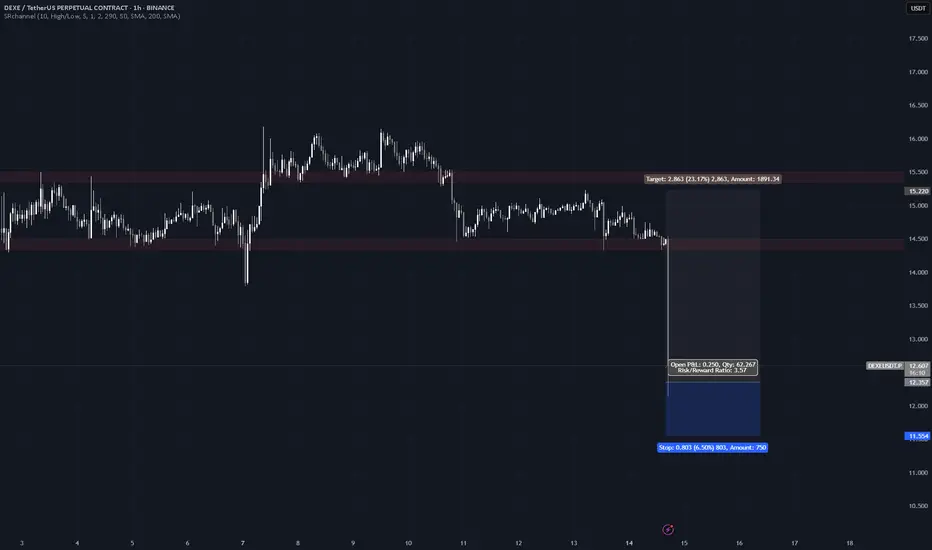
Rebound PlayThe irregular volume on this is unsustainable for this asset as well and its likely to rebound rapidly with at least a 25% upside.
US100 Don't be too greedy!!NO FINANCIAL ADVICE!
Looks like smart money wants to grab the stops of the retails... In these times... stay patient and wait for the moment! Trade safe! :)

Short VIDT40% on 20x leverage will make generational wealth. The downside is solely based off my model prediction and current volatility measurements and that the asset is being delisted.

GEX Analysis & Options “Game Plan”🔶 Short- and longer-term perspective in a high IV, negative GEX environment
🔶 KEY LEVELS & RANGES
Spot: 221
Gamma Flip / Transition: around 250 (the turquoise zone on the chart)
– This zone typically marks a “power shift.” If price decisively breaks above 250 and holds, market makers’ gamma positioning could flip from neutral/negative to positive.
Put Support: 200
– A large negative gamma position has accumulated here, making 200 a strong support level. If it breaks, the downside may accelerate.
Call Resistance: 400
– A major long-term “call wall” where a significant amount of OTM calls are concentrated. It’s more relevant to LEAPS; currently far from spot, so not a realistic short-term target.
Call Resistance #2: 300
– A medium-term bullish objective, still above the 200-day MA. You’d need to be strongly bullish to aim for ~300 by May (e.g., going for a 16-delta OTM call).
Short-Term / Intermediate GEX Levels:
– There are gamma clusters around 220–230 and 250–260 . These areas often see higher volatility, possible bounces, or stalls (chop) due to hedging flows.
🔶 WHATEVER SCENARIO – SHORT TERM (0–30 DAYS)
A) Upside Continuation / Rebound
– If TSLA closes above 225–230 , the next target is 240–250 (transition / gamma flip).
– If it breaks above 250 and holds (e.g., successful retest), market makers may shift to “long gamma,” fueling a quicker move to 260–270 .
– Resistance: 250, 300, with an extreme LEAPS-level at 400.
B) Downside Move / Bearish Break
– If price dips below ~220 and sustains, the next targets are 210–200 (major put wall / negative gamma).
– If 200 fails, negative gamma may magnify the sell-off. It’s an extreme scenario but still on the table given high IV and macro/geopolitical risks.
– Support: 210, 200 — likely stronger buying interest near 200, possibly a short-term bounce.
– The options chain suggests near-term hedging via puts for this scenario.
C) Chop / Sideways
– If TSLA stays in 210–230 , market makers (short options) might benefit from high IV/time decay.
– Negative GEX, however, can trigger sudden moves in either direction; caution is advised.
🔶 LONGER-TERM FOCUS (6–12 MONTHS, LEAPS)
NET GEX = -61.97M (negative territory) suggests longer-dated positioning is also put-heavy or carries notable negative gamma.
HVL / pTrans = 250 is a key pivot; cTrans+ = 400 is distant call resistance. Between these levels, there’s a mix of put/call dominance.
If Tesla undergoes a fresh growth phase (AI, robotaxi, energy storage, etc.) and clears 250/300 , 400 could become the next significant call wall — but that’s more of a multi-month horizon.
🔶 STRATEGY IDEAS (High IV Environment)
1. Short-Term Bearish
– If you’re bearish and expecting TSLA to test 220–210, consider a bear put spread or net credit put butterfly (lower debit) to leverage high IV.
– Targeting 200, but keep in mind negative gamma may accelerate downside movement.
2. Medium-Term “Contra” Bullish (bounce to 250)
– If GEX suggests a bounce off 210–220, consider a bull call spread (e.g., 220/240) or a net debit call butterfly (220/240/250).
– Be mindful of sudden swings, as we remain in negative gamma territory.
3. Longer-Term Bullish (>3–6 months)
– A call butterfly with upper strikes around 300–350 offers capped debit and higher potential payoff if a bigger rally materializes.
– A diagonal spread (selling nearer-dated calls, buying further-out calls) exploits elevated front-end IV.
4. Neutral / Range-Bound
– If TSLA stays in 200–250 , you could use Iron Condors (e.g., 200/260) to benefit from time decay and any IV collapse.
– Exercise caution: negative gamma can generate abrupt, directional moves, making a neutral stance riskier than usual.
🔶 ADDITIONAL NOTES & “BIG PICTURE”
High IV & Negative GEX: TSLA has a track record of large swings. Negative GEX can intensify sell-offs, while forced hedging might trigger rapid rebounds.
Preferred Structures: With expensive premiums, spreads (vertical, diagonal) and butterfly configurations generally fare better than plain long options (less vulnerable to time decay).
Potential Catalysts: AI announcements, Autopilot breakthroughs, new product lines, and macro changes can swiftly alter market dynamics. Keep tracking GEX updates and news flow; TSLA tends to respond dramatically to fresh developments.
🔶 Bottom line: From 221 spot, watch 210–200 on the downside and 240–250 on the upside short term. Medium-term bullish target = 300 , while 400 remains a far LEAPS scenario. High IV + negative gamma = fast, potentially volatile moves — so risk management and spread-based approaches are crucial.

04/07 GEX + Historic VIX Highs: Extreme Volatility with OptionsWow, where to begin? We’ve just come through a week that even the most thorough analysts found surprising.
Last Friday’s brutal sell-off triggered such a massive margin call rally that even the hedge funds were forced to exit gold—which is usually considered a safe haven—on Friday.
The VIX is at a historic high — no joke. We last saw levels like this during the 2008 crisis and the COVID panic in 2020.
📌 High IV = High Theta
When implied volatility (IV) is high, theta (the time decay of options) is also high. This means that maintaining long put protection becomes extremely expensive. From a broker’s hedging perspective, if they are short expensive put options, they can gradually buy back their futures positions over time (all else being equal). As IV rises, this buyback becomes increasingly attractive for them.
Let’s look at our weekly SPY analysis using GEX Profile (Gamma Exposure) indicator first:
It’s definitely not a cheerful chart!
* Below 520: We have strikes dominated by puts. The largest negative GEX “profit-taking zone” sits at 490. If price reaches that level and the support fails (the previous major bottom from April 2024), we could move even further down into a very wide negative squeeze zone, possibly as far as 445.
* HVL zone: 520–546: A choppy area around the gamma flip.
* Above 546: This would signal a +10-15% rally, putting us in a positive gamma zone. However, such a scenario currently seems unlikely—at least based on the gamma levels we see right now.
I won’t sugarcoat it: we’re at levels now where the market could easily move 10% in either direction. So, in my view, forget about conservative option strategies with flat delta exposure.
🤔 What Can We Do?
Important: This analysis reflects my personal opinion only. It’s primarily for those looking to speculate in this highly uncertain environment. If you’re holding put options strictly as a hedge, then this may not be directly relevant to you. In these conditions, the number one rule is to survive—hedges are meant to protect assets or guard against margin calls, not to make profit.
Currently, IV (implied volatility) and VIX are at historic highs. For them to stay this elevated, we’d need new negative headlines and further major market drops. While that could certainly happen, statistically it becomes less and less likely as time goes on.
Buying Put Options …. no way?
First off, there are plenty of challenges if you plan to buy put options right now—most of all their cost. Put options are nearly twice as expensive as calls in many cases.
Does this mean I recommend selling puts or put spreads? I’m not saying you shouldn’t, but be aware: this isn’t for the faint-hearted or for beginners (the risk is high!). It might be worth exploring butterfly or vertical debit spread strategies, as our goal remains the same as always: to maximize the risk–reward ratio.
🐂 If You’re Bullish
This might sound like a ninja move, but one possibility is to buy call butterfly spreads. Yes, the market could still drop—that’s absolutely possible. But statistically, it’s becoming less likely that we’ll see another huge leg down without some form of rebound.
- Slight Move Up: In the event of a mild rise, call spreads and call butterfly strategies can significantly outperform a simple long call. The short legs in a spread/fly offset high theta costs and mitigate the negative effects of falling IV.
- Even with a +10% Move: A long call is often still not the best choice in this environment—even if the option goes deep in the money.
Where Call Spread/Butterfly Can Fail
If stocks rally 15–20% or more and IV also increases (which would be unprecedented in just a few days).
If the market crashes and VIX spikes above 100 (IV would skyrocket, raising the cost of all options further).
Cheap Bullish Calendar Spread
In a situation like this, even a cheap calendar spread can be a good play — the risk is relatively low, especially if managed well and the breakeven range is wide. Of course, if implied volatility drops, the spread could narrow, but that would likely come with a market rally, which theta can help capitalize on.
🐻 If You’re Bearish
I strongly advise against buying single-leg puts, even on a 0DTE (zero-days-to-expiration) basis. If you’re convinced the market will keep dropping, I’d only consider debit spreads, aiming for a solid risk–reward ratio (in my case, I look for at least 1:2 risk-to-reward).
⚖️ If You Want to Stay Neutral / Omni bullish
If you prefer not to pick a direction, you could try to capitalize on historically high IV with a May-expiration Iron Condor. This is the classic TastyTrade approach, with the caveat that you must monitor GEX levels and IV daily and adjust the far side as needed.
Risk Management: If the spot price threatens one of your short strikes, you probably shouldn’t wait around in this volatile environment. It’s usually better to close the position and take a small loss than to hope for a reversal—hoping can become very expensive!
Conclusion
The market is extremely volatile, and expensive options mean traditional strategies may not work as well as they usually do. Stay cautious, manage risk meticulously, and don’t be afraid to close out losing trades quickly. As always, surviving to trade another day is the most important rule.


NQ Power Range Report with FIB Ext - 4/11/2025 SessionCME_MINI:NQM2025
- PR High: 18597.75
- PR Low: 18464.50
- NZ Spread: 297.25
Key scheduled economic events:
08:30 | PPI
Retraced 50% of Wednesday's range
- Rotating off 18400 zone pivot, above previous session close
- High volatility sentiment continues
Session Open Stats (As of 12:55 AM 4/11)
- Session Open ATR: 865.12
- Volume: 54K
- Open Int: 236K
- Trend Grade: Bear
- From BA ATH: -17.7% (Rounded)
Key Levels (Rounded - Think of these as ranges)
- Long: 20954
- Mid: 19246
- Short: 16963
Keep in mind this is not speculation or a prediction. Only a report of the Power Range with Fib extensions for target hunting. Do your DD! You determine your risk tolerance. You are fully capable of making your own decisions.
BA: Back Adjusted
BuZ/BeZ: Bull Zone / Bear Zone
NZ: Neutral Zone
