Path to 100 VIXI wrote this note on TVC:VIX a few days ago:
www.tradingview.com
And am now expanding it a bit more.
As someone who was working middle office during the original 2016 Trump Election, Brexit, during the Taper Tantrum and a few other major events - I want to lay out my principles on trading the VIX because spikes like this bring a lot of "first time" VIX traders to something that trades like NOTHING ELSE in the market.
This is not a stock in a short squeeze, this is not a generic index.
This is like nothing you've ever traded before. In fact, I'd encourage you to take advantage of TradingView's chart options and instead look at the chart of -1*$TVC:VIX.
That alone should give you pause.
----------------------------------
So - let's start with the principles of the finance business as laid out in the masterclass which was the movie "Margin Call" .
"John Tuld: There are three ways to make a living in this business: be first, be smarter, or cheat."
1. Be First.
You are not first if you are buying above the historic average of VIX 20-21.
If you were buying CBOE:UVXY since Jan 2025, you'd be up 175% right now and likely looking to re-balance into your desired long term asset positions.
2. Be Smarter.
* Are you taking into consideration the VIXEX Cycle?
* Do you know the effect of VIXEX before or after monthly OpEx?
* Do you know the current implied volatility curve of options ON the VIX?
* Do you know that of the last 4 times the VIX has hit 50, it went on to 80+ 50% of the time after that?
* Yes, I've seen the charts going around about forward S&P X year returns but did you know that after the VIX spike to 80 in October 2008, the market (in a decreasing volatility environment) went on a further 35% decline in the next 4-5 months?
* Where is the MOVE? What are the bond indexes & bond volatility measures doing? And if you don't yet understand that equities ALWAYS reacts to what is going on in the rates / yield world... you'll find out eventually. I hope.
3. Cheat
When things start going wrong, everyone wants an easy solution.
That's why its called a relief rally. It feels like relief - the bottom is in, the worst part is over.
But that is what the really big players have the biggest opportunity to play with the day to day environment.
They know our heuristics. They encourage the formation of cargo cult style investing whether that's HODL in the cryptocurrencies or Bogleheads in the vanguard ETFs.
It's all the same and encourages you to forgot first principles thinking about things like:
1. Is this actually a good price or is it just relatively cheap to recent history?
2. Who's going to have to dilute to survive the next period of tighter lending, import costs from tariffs, or whatever the problem of the day is.
3. VIX correlation - volatility is just a description of the markets. Its not a description of the direction. There is periods where volatility is positively correlated to the price movement (like during earnings beats). Know about this and know when it changes.
4. Etc.
Some have pointed out that is more appropriately a measure of liquidity in the SPX.
When VIX is low, that means there is lots of "friction" to price movement. It means that there is tons of orders on the L2 book keeping the current price from moving in any direction too quickly.
When VIX is high, that means there is very low "friction" to price movement. It means there are very few orders on the L2 book and market makers can "cheat" by appearing to create a low volume rally and then rug pull that price movement very quickly (not via spoofing, more just dynamic management of gamma & delta hedging requirements).
Additionally - volume itself becomes deceptive. Volume is just indicating that a trade happened.
Its not telling you to what degree the spread between the bid and ask has blown out to 1x, 2x, or 5x normal and that trades are executing only at the highest slippage prices in that spread.
All of these things are considerations that the market makers can use to make a "buy the dip" situation that works heavily to their advantage.
TLDR: "If you can't spot the sucker in your first half hour at the table, then you are the sucker"
----------------------------------
So - why / when would VIX go to 100?
In 2020, its easy to forget that a culmination of things stopped the crash at -35%.
* March 17, 2020 VIXEX wiped out a significant amount of long volatility positions.
* March 20, 2020 Opex wiped out a significant proportion of the short term put positions
* March 20, 2020 Fed Reserve announced to provide "enhanced" (i.e. unlimited) liquidity to the
markets starting Monday March 23, 2020.
* April 6th, 2020 Peak of Implied Volatility (point where options "most expensive") - which meant that buyers / sellers started providing more & more liquidity following this point.
In 2025, we have yet to see:
* Any motion towards intervention from the Fed for liquidity.
* Any motion from the significant fundamental investors (we're not close to an attractive P/S or P/E on most stocks for Buffett & Co to start buying)
* Any significant motion from companies on indicating strategies about capital raises, layoffs, or other company level liquidity reactions.
* Any "reset" of options in either volatility or hedging. Numbers below as of April 9, 2025:
- SPY 2.8M Put OI for April 17
- VIX 3.5M Call OI for April 16
Just an example but maybe IF we see those clear and NOT get re-bought for May Opex... we might be ready to call a top here at 50 VIX.
Otherwise.... we're just at another stop on the path to 100.
Volatility

NQ Power Range Report with FIB Ext - 4/9/2025 SessionCME_MINI:NQM2025
- PR High: 17240.00
- PR Low: 16971.00
- NZ Spread: 601.5 ⚠
Key scheduled economic events:
10:30 | Crude Inventories
13:00 | 10-Year Note Auction
14:00 | FOMC Meeting Minutes
Mechanical pivot off Monday's high
- Rotating back into 16700s inventory
- AMP margins and volatile session open indicates we're still in the volatility storm
Session Open Stats (As of 12:45 AM 4/9)
- Session Open ATR: 692.29
- Volume: 84K
- Open Int: 256K
- Trend Grade: Bear
- From BA ATH: -24.4% (Rounded)
Key Levels (Rounded - Think of these as ranges)
- Long: 20954
- Mid: 19246
- Short: 16963
Keep in mind this is not speculation or a prediction. Only a report of the Power Range with Fib extensions for target hunting. Do your DD! You determine your risk tolerance. You are fully capable of making your own decisions.
BA: Back Adjusted
BuZ/BeZ: Bull Zone / Bear Zone
NZ: Neutral Zone

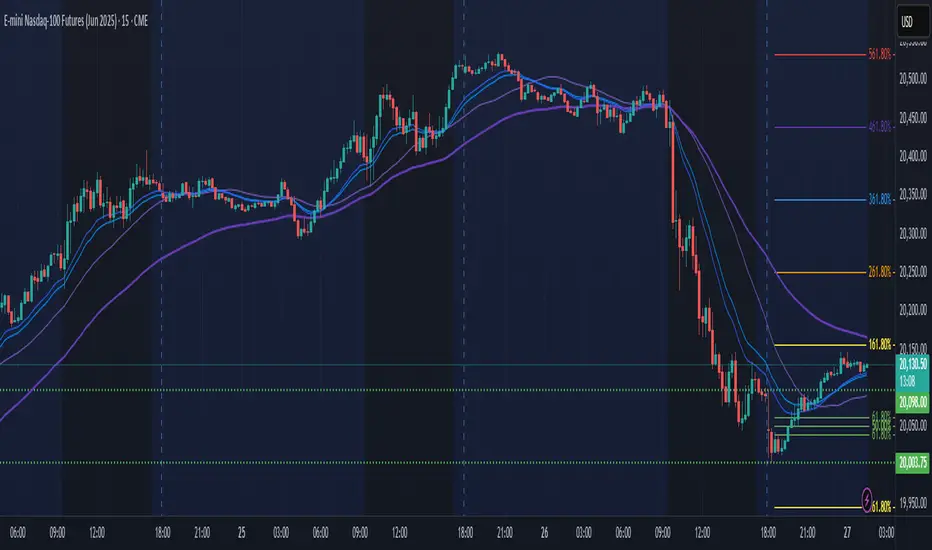
Need clarity on what's most likely to come? I got u!Price has followed my path to a tea (Not exact prices but more of the cycles of price movement)
We will hit 450 on QQQ by Tuesday and Trump is most likely to back peddle on tariffs for select countries.
TARIFFS ARE ONLY MEANT TO REDUCE THE 10 YY FOR TRUMP TO REFINANCE OUR NATIONAL DEBT.
Nothing else.
Please see my black line of what I think price action will do.

NQ Power Range Report with FIB Ext - 4/8/2025 SessionCME_MINI:NQM2025
- PR High: 17753.75
- PR Low: 17644.50
- NZ Spread: 244.0
No key scheduled economic events
Volatility remains high with Trump tariff excitement
- Advertising rotation off previous session low
- Holding above the close below the high, inside Friday's range
- AMP margins temp increase remains
Session Open Stats (As of 12:45 AM 4/8)
- Session Open ATR: 627.37
- Volume: 48K
- Open Int: 272K
- Trend Grade: Bear
- From BA ATH: -21.4% (Rounded)
Key Levels (Rounded - Think of these as ranges)
- Long: 20954
- Mid: 19246
- Short: 16963
Keep in mind this is not speculation or a prediction. Only a report of the Power Range with Fib extensions for target hunting. Do your DD! You determine your risk tolerance. You are fully capable of making your own decisions.
BA: Back Adjusted
BuZ/BeZ: Bull Zone / Bear Zone
NZ: Neutral Zone

NQ Power Range Report with FIB Ext - 4/7/2025 SessionCME_MINI:NQM2025
- PR High: 17100.00
- PR Low: 16550.00
- NZ Spread: 1231.0 ⚠
No key scheduled economic events
AMP margins remain increased due to tariff news
- Continue high volatility value decline, 2.45% weekend gap
- Weekend gap fills above 17417
- Overall sentiment: anxiously hesitant in hopes of a nearby bottom
Session Open Stats (As of 12:15 AM 4/7)
- Session Open ATR: 593.15
- Volume: 131K
- Open Int: 276K
- Trend Grade: Bear
- From BA ATH: -25.8% (Rounded)
Key Levels (Rounded - Think of these as ranges)
- Long: 20954
- Mid: 19246
- Short: 16963
Keep in mind this is not speculation or a prediction. Only a report of the Power Range with Fib extensions for target hunting. Do your DD! You determine your risk tolerance. You are fully capable of making your own decisions.
BA: Back Adjusted
BuZ/BeZ: Bull Zone / Bear Zone
NZ: Neutral Zone

$VIX Hits 45! $BTC Historically Pumps Soon AfterThe TVC:VIX has only hit above 45 on 5 occasions in the history of CRYPTOCAP:BTC
Each time it did, BTC pumped at least 20%

$SPY Bollinger Bands and RSI Oversold SignalThe AMEX:SPY aka S&P 500 is delivering a daily Bollinger Bands and RSI oversold signal today
In the last ten years there has been a bigger recovery shortly after such an signal

NQ Power Range Report with FIB Ext - 4/4/2025 SessionCME_MINI:NQM2025
- PR High: 18698.00
- PR Low: 18588.25
- NZ Spread: 245.25
Key scheduled economic events:
08:30 | Average Hourly Earnings
- Nonfarm Payrolls
- Unemployment Rate
11:25 | Fed Chair Powell Speaks
AMP margins remains increased but lowered to 25%
- Value decline continues, dipping into 18400s inventory
- Auction holding just below previous session low
Session Open Stats (As of 12:55 AM 4/4)
- Session Open ATR: 482.31
- Volume: 48K
- Open Int: 261K
- Trend Grade: Bear
- From BA ATH: -18.2% (Rounded)
Key Levels (Rounded - Think of these as ranges)
- Long: 20954
- Mid: 19814
- Short: 18106
Keep in mind this is not speculation or a prediction. Only a report of the Power Range with Fib extensions for target hunting. Do your DD! You determine your risk tolerance. You are fully capable of making your own decisions.
BA: Back Adjusted
BuZ/BeZ: Bull Zone / Bear Zone
NZ: Neutral Zone

NQ Power Range Report with FIB Ext - 4/3/2025 SessionCME_MINI:NQM2025
- PR High: 19037.00
- PR Low: 18819.00
- NZ Spread: 487.25
Key scheduled economic events:
08:30 | Initial Jobless Claims
09:45 | S&P Global Services PMI
10:00 | ISM Non-Manufacturing PMI
- ISM Non-Manufacturing Prices
AMP temporarily increased margin requirements to double the standard rate ahead of Trump tariff announcement
- Over 740 point session gap down
- Extreme volatile open aligned with tariff anticipation
- Value decline continues to 18000 inventory following touch and go off daily Keltner average cloud
- Auction rotating back to previous session low
Session Open Stats (As of 12:25 AM 4/3)
- Session Open ATR: 484.77
- Volume: 85K
- Open Int: 249K
- Trend Grade: Bear
- From BA ATH: -15.7% (Rounded)
Key Levels (Rounded - Think of these as ranges)
- Long: 20954
- Mid: 19814
- Short: 18675
Keep in mind this is not speculation or a prediction. Only a report of the Power Range with Fib extensions for target hunting. Do your DD! You determine your risk tolerance. You are fully capable of making your own decisions.
BA: Back Adjusted
BuZ/BeZ: Bull Zone / Bear Zone
NZ: Neutral Zone

S&P 500 Short Setup – Key Resistance in Focus!🔥 I’m watching this critical resistance zone on the S&P 500 (US500)! A rejection at this level could spark strong bearish momentum. A clear reaction at resistance is key for confirmation.
📍Entry: 5,726.50 USD – just below the key resistance, but only after rejection is confirmed
🎯Targets:
TP1: 5,645.00 USD
TP2: 5,610.00 USD
TP3: 5,585.00 USD
⛔Stop-Loss: 5,768.00 USD
⚡ Patience is crucial, waiting for confirmation reduces risk and boosts accuracy! Would you take this trade? Let me know below! 👇

Bitcoin Analysis: Trump Tariffs AnnouncementAs of April 2nd, 2025, Bitcoin finds itself at a pivotal technical crossroads, with price action consolidating within a well-defined range as markets prepare for Trump's upcoming tariff policy speech. The cryptocurrency has experienced significant volatility in recent weeks, with a sharp decline from the $98,000 level followed by a consolidation phase.
Technical Structure and Price Action
The daily chart reveals Bitcoin trading in a rectangular consolidation pattern between approximately $79,800 and $88,800. This range-bound price action follows a substantial corrective move from recent highs, with the market now seeking direction. Current price hovers around $84,890, sitting below the mid-point of this established range.
The blue box on the chart highlights this recent consolidation zone, where price has been oscillating for several trading sessions. This pattern typically represents a pause in the market as buyers and sellers reach temporary equilibrium before the next directional move.
Volume Analysis Provides Crucial Insights
Looking at the Relative Volume Indicator (RVOL) at the bottom of the chart, we can observe several noteworthy volume patterns:
-Several green bars exceeding the 2.0x threshold indicate periods of significantly above-average volume during the decline and subsequent consolidation
-More recent trading sessions show predominantly yellow and red bars, suggesting a return to average and below-average volume as the market consolidates
-The most recent green volume spike coincides with a bullish candle, potentially indicating renewed buying interest
This volume profile suggests that while the initial selloff occurred on strong volume (confirming the downtrend's validity), the recent consolidation is happening on decreasing volume – often a precursor to a significant move.
Critical Levels to Watch
With Trump's tariff announcement looming, traders should monitor these key levels:
Support: $79,800 (lower range boundary)
Intermediate resistance: $88,800 (higher range high)
Intermediate support: $82,000 (recent swing low)
What Could Happen Next?
The cryptocurrency market's reaction will likely hinge on the tone and specifics of Trump's tariff policies:
Bullish Scenario
If Trump's tariff policies are perceived as positive for risk assets or specifically favorable for cryptocurrency:
A break above $90,000 could trigger a relief rally toward previous highs
The declining volume during consolidation could represent a coiling effect before an explosive move higher
Target zones would be $95,000 and potentially a retest of the $98,000 area
Bearish Scenario
If the announcement creates market uncertainty or suggests policies that might negatively impact risk assets:
A breakdown below $79,800 would confirm continuation of the larger downtrend
Volume would likely expand on a breakdown, providing confirmation
The next major support zones would become $75,000 and $70,000
Conclusion
Bitcoin stands at a technical inflection point, with the upcoming tariff announcement serving as a potential catalyst for its next major move. The consolidation pattern, coupled with the volume profile shown in the RVOL indicator, suggests traders should prepare for increased volatility.
Given the mixed signals – bearish price structure but consolidation with occasional above-average volume spikes – a measured approach is prudent. Traders would be wise to wait for a definitive break of either range boundary with confirming volume before establishing significant positions.
The next 24-48 hours could determine whether Bitcoin resumes its longer-term uptrend or continues the correction that began from the $98,000 level.

INTRADAY MOVEMENT EXPECTEDi can see still there is liquidity above at the poc of the weekly volume
but if the price can cross up the level it can visit the next resistance above
so if the price at london session cross down the value area i will expect visit the levels shown on the chart as support and make the rejection
so we have to follow the plan and and use the levels on the chart risk management safe the profit secure the orders after the price move stop at break even
we wish happy trade for all

NQ Power Range Report with FIB Ext - 4/2/2025 SessionCME_MINI:NQM2025
- PR High: 19697.00
- PR Low: 19595.25
- NZ Spread: 228.25
Key scheduled economic events:
08:15 | ADP Nonfarm Employment Change
10:30 | Crude Inventories
Key daily zones updated
- 200+ point rotation above Monday's high
- Auction back inside previous week range
- Retraced 1/3 of Friday's selloff
Session Open Stats (As of 12:25 AM 4/2)
- Session Open ATR: 437.34
- Volume: 31K
- Open Int: 248K
- Trend Grade: Neutral
- From BA ATH: -13.5% (Rounded)
Key Levels (Rounded - Think of these as ranges)
- Long: 20954
- Mid: 19814
- Short: 18675
Keep in mind this is not speculation or a prediction. Only a report of the Power Range with Fib extensions for target hunting. Do your DD! You determine your risk tolerance. You are fully capable of making your own decisions.
BA: Back Adjusted
BuZ/BeZ: Bull Zone / Bear Zone
NZ: Neutral Zone

PEB Pacific Edge NZBreakout and retest with bollinger band squeeze
I've posted multiple times about this stock and it is no doubt high risk and speculative,
but technically it is showing bullish signs in my opinion and looking ready to move
Full disclosure I've owned this stock for a while now, and looking at long term (years) play

NQ Power Range Report with FIB Ext - 4/1/2025 SessionCME_MINI:NQM2025
- PR High: 19413.75
- PR Low: 19326.75
- NZ Spread: 194.25
Key scheduled economic events:
09:45 | S&P Global Manufacturing PMI
10:00 | ISM Manufacturing PMI
- ISM Manufacturing Prices
- JOLTs Job Openings
Holding below previous week's low
- Advertising rotation above previous session high, into breakout range
Session Open Stats (As of 12:35 AM 4/1)
- Session Open ATR: 442.17
- Volume: 38K
- Open Int: 247K
- Trend Grade: Neutral
- From BA ATH: -14.5% (Rounded)
Key Levels (Rounded - Think of these as ranges)
- Long: 20954
- Mid: 19814
- Short: 18675
Keep in mind this is not speculation or a prediction. Only a report of the Power Range with Fib extensions for target hunting. Do your DD! You determine your risk tolerance. You are fully capable of making your own decisions.
BA: Back Adjusted
BuZ/BeZ: Bull Zone / Bear Zone
NZ: Neutral Zone

Gold Price Surges Amid Market Uncertainty – What’s Next?The late Friday session on March 28, 2025, ended with a strong rally in gold, as multiple price candles attempted to push higher. By 10 PM CET, gold had settled at $3,085.345, reflecting significant bullish momentum.
As the market reopened on Monday, the gold price gapped up by approximately +$12.5 , opening at $3,097.978 .
This type of price gap typically occurs when buyers are willing to pay more than the previous session’s close, signaling strong demand.
What’s Driving the Gold Rally?
The answer lies in a mix of tariffs, war, and recession fears. The global financial landscape remains highly unstable, and in times of uncertainty, gold historically acts as the preferred safe-haven asset. Investors are flocking to the precious metal as a hedge against economic instability.
Adding fuel to the fire, on April 2nd, additional U.S. tariffs imposed by President Donald Trump are set to take effect. This move could further disrupt markets, potentially driving even more capital into gold.
The Interest Rate Factor – A Hidden Risk?
While gold is surging, there’s a crucial factor to watch: Federal Reserve policy. So far, Fed Chair Jerome Powell has maintained a cautious stance on interest rates. However, if the situation deteriorates, the Fed might be forced to cut rates earlier than expected to stabilize the economy.
This could create a paradox for gold traders. While rate cuts typically support gold in the long run, a sudden policy shift could trigger a short-term sell-off as investors adjust their positions. If that happens, gold could see a sharp correction before resuming its trend.
Final Thoughts
Gold remains in a strong uptrend, but traders should stay cautious. If the Fed pivots and announces rate cuts sooner than expected, we could see a pullback in gold before the next leg higher. The coming days will be critical – keep an eye on April 2 and any shifts in Fed policy that could shake up the market.
👉 Will gold continue its rally, or are we facing a major pullback? Share your thoughts in the comments! 🚀
-------------------------------------------------------------------------
This is just my personal market idea and not financial advice! 📢 Trading gold and other financial instruments carries risks – only invest what you can afford to lose. Always do your own analysis, use solid risk management, and trade responsibly.
Good luck and safe trading! 🚀📊

NQ Power Range Report with FIB Ext - 3/31/2025 SessionCME_MINI:NQM2025
- PR High: 19365.00
- PR Low: 19275.00
- NZ Spread: 201.25
Key scheduled economic events:
09:45 | Chicago PMI
Continuing value decline below Friday's low
- Broke previous weeks low
- Short-term rotating off 19180s inventory floor
Session Open Stats (As of 12:45 AM 3/31)
- Session Open ATR: 444.15
- Volume: 70K
- Open Int: 241K
- Trend Grade: Neutral
- From BA ATH: -15.1% (Rounded)
Key Levels (Rounded - Think of these as ranges)
- Long: 20954
- Mid: 19814
- Short: 18675
Keep in mind this is not speculation or a prediction. Only a report of the Power Range with Fib extensions for target hunting. Do your DD! You determine your risk tolerance. You are fully capable of making your own decisions.
BA: Back Adjusted
BuZ/BeZ: Bull Zone / Bear Zone
NZ: Neutral Zone

DOG. x1000 entry pointEntry point is identical to the entry point of the first idea publication for this asset. The entry point is amazing in both the medium and long term. The entry point is very gud. This is entry point, sirs. Prepare your bags. Thanks.

NQ Power Range Report with FIB Ext - 3/28/2025 SessionCME_MINI:NQM2025
- PR High: 20011.75
- PR Low: 19983.25
- NZ Spread: 63.5
Key scheduled economic events:
08:30 | Core PCE Price Index (MoM|YoY)
Holding value in the weekend gap range at previous session close
- Daily rotation short out of the Keltner average cloud, 20400-600 range
Session Open Stats (As of 12:55 AM 3/28)
- Session Open ATR: 421.56
- Volume: 22K
- Open Int: 233K
- Trend Grade: Neutral
- From BA ATH: -11.7% (Rounded)
Key Levels (Rounded - Think of these as ranges)
- Long: 20954
- Mid: 19814
- Short: 18675
Keep in mind this is not speculation or a prediction. Only a report of the Power Range with Fib extensions for target hunting. Do your DD! You determine your risk tolerance. You are fully capable of making your own decisions.
BA: Back Adjusted
BuZ/BeZ: Bull Zone / Bear Zone
NZ: Neutral Zone

NQ Power Range Report with FIB Ext - 3/27/2025 SessionCME_MINI:NQM2025
- PR High: 20098.00
- PR Low: 20003.25
- NZ Spread: 212.0
Key scheduled economic events:
08:30 | Initial Jobless Claims
- GDP
Partial weekend gap fill
- Retracing above previous session close, in previous week range highs
- Re-enters daily Keltner average cloud near 20200
Session Open Stats (As of 12:35 AM 3/27)
- Session Open ATR: 439.39
- Volume: 42K
- Open Int: 228K
- Trend Grade: Neutral
- From BA ATH: -11.1% (Rounded)
Key Levels (Rounded - Think of these as ranges)
- Long: 20954
- Mid: 19814
- Short: 18675
Keep in mind this is not speculation or a prediction. Only a report of the Power Range with Fib extensions for target hunting. Do your DD! You determine your risk tolerance. You are fully capable of making your own decisions.
BA: Back Adjusted
BuZ/BeZ: Bull Zone / Bear Zone
NZ: Neutral Zone
Euro March 26, 2025All it want to take out the PDL - No strength for PDH at all even after all scenerios build supporting PDH as Liquidity

03/24 SPX Weekly GEX Outlook, Options FlowYou can see that every expiry has shifted into a stronger bullish stance heading into Friday, with GEX exposure moving upward across the board—though total net GEX is still in negative territory, while net DEX (delta exposure) is positive. This combination points toward a likely near-term rebound this week, which makes sense after testing the 5600 range last week….
Here’s a more detailed breakdown of the key zones and likely moves this week:
Bullish Target:
The current uptrend could reach 5750 on its first attempt (already reached in Monday, thx bullsh :) ). If a positive gamma squeeze emerges at that level, we might see an extension to 5800 or even 5850 as a final profit-taking zone for bulls this week.
HVL (Gamma Slip Zone):
Placed at 5680, this threshold currently supports a low-volatility environment. A drop below 5680, however, could reignite fear and fuel bearish momentum.
Put Floors & Net OI:
The largest net negative open interest (OI) cluster is at 5650, with the next key level near 5600. At 5600, net DEX reads fully positive, suggesting strong buying support if the market tests that lower boundary.

NQ Power Range Report with FIB Ext - 3/25/2025 SessionCME_MINI:NQM2025
- PR High: 20531.50
- PR Low: 20504.00
- NZ Spread: 61.5
Key scheduled economic events:
08:30 | Durable Goods Orders
09:30 | Crude Oil Inventories
Cleared previous week high, raising value towards 20600
- Auctioning inside daily Keltner average cloud below previous session close
- Weekend gap remains unfilled
Session Open Stats (As of 1:55 AM 3/25)
- Session Open ATR: 432.71
- Volume: 24K
- Open Int: 224K
- Trend Grade: Neutral
- From BA ATH: -9.6% (Rounded)
Key Levels (Rounded - Think of these as ranges)
- Long: 20954
- Mid: 19814
- Short: 18675
Keep in mind this is not speculation or a prediction. Only a report of the Power Range with Fib extensions for target hunting. Do your DD! You determine your risk tolerance. You are fully capable of making your own decisions.
BA: Back Adjusted
BuZ/BeZ: Bull Zone / Bear Zone
NZ: Neutral Zone
