EMUDHRA - Ascending channel pattern All details are given on chart. If you like the analyses please do share it with your friends, like and follow me for more such interesting breakout charts.
Disc - Am not a SEBI registered. Please do your own analyses before taking position. This post is only for educational purposes and not a trading recommendation.
Volumeanalysis

Wyckoff Phase E Nearing CompletionBTC at present is ranging on the $20,000 support and as long as the price remains above $17,567.5 BTC is bullish. Price below $17,567.5 is bearish. From a waves perspective the only remaining bullish count is a diagonal in wave 1 which is valid above $17,567.5. Expect further downside if price confirms below the origin of wave 1 at $17,567.5. Expected downside in a best case scenario is around $12,500 worst case scenario is around $4,000.

APPLE INC "dont buy now!!"wait for the right time to buy NASDAQ:AAPL .
don't forget to leave your comment.

EOS/USDT BINANCE 4H 🎆HI All 🎀
This crypto currency prone to growth has registered a new support zone with its reaction to the $0.8 level. Also, with several hits to this level, it validated the validity of this support area, changed its nature and started its upward trend.
As you can see, these higher floors that have been created show a red uptrend line.
Using the Volume indicator, monitor the volumes entered into this growth-prone currency, which, if this currency is supported, the ability to reach the targets of $1.8, $1.95, $2.2 seems reasonable.
Arztoday 👒

JUBLFOOD - Double bottom patternAll details are given on chart. If you like the analyses please do share it with your friends, like and follow me for more such interesting breakout charts.
Disc - Am not a SEBI registered. Please do your own analyses before taking position. This post is only for educational purposes and not a trading recommendation.

AUTOAXLES - Long with 7 to 8% ROIAscending parallel channel and Head & Shoulder pattern in hourly time frame
All details are given on chart. If you like the analyses please do share it with your friends, like and follow me for more such interesting breakout charts.
Disc - Am not a SEBI registered. Please do your own analyses before taking position. This post is only for educational purposes and not a trading recommendation.

beginning of heavy uptrend high risk asseti made a top down analysis of this asst : a complete cycle of 5 waves to the downside is completed, price is ready to make a pull back at the origin of the downtrend.
warning : genomic vision is a very risky asset !

AUD/USD Likely to fall!Hey tradomaniacs,
looks like AUD/USD wants to continue with the previous breakout to move down.
Current dissapointment by Jerome Powell saying they won`t ease their monetry policy in the upcoming future caused another risk-off-mood in equities and a strong US-Dollar.
If we see more sell-offs on indicies be ready to short aud/usd - Technically a good spot to sell!

NERV- Biotechnology Penny Stock BreakoutNASDAQ:NERV
NERV is already well into the breakout (100%)
with a massive volume surge.
Probably too late to get into a buy high entry.
I will watch this for the fade from the parabolic move
to take a short or put option.
NASDAQ:NERV

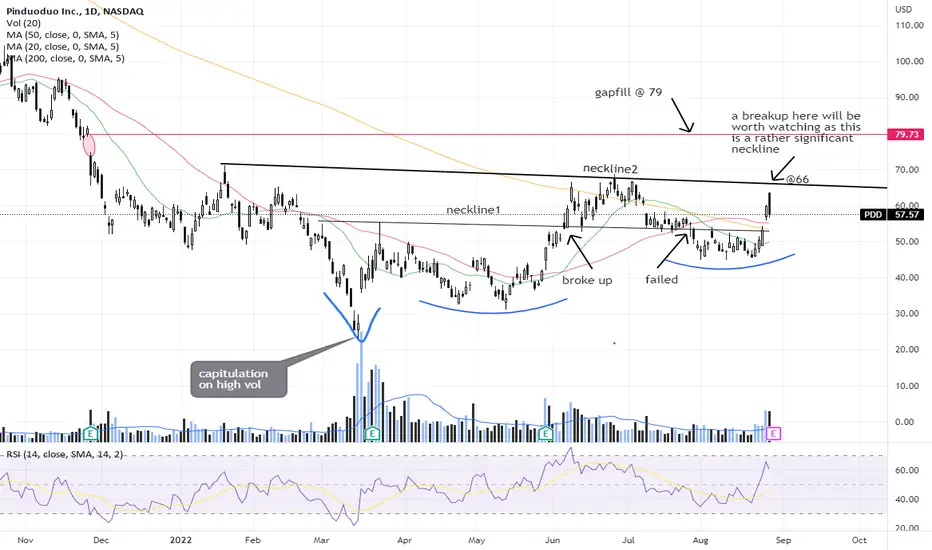
PDD - will it breakup soon?PDD had an earlier breakup of an Adam & Eve formation (@ neckline1) that subsequently failed. It is now approaching a more significant neckline (neckline2) and the earnings that is expected out soon could give a clue if the worst over and if the stock is on the way to propel higher, especially if it could continue to hold above the 200 day Moving Average. Let's see!
Disclaimer: Just my 2 cents and not a trade advice. Kindly do your own due diligence and trade according to your own risk tolerance and don't forget that money management is important! Take care and Good Luck!
Last stand for BTC BullsThere is a lack of a clear impulsive structure to the upside which makes it difficult to clearly say whether or not the price action is bullish or bearish . This is the only real bullish count that would pave the way for new all time highs. If we assume that ~17,500 was the bottom then we are looking at an impulse in minor 1 a complex correction in minor 2 and a three of three extension in wave ((i)) of 3. The price rejected at 24,666 which is the 1.618 of W in the bearish count so in order to consider this current move a wave 3 we would need to see that pivot get cleared. Price below 20,670 will invalidate the bullish impulse since wave (ii) will have retraced >100% of wave (i). It's important to note that the volumes are very low for a wave 3 which casts doubt on the bullish count.

AMST NASDAQ PENNY STOCK on fire SWING LONGNASDAQ:AMST
AMST has been in upward momentum for a few days
after first retesting its support at its consolidation base.
Will it run higher or top out and fade?

GBP/USD: Day Trading Analysis With Volume ProfileOn GBP/USD is nice to see strong buying reaction from the price 1.1807 , there is nice to see strong volume area....
Where is lot of contract accumulated...
I thing that buyers from this area will be defend this long position...
and when the price come back to this area, strong buyers will be push up the market again...
Downtrend + Strong volume area is my mainly reason for this long trade....
Happy trading
Dale

CAD/JPY Day Trading Analysis With Volume ProfileOn CAD/JPY is nice to see strong buying reaction from the price 104.95 and 104.640 , there is nice to see strong volume area....
Where is lot of contract accumulated...
I thing that buyers from this area will be defend this long position...
and when the price come back to this area, strong buyers will be push up the market again...
Uptrend + Strong volume area is my mainly reason for this long trade....
Happy trading
Dale

GBP/USD: Day Trading Analysis With Volume Profile On GBP/USD is nice to see strong buying reaction from the price 1.1909 , there is nice to see strong volume area....
Where is lot of contract accumulated...
I thing that buyers from this area will be defend this long position...
and when the price come back to this area, strong buyers will be push up the market again...
Downtrend + Strong volume area is my mainly reason for this long trade....
Happy trading
Dale

EUR/USD continue with the DowntrendOn EUR/USD is nice to see strong buying reaction from the price 1.00800 , there is nice to see strong volume area....
Where is lot of contract accumulated...
I thing that buyers from this area will be defend this long position...
and when the price come back to this area, strong buyers will be push up the market again...
Downtrend + Strong volume area is my mainly reason for this long trade....
Happy trading
Dale
