is selling being absorbing near 23350 level ?yesterday 27 April I mentioned that nifty must have to break & sustained 23350 level it happened today but long upper wick on hourly time with high volume been noticed showing selling pressure in market of course market bullish momentum still intact it respected the near 23800 level trading above 20 EMA but we need to wait more multiple testing for confirmation to continue upside journey so consolidation may happen in 2-3 days.
Volumespreadanalysis

INTEL DROP --- FIELD COMM LOG #02242025🪖 WAR ROOM DISPATCH — FIELD REPORT FROM CAMP JARVIS & CAMP LIVERMORE
Date: 4/24/2025
Status: STANDBY
Volume: Normal
Current Order: HOLD
⚔️ SUMMARY OF ENGAGEMENTS – LAST 30 DAYS
The battlefield has been blood-red. Abnormal reactions litter the map. Morale was tested—but our troops never broke. The Red Army pushed hard, exploiting weakness, creating chaos. Yet we held.
📍Camp Jarvis
Coordinates: 115.10
☑️ Status: HOLD
📈 Trend: UPTREND
📊 ATR: Tightening (3.39)
🟩 Zone: Top of box: 115.10 | Bottom: 86.62
📢 Latest: “We’re nearing breakout. Position secure. Scouting volume now.”
Jarvis is seeing a shift—momentum is whispering beneath the soil. There's life stirring. But RSI is low (sub-45). This isn't the time for heroes—it’s a time for patience. Let the weak exhaust themselves.
📍Camp Livermore
Position: Natural Reaction Zone
☑️ Status: HOLD
📉 Trend: Weak uptrend but too early to act
🔄 Recent movement: Mixed signals, sporadic action, no confirmation.
Livermore's forces are strong in discipline, but not yet in numbers. They report: “Volume’s stable, but not convincing. We’ll move when the field confirms it—not before.”
📛 INTEL WARNING
The maps are clear—we are not in breakout yet.
There’s a false calm in the air.
Do NOT chase. Do NOT preempt.
This is how armies get slaughtered in the fog.
💡 Key Quote from Command:
“The Red Army still has strength. We’re holding—but holding isn’t winning. We wait for the flinch. The break. The rally cry. That’s when we move.”
🎖️ Current Position: HOLD
🛡️ Camp Jarvis: Monitoring breakout zone
🧭 Camp Livermore: Awaiting troop confirmation
📉 RSI low, Trend early
🔕 No All-Signal-Go confirmed
🚨 Mixed Signals = DO NOT ADVANCE
The war is not over.
But neither are we.

GOOGL 1H Swing Long Conservative Trend TradeConservative Trend Trade
+ long impulse
+ 1H / 1D level coincide
+ T2 level
+ support level
+ biggest volume 2Sp-
Calculated stop limit
1 to 2 R/R take profit
Daily Trend
"+ long impulse
+ JOC test / T2 level
+ support level
+ 1/2 correction"
Monthly Trend
"+ long impulse
+ T2 level
+ support level
- before 1/2 correction"
Yearly Trend
"+ long impulse
- T1 level
- resistance level"

OGKB 5M Investment Aggressive CounterTrend TradeAggressive CounterTrend Trade
- short impulse
+ biggest volume T1 level
+ biggest volume 2Sp-
+ weak test
+ first bullish bar close entry
Calculated affordable stop limit
1/2 yearly level take profit at 0.459
1H Counter Trend
"- short impulse
+ biggest volume TE / T1 level
+ support level
+ volumed 2Sp-"
1D Trend
"+ long impulse
+ JOC level
+ support level
+ 1/2 correction
+ volumed manipulation"
1M Trend
"+ long impulse (in 1d 4h)
+ neutral zone"
1Y CounterTrend
"""- short impulse
+ 2Sp-
+ perforated support level"""

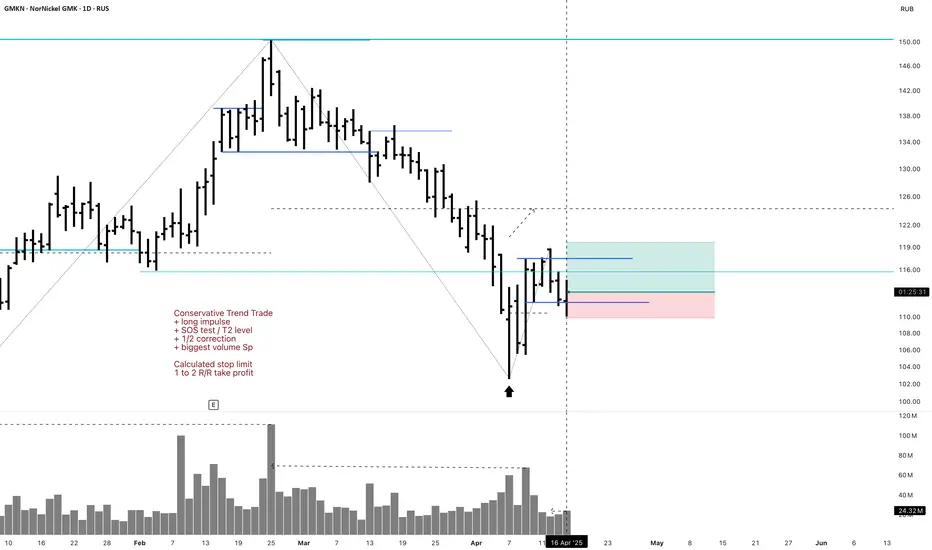
GMKN Long 1D Investment Conservative Trend TradeConservative Trend Trade
+ long impulse
+ SOS test / T2 level
+ 1/2 correction
+ biggest volume Sp
Calculated stop limit
1 to 2 R/R take profit
Monthly Trend
"+ long impulse
- SOS reaction bar level
+ 1/2 weak correction"
Yearly Trend
"+ long impulse
- below SOS
+ 1/2 correction"
Are getting strong 4 long lol??✅ Summary of Top-Down Analysis:
🟢 Daily (Macro Bias):
Bias: Neutral → Leaning Bullish
Context:
MACD and price both made lower lows (convergence = no divergence, but momentum weakening).
Price hit strong support at 16,457.
Bullish close post-FOMC + macro catalyst (Trump’s tariff changes) = positive sentiment.
Key note: China-specific tariff at 125% could inject volatility, possibly sector-specific.
🟠 4HR:
Bias: Bullish
Confluence:
Higher high in price and MACD = bullish momentum confirmed.
Price reclaimed structure after failed low.
Approaching last week's POC → possible liquidity grab + continuation.
4HR bullish imbalance could be a key reaction zone (support).
🔴 1HR:
Bias: Bullish
Context:
Clear bullish structure + MACD higher high.
Aligned with 4HR bullish flow = continuation potential.
🔵 15min:
Bias: Bullish
Micro Context:
Structure and MACD aligned → price above previous NY POC = showing strength into next session.
May look to use NY POC or VWAP pullbacks for entry.
🎯 Gameplan Suggestions:
Scenario 1 – Continuation Entry:
Look for pullbacks into 4HR imbalance zone or 15m demand + VWAP area.
Use MACD + price action confirmation for entry (e.g., engulfing, break of lower highs).
Targets: swing high above 4HR structure + liquidity zones.
Scenario 2 – Reversal Risk:
If price shows exhaustion near last week’s POC, especially with MACD divergence on lower timeframes → consider a quick short scalp or stay flat until new structure forms.
👀 Key Levels to Watch:
🔹 16,457 = macro support
🔹 Last week’s POC = near-term resistance/liquidity
🔹 Bullish 4HR imbalance zone (mark this for entries)
🔹 Previous NY POC / VWAP area = short-term entry pullback zone

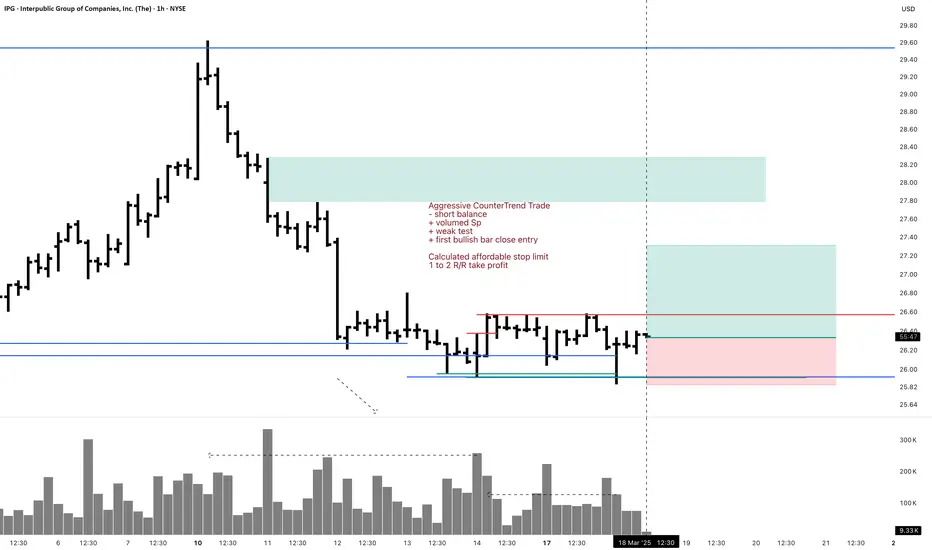
IPG 1H Swing Long Aggressive CounterTrend TradeAggressive CounterTrend Trade
- short balance
+ volumed Sp
+ weak test
+ first bullish bar close entry
Calculated affordable stop limit
1 to 2 R/R take profit
Day CounterTrend
"- short balance
+ support level
+ volumed expanding ICE level"
Month CounterTrend
"- short impulse
+ support level
+ T1 level
- before 1/2 correction"
Year Trend
"+ long impulse
- correction"
POSI 1H Investment Long Aggressive Trend TradeAggressive Trend Trade
- short impulse
+ exhaustion volume
- resistance level
+ long volume distribution
Calculated affordable stop limit
1/2 1M take profit
1D Trend
"+ long impulse
+ support level
+ T2 level?
+ 1/ 2 correction
+ weak approach"
1M Trend
"+ long impulse
+ 1/2 correction
+ biggest volume expanding T1
+ support level
+ biggest volume manipulation"
1Y Impulse
+ long impulse

POSI 1H Swing Long Conservative Trend TradeConservative Trend Trade
+ long impulse?
+ exhaustion volume
+ support level
+ long volume distribution
Calculated affordable stop limit
1/2 1M take profit
1D Trend
"+ long impulse
+ support level
+ T2 level?
+ 1/ 2 correction
+ weak approach"
1M Trend
"+ long impulse
+ 1/2 correction
+ biggest volume expanding T1
+ support level
+ biggest volume manipulation"
1Y Trend
+ long impulse

F 1H Swing Long Conservative Trend TradeConservative Trend Trade
- long impulse
- volumed T2
+ support level
+ 1/2 correction
+ biggest volume Sp
Calculated affordable stop limit
1 to 2 R/R take profit
Day Trend
"+ long impulse
+ 1/2 correction
- neutral zone
- context direction short"
Month CounterTrend
"- short impulse
+ 1/2 correction
- unvolumed T1
+ support level
+ long volume distribution
+ biggest volume manipulation"
Year Trend
"+ long impulse
+ volumed T2 level
+ volumed 2Sp+
+ 1/2 correction
+ weak test"

F 5M Daytrade Long Aggressive Trend TradeAggressive Trend Trade
- short impulse
+ volumed TE / T1 level
+ support level
+ long volume distribution approach
+ biggest volume 2Sp+
- no test
Calculated affordable stop limit
1 to 2 R/R take profit before 5M T2
Hour Trend
"- long impulse
- volumed T2
+ support level
+ 1/2 correction
+ biggest volume manipulation"
Day Trend
"+ long impulse
+ 1/2 correction
- neutral zone
- context direction short"
Month CounterTrend
"- short impulse
+ 1/2 correction
- unvolumed T1
+ support level
+ long volume distribution
+ biggest volume manipulation"
Year Trend
"+ long impulse
+ volumed T2 level
+ volumed 2Sp+
+ 1/2 correction
+ weak test"

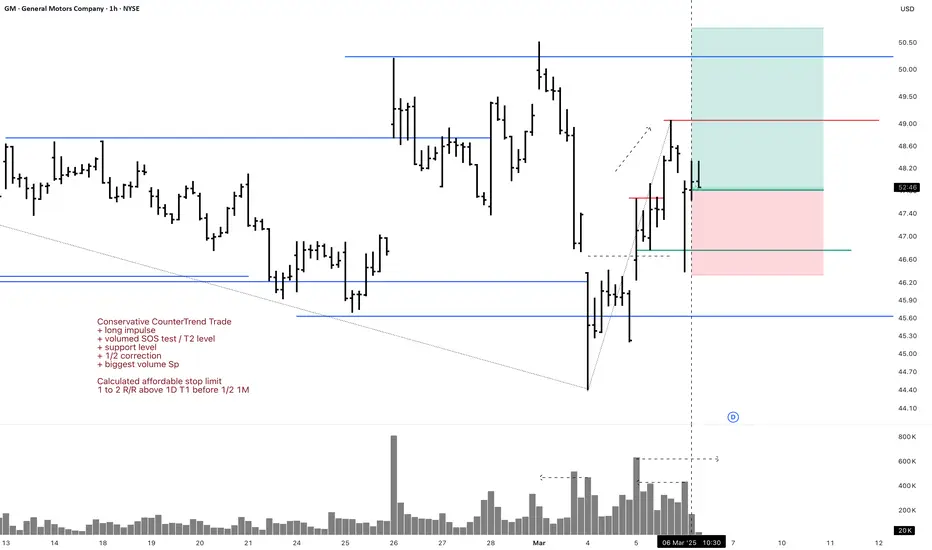
GM 1H Long Swing Conservative CounterTrend TradeConservative CounterTrend Trade
+ long impulse
+ volumed SOS test / T2 level
+ support level
+ 1/2 correction
+ biggest volume Sp
Calculated affordable stop limit
1 to 2 R/R above 1D T1 before 1/2 1M
Daily CounterTrend
"- short balance
- unvolumed expanding T1
+ volumed 2Sp+
+ test"
Monthly Trend
"+ long impulse
- below 1/2 correction
+ SOS test level?"
Yearly Trend
"+ long balance
- neutral zone"
Will add more if 5M corrects to 1/2 or 1H doest weak test and resumes buying
GM 5M Long Conservative Trend TradeConservative Trend Trade
+ long impulse
+ SOS level
+ support level
+ 1/2 correction
+ Sp
Calculated affordable stop limir
1 to 2 R/R take profit
1H Trend
"+ long impulse
+ volumed SOS test / T2 level
+ support level
+ 1/2 correction
+ biggest volume Sp
+ weak test
+ first buying bar closed"
1D CounterTrend
"- short balance
- unvolumed expanding T1
+ volumed 2Sp+
+ test"
1M Trend
"+ long impulse
- below 1/2 correction
+ SOS test level?"
1Y Trend
"+ long balance
- neutral zone"

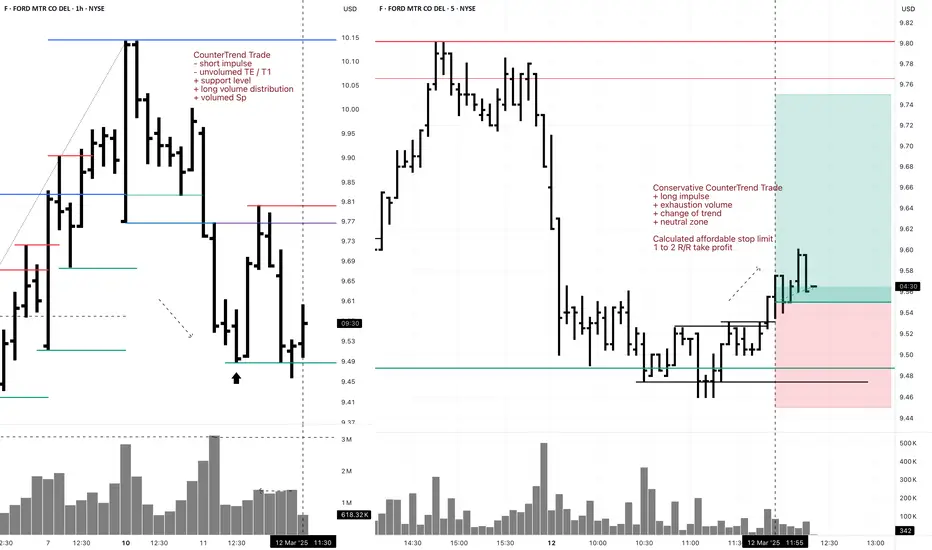
F 5M DayTrade Long Conservative CounterTrend TradeConservative CounterTrend Trade
+ long impulse
+ exhaustion volume
+ change of trend
+ neutral zone
Calculated affordable stop limit
1 to 2 R/R take profit
1H CounterTrend
"- short impulse
- unvolumed TE / T1
+ support level
+ long volume distribution
+ volumed Sp"
1D CounterTrend
"+ long impulse
- biggest volume on correction
- below SOS test level
- below support level
+ 1/2 correction"
1M Trend
"- short impulse
+ 1/2 correction
- unvolumed T1
+ support level
+ reverse volume approach
+ volumed manipulation"
1Y Trend
"+ long impulse
+ volumed T2 level
+ volumed 2Sp+
+ weak test"
F 5M Daytrade Conservative CounterTrend TradeConservative CounterTrend Trade
+ long impulse
+ T1 level
+ support level
+ 1/2 correction
+ volumed 2Sp-
Calculated affordable stop limit
1 to 2 R/R take profit
1H Countertrend
"- short impulse
- unvolumed TE / T1
+ support level
+ long volume distribution
+ volumed Sp
+ test"
1D Trend
"+ long impulse
- biggest volume on correction
- below SOS test level
- below support level
+ 1/2 correction"
1M CounterTrend
"- short impulse
+ 1/2 correction
- unvolumed T1
+ support level
+ reverse volume approach
+ volumed manipulation"
1Y Trend
"+ long impulse
+ volumed T2 level
+ volumed 2Sp+
+ weak test"

PFE 1H Long Swing Conservative Trend TradeConservative Trend Trade
+ long impulse
+ SOS level
+ support level
+ 1/2 correction
+ biggest volumed Sp
Calculated affordable stop limit
1 to 2 R/R take profit before 1/2 of the Month
Expandable to 1/2 of the Year
Daily Trend:
"+ long impulse
+ neutral zone
+ close to 1/2 correction"
Monthly CounterTrend
"- short balance
+ unvolumed expanding ICE
+ volumed 2Sp-
+ weak test"
Yearly Trend
"+ long impulse
+ 1/2 correction
+ exhaustion volume?"
Will add more if corrects to 1/2 of 1H wave.

MRK 5M Long Investment Aggressive CounterTrend TradeAggressive CounterTrend Trade
- short impulse
+ exhaustion volume
+ volumed T1
+ volumed 2Sp-
+ weak test
+ first bullish bar closed entry
Calculated affordable stop limit
1/2 1M take profit
Hourly CounterTrend
"- short impulse
+ 1D SOS level"
Daily Trend
"+ long impulse
+ SOS level
- before 1/2 correction"
Monthly CounterTrend
"- short impulse
+ 1/2 correction
+ exhaustion volume?"
Yearly Trend
"+ long impulse
+ 1/2 correction
+ exhaustion volume?"

F 5M Long Conservative Trend DayTrade Conservative Trend Trade
+ long impulse
+ SOS level
+ 1/2 correction
+ support level
+ biggest volume 2Sp+
Calculated affordable stop limit
1D T2 take profit
1H Trend
"+ long impulse
- before 1/2 correction
+ SOS test level"
1D Trend
"- short impulse
+ exhaustion volume
+ volumed TE / T1 level
+ biggest volume 2Sp+
+ test"
1M CounterTrend
"- short impulse
+ 1/2 correction
- unvolumed T1
+ support level
+ reverse volume approach
+ volumed manipulation"
1Y Trend
"+ long impulse
+ volumed T2 level
+ volumed 2Sp+
+ weak test"

Bullish behaviour on NEM stockThe price of Newmont Corporation shares retraced to the areas where professional buying took place in the past (blue rectangles). The volume during that move down is decreasing, which, according to Volume Spread Analysis (VSA), is bullish behaviour.
Also, given that today's bar penetrates the recent demand zone and the professionals were buying there again, this stock looks very strong and has a high chance of reversal.
Closing above the $43.72 level followed by its testing on daily or lower (1H, 15 minutes) timeframes might start the rally towards $55.13 - $55.89 with resistance around $49.27 - $50.12.
If today's bar is tested and supply reappears during this process, we may expect an extension of the ongoing correction to the $37.53 - $38.37 area and another surge of buying there.

MGNT 1H Long Investment Conservative Trend TradeConservative Trend Trade
+ long impulse
+ SOS level
+ 1/2 correction
+ volumed 2Sp-
- day will close without test
Calculated affordable stop limit
1/2 1M take profit
Daily Trend
"+ long impulse
+ SOS test / T2 level
+ support level
- strong approach from volume zone
+ biggest volume manipulation"
Monthly Trend
+ long impulse
+ expanding biggest volume T2
+ support level
+ 1/2 correction
+ unvolumed 2Sp-
+ strong buying bars
+ weak selling bar / test
Yearly no context

Ford 1D Investment Aggressive CounterTrend TradAggressive CounterTrend Trade
- short impulse
+ exhaustion volume
+ 1/2 correction
Calculated affordable stop limit
Take profit:
1/3 to 1/2 Month Trend
1/3 to Month T2
1/3 to Year 1/2
Sell F Limit at $14.95 (Good 'til Canceled)
Sell F Limit at $11.57 (Good 'til Canceled)
Sell F Limit at $10.21 (Good 'til Canceled)
Monthly CounterTrend
"- short impulse
+ 1/2 correction
- unvolumed T1
+ support level
+ reverse volume approach
+ volumed manipulation"
Yearly Trend
"+ long impulse
+ volumed T2 level
+ volumed 2Sp+
+ weak test"

Strength on HPQ ChartHP Inc., stock approaches the bottom of the sideways channel (black horizontal lines) from which it may bounce again.
During the May 29, 2024 bar, professionals bought (blue rectangle), and since then, whenever the price reached this zone, they were buying more.
It should be noted that the buying around the bottom of the sideways is much bigger than the selling around its top which is bullish behaviour. Wyckoff's Spring on the recent activity adds to strength too. Another good sign for bulls is the decreasing volume on the down move, which indicates an absence of professional interest in lowering prices.
The testing process is ongoing as of today. If the price reaches the buying zone and no supply reappears, there is a big probability for a move up towards $37.30 - $ 39.29 with minor resistance around $34.62 - $34.72.
If supply reappears and the price breaks the bottom of the sideways channel ($32.41) we may see another leg down to $29.00 - $30.00 for more buying.

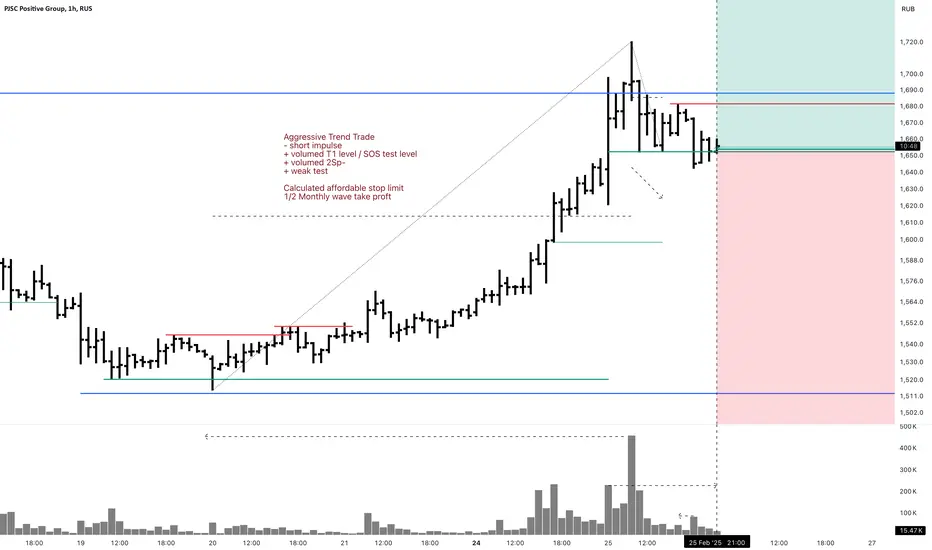
POSI 1H Investment Aggressive Trend TradeAggressive Trend Trade
- short impulse
+ volumed T1 level / SOS test level
+ volumed 2Sp-
+ weak test
Calculated affordable stop limit
1/2 Monthly wave take profit
Daily Trend
"+ long impulse?
- resistance level
- short volume distribution"
Monthly Trend
"+ long impulse
+ 1/2 correction
+ volumed expanding T1
+ support level
+ biggest volume manipulation"
Yearly Trend
+ long impulse
Weird set up. Market is strong and Monthly look a lot like exhaustion!