Nasdaq: The Rally Continues!The Nasdaq ended last week with strong upward momentum, moving swiftly toward the resistance at 20,694 points. Now it's getting interesting: once the index breaks above this mark, it should quickly enter our upper turquoise Target Zone (coordinates: 21,751 – 22,425 points), where we expect the peak of wave X in turquoise. Afterward, we anticipate a pullback during wave Y, which should aim for our lower turquoise Target Zone (coordinates: 17,074 – 15,867 points). The corrective magenta wave (4) should be completed there. However, if the Nasdaq directly surpasses the significant resistance at 23,229 points, our alternative scenario will take effect. In this 35% likely case, we would consider wave alt.(4) as already complete and locate the index in the impulsive wave alt.(5) .
Waveanalyses

Adobe: Keep It Up!Adobe has steadily advanced upward within our beige Target Zone between $331.93 and $449.61, moving away from the low of the beige wave x, which thus gained further confirmation. The stock should soon fight its way out of this zone and head for the resistance at $640. The ongoing wave y should eventually extend significantly above this mark to complete the corrective upward movement of the blue wave (b) there.

Cardano: Low Ahead!According to our primary scenario, Cardano's ADA coin should imminently pull back toward the support at $0.31 to finally complete the blue wave (ii). With this low in place, we see the altcoin breaking out above the resistance at $1.32. If the price manages to rise above this mark without forming a new low first (33% likely), we will have to assume that wave alt.(ii) in blue is already complete.

Tesla: More Room in Wave 4With the recent increases, TSLA approached the more significant local high from early April. Although we locate the price in a turquoise downtrend impulse, the internal corrective upward move of wave 4 still has some more room. With the following wave 5, the stock should then fall below the support at $215.01 to complete the magenta wave (3), which is also part of a downtrend impulse. Meanwhile, our alternative scenario suggests a much faster progression. We consider it 27% likely that with the low on April 7, the blue wave alt.(II) and thus the major corrective movement have already ended. In this case, the path would be clear for a new uptrend of the blue wave alt.(III), which would lead to increases above the resistance at $488.50. Primarily, however, we expect the corrective movement to conclude at a later time and at lower levels.

Palo Alto Networks: Countermovement or Breakout?Palo Alto has faced increasing upward pressure and has been noticeably pushed higher. Thus, the stock is ogling our alternative scenario, which envisions a direct breakout above the resistance level at $207.24. In this 30% likely scenario, we would attribute the last low to the beige wave alt.IV and prepare for a new high of the blue wave alt.(I). Primarily, however, we classify the recent gains as a countermovement and locate the stock already in the bearish blue wave (II), which should settle its low within the blue Target Zone between $104.74 and $55.73; prior to that, the price must fall below the support at $130.04. After the wave (II) low, a new (wave (III)) uptrend should begin and eventually lead to new all-time highs above $207.24.

PayPal: Slight Recovery!In recent days, PYPL shares showed a significant recovery, raising the central question of whether the price will indeed dive into deeper territories once more, as assumed in our primary scenario. In this case, we expect the stock to fall below the support at $50.18. There, the stock should form the final low of the overarching beige wave II, thus laying the foundation for a sustainable trend reversal. Alternatively, the overarching low may have already been settled at the beginning of the month. In this 45% likely scenario, the recovery would imminently gain momentum, allowing PYPL to sustainably rise above the resistance levels at $78.86 and $94.97.

Solana: More RoomSolana’s countermovement of the green wave 4 has some more room on the upside. Once the wave-4-top is established (below the resistance at $192.33), we primarily anticipate a wave 5 sell-off down into the blue Target Zone on the downside (coordinates: $56.56 – $29.87). In this range, the wave (ii) corrective movement should conclude, and the altcoin should start the next sustainable upward impulse. However, if the price rises above the mentioned $192.33 mark during the current upward movement (36% likely), this will suggest that the low has already formed via wave alt.(ii) in blue.

Curaleaf: Target Zone in SightIn small steps, the CURA stock continues to move upward – however, we primarily interpret these movements as the internal structure of the downward wave v in orange. Therefore, the final low of this wave should soon be marked within the orange Long Target Zone between C$0.82 and C$0.37. Upon completion of wave v, the overarching wave II in beige should also end. Once this foundation is laid, a long-term upward movement should begin – initially driven by wave 1 in turquoise, which should carry the price above the resistance at C$4.93.

Dow Inc.: Low in PlaceDow Inc. managed to hold and respond well within our active Target Zone(s) between $35.93 and $22.83 at the relevant Fibonacci levels. We currently assume that wave (II) in blue has been successfully completed, which leads us to anticipate a rise above the two indicated resistance levels ($55.67 and $71.86). Our zones remain active and could still be used for entering long positions. However, it should be noted that the price range could be tested further, and a completely new low is even possible under our alternative scenario: this wave count outlines a significantly stronger setback with the blue wave alt.(II), which would mean breaking through our dark green-blue Target Zones (probability: 35%).

Miniso: Holding SteadyMNSO showed little volatility last week, recording only minor single-digit percentage pullbacks. Still, we expect further downside ahead. As the decline continues, the stock should reach the green Target Zone between $9.90 and $7.33. Within that range, we anticipate the low of the green wave . This bottom should then set the stage for a new upward move, which should eventually break above the resistance at $35.22 via a turquoise five-wave structure.

Ripple: Target Zone Ahead!Ripple’s XRP remains on track to reach our magenta Target Zone between $1.03 and $0.38, even though the price has recently settled into another consolidation phase. Under our primary scenario, we expect the bottom of the magenta wave (2) to form within this range. Once that low is confirmed, fresh upward momentum should unfold during the following impulse wave (3), which has the potential to push XRP above the resistance at $3.39 and toward new all-time highs. However, if XRP breaks out to the upside before establishing the projected low within our zone, this zone will be considered void. We currently assign a 38% probability to this alternative scenario.

[BTC/USDT] Wave (4) Completed? Road to $140K Begins HereBitcoin is consolidating just above key support after a textbook correction. The first chart shows a completed Falling Wedge breakout from Wave ④, while the second chart lays out macro Fibonacci targets for Wave (5).
Chart 1 (Daily): Local Breakout Setup
• Falling wedge breakout above 83.9K–84.3K
• Completed structure: Wave ③ → ④ → Potential Wave ⑤
• Invalidation: Below 73.8K or worst-case 69.5K
• Bullish continuation requires break & close above 86K
Chart 2 (Weekly): Macro Target Projections
Using Fibonacci extension from Wave (3), BTC shows:
• 0.618 Target = $114,983
• 1.000 Target = $140,033
• 1.618 Target = $180,560
If current support holds, Bitcoin could be entering a massive Wave (5) cycle with upside potential towards $140K–$180K. Reclaiming levels like $92.5K, $101K, and $106K will confirm the bullish structure.
What’s your Wave 5 target?
#Bitcoin #BTC #BTCUSDT #CryptoAnalysis #ElliottWave #Fibonacci #CryptoTA

Decentraland: Fake Rally?Decentraland reacted significantly to the low of April 7 and temporarily achieved an increase of over 50%. Still, there is a 33% chance that the current corrective movement is not yet complete, and we will see a final setback to a fresh low of the green wave alt. in the short term. Primarily, however, we assume that a sustainable bullish trend reversal and the start of a magenta uptrend quintet have already succeeded. Via the magenta and the subsequent interim correction of wave , MANA should now gather momentum for the impulsive breakout of the magenta wave above the two resistance levels at $0.59 and $0.85.

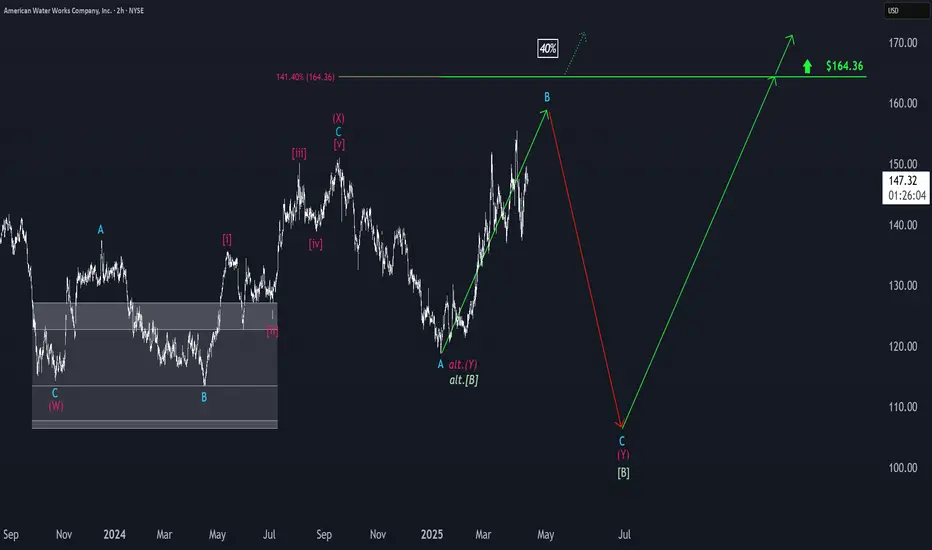
American Water Works: Toward the B-Wave TopPrimarily, American Water Works is still working on the turquoise wave B, which should top out below the resistance at $164.36. The subsequent sell-off of the turquoise wave C should then complete the overarching wave in green. However, in our 40% likely alternative scenario, the stock would directly surpass the $164.36 level, thus confirming an already established low of the green wave alt. . Still, structurally, renewed rises of wave should follow after the wave low in both of these scenarios.
CRWD: in main resistance for one more leg down Price has now reached an ideal resistance zone, aligning with the 2024 summer top, where a bounce (wave B) is to complete itself.
As long as price remains below the 425 level, I see the odds favoring another leg lower, targeting the macro support zone around 300–270.
Thanks for your attention and best of luck with your trading!

Caterpillar: Progress!Caterpillar has successfully fallen below the $318.68 level, marking an important step in our primary scenario. There is a 32% probability that we have already seen the low of wave alt.IV in beige, which would allow the price to move directly above the resistance at $386.48 from here. However, due to the price structure, we assume that the regular wave IV in beige still requires a new low before the next rise is scheduled. Once this important bottom of wave IV is found, there is ample potential on the upside.

Cronos: Bear Market VibesCronos is resisting the persistent selling pressure after last week's low, but it should soon turn sustainably downward again. We anticipate the imminent bottom of the overarching turquoise corrective wave 2 within the green Target Zone between $0.06 and $0.02. According to our primary scenario, once CRO reaches this new bear market low, it can quickly move upward in the next impulse wave, with the resistances at $0.14 and $0.23 serving at most as temporary pauses.

Canopy Growth: Some Room Left...WEED has continued to move downward within the magenta Target Zone between C$2.96 and C$0.90, and it is now trading in the lower quarter of this range. Currently, the stock should be working on a blue five-wave move and should soon reach the low of wave (v), thus completing this structure and also the large green wave . Primarily, we still grant the stock some more room to fully utilize the Target Zone, but a trend reversal should be initiated with the low. Afterward, the high from April 29, 2024, at C$20.50 should be exceeded during the turquoise wave 1.

Cardano: New Low or Off We Go?!For Cardano, we primarily still expect a new low in the blue wave (ii), but the price should stay above the support at $0.31. Once the wave (ii) corrective movement is completed – which theoretically could have already happened – the blue wave (iii) should drive the price significantly above the resistance at $1.32.

SUI: Toward All-Time Low?SUI broke the support at $1.97 and tested it once again from below with yesterday's brief countermovement. It should now proceed downward so that the turquoise corrective wave 2 can be properly completed. Subsequently, the turquoise impulse wave 3 should provide new upward momentum, racing toward new all-time highs. The resistance at $5.36 should only be a milestone.

Innovative Industrial Properties: Low AheadThe stock of Innovative Industrial Properties managed to stabilize somewhat at the upper edge of our green Target Zone (coordinates: $53.48 – $16.80) but should soon initiate the next downward impulse. In the short term, we expect a final corrective movement deeper into our green Target Zone to establish the low of the overarching wave in green. Once the wave low is settled, the impulsive wave in green should take over and carry the stock beyond the resistance at $137.90.

SOL (Weekly timeframe): Trend structure Price is approaching a key macro support zone. However, as long as it remains below the $148 level, I cannot rule out the possibility of one more corrective leg toward the $76–$55 range before a medium-term bottom is established and a potential resumption of the broader uptrend begins.
A breakout and sustained close above the $148 level would serve as the first technical signal that either:
- a corrective wave B (preceding a deeper correction toward the macro support zone) is unfolding, or
- a new long-term bullish trend aiming for all-time highs is beginning.
Monthly outlook:
My previous idea from November 2024 has fully realized its structure:
Thanks for reading and wishing you successful trading and investing decision!

LTC/USDT: at important resistance Until the price closes below 100, the current trend structure suggests a one more leg down toward the 76–70 macro support zone.
However, if the price successfully clears the 100 resistance level - rising and closing above it with strong volume - the odds will shift in favor of a correction ending and the potential start of a new uptrend toward the 210–270 macro resistance zone.
Macro-structure:
Thank you for your attention!
