XAI: Bullish Idea#XAI saw a steep fall from Mar 2024 until last month, followed by a solid rebound. It’s now forming a strong long-term setup with high upside potential.
Holding above $0.039 keeps the idea valid (stop-loss).
Passing $0.435 confirms a flourishing futureon the HTF.
#Xai
Wave Analysis

Azul Brazilian Airlines S.A Stock on inverse head and shoulders pattern
Target price upto 1 $ on Chart
Buy it now 🔥

Bitcoin on Bollinger Band touch the Bottom?📝 Bitcoin is currently testing the baseline of the Bollinger Bands, which historically indicates that the sideways phase is nearing its end.
📉 Volatility is stabilizing, and the market structure is tightening—this often precedes a significant new move.
💡 The next big trend is on the horizon. Will it be an explosive breakout or a controlled rally like in 2021? I'm leaning more toward gradual growth, what do you think?

EUR-CAD Will Keep Falling! Sell!
Hello,Traders!
EUR-CAD is going down
Now and the pair broke
The rising support line
Made a retest and is going
Down again now so we are
Bearish biased and we will
Be expecting a further
Bearish move down
Sell!
Comment and subscribe to help us grow!
Check out other forecasts below too!
Disclosure: I am part of Trade Nation's Influencer program and receive a monthly fee for using their TradingView charts in my analysis.

XAU/USD (Gold) Analysis 2/5/20251. XAU/USD recently recorded an all-time high (ATH) at the 3150 level.
2. Following a healthy retracement, we are now eyeing potential long opportunities near the 3100 zone.
3. The 3100 level presents a favorable risk-reward entry point, aligned with historical support.
4. Market sentiment remains bullish, supported by strong fundamentals and ongoing geopolitical tensions.
5. A breakout above the previous ATH could open the door for a continued rally toward higher resistance levels.
6. Our upside targets for this move are in the range of 3450 to 3500, offering considerable profit potential.
7. Price consolidation near 3100 indicates accumulation, reinforcing the long bias.
8. We anticipate renewed buying pressure as the market tests key psychological and technical levels.
9. Risk management will be crucial, with stops ideally placed just below the 3050 support region.
10. Overall, this setup offers a compelling long trade backed by technical structure and market momentum.

Wave Count Suggests One More Push Higher Toward 196GBPJPY is unfolding a clear 5-wave impulsive structure from the April low. Current price action suggests we are in a wave (iv) correction of the larger wave (C). The substructure shows:
Wave (i), (ii), (iii) are complete
Wave (iv) is developing as an ABC flat or zigzag
Wave (v) still expected to complete wave (C) higher
What to Watch:
The correction may dip toward the 190.50–189.50 support zone before completing wave (c) of (iv)
From there, potential bullish continuation toward 196.00 to complete wave (v) of (C)
Trade Idea (Not Financial Advice):
If price confirms a reversal from the lower support box, long entries could target the upper box near 196.00. Invalidation would be a break below the April low.
#ElliottWave #GBPJPY #ForexAnalysis #WaveCount #JPY #GBP #ICMarkets

Buy Trade Strategy for PENGU: Riding the Meme Token Momentum
Description
This trading idea focuses on **PENGU**, an emerging meme-based cryptocurrency gaining popularity through community engagement, viral marketing, and its strong presence across social media platforms. As seen with other meme tokens, **PENGU** thrives on cultural relevance and grassroots enthusiasm, which often translate into sudden surges in visibility and trading volume. While it may not have the same level of technical utility as other projects, its strength lies in branding, community loyalty, and its potential to attract new users to the crypto space.
Nonetheless, it’s essential to recognize that meme coins are highly speculative by nature and are driven more by market sentiment and hype than by traditional fundamentals. This makes them especially volatile and susceptible to rapid changes in price and popularity.
**Disclaimer**:
This trading idea is for educational purposes only and does not constitute financial advice. Investing in cryptocurrencies like **PENGU**, particularly meme tokens, involves high risk and could lead to significant financial loss. Always perform your own research, understand your risk tolerance, and consult with a licensed financial advisor before making investment decisions. Past performance does not guarantee future results.

#LTCUSDT: On The Way To $200, Get Ready For Swing Buy! Hey there!
Evening Everyone,
The price of this crypto is currently in a bullish formation, and it looks like it’s on the rise, potentially reaching $200. The best thing you can do is wait for the price to break out of the downtrend and then keep going up. You could set a target at $150 and then $200, which would be a swing move.
Good luck and trade safely! 😊
Thanks a bunch for your unwavering support! ❤️🚀
If you’d like to lend a hand, here are a few ways you can contribute:
- Like our ideas
- Comment on our ideas
- Share our ideas
Cheers,
Team Setupsfx_

Xauusd buyBuying gold , it's just signal for you ,enjoy and make money , do anylisis and learn ,gold was good today we hit 400 pips in 2 trades ,

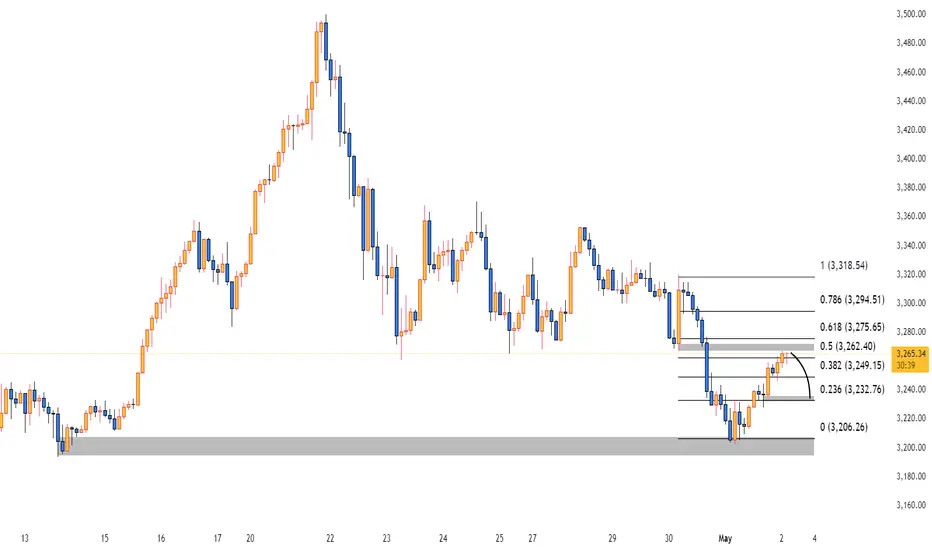
XAUUSD Analysis🟡 XAUUSD Analysis – May 2, 2025
Chart Overview:
Price is reacting near the 0.5–0.618 Fibonacci retracement zone (~3262–3275), a key supply area.
A bearish rejection candle is forming at 3264.51, showing resistance.
The projection curve on the chart suggests a potential pullback to the 0.236 (3232.76) or even 0 (3206.26) level.
🧠 Fundamental Catalyst (Today’s NFP):
If the NFP comes out weak (138K or lower) as expected:
USD may weaken → gold could break above 3275 and aim for 3294 or higher.
If NFP beats expectations significantly (e.g., above 200K):
Strong USD → This bearish setup could play out → Gold may drop toward 3232 or 3206.
📉 Signal (Short-term idea):
Bias: Bearish below 3275
Entry: Sell near 3265–3275 (supply zone)
TP1: 3232
TP2: 3206
Equity Research Report – TIMKEN India Ltd 📌 CMP (May 2, 2025): ₹2,728
🧭 Sector: Industrial Bearings & Motion Solutions
📈 Signal: Breakout from falling channel with strong volume confirmation
🔹 Technical Summary
Breakout Pattern: Price has decisively broken out of a long-term falling channel after a 10-month downtrend.
Volume Spike: Breakout accompanied by significant volume spike (highest in over a year) – strong institutional interest.
Momentum: RSI has broken above resistance line (~55), confirming bullish momentum.
🧭 Trade Setup
✅ Buy Zone (Swing Trade/Positional)
Buy Above: ₹2,750
Target 1: ₹2,900
Target 2: ₹3,050
Target 3: ₹3,280
Stop-Loss: ₹2,490 (just below recent breakout candle)
Timeframe: 2–6 weeks
Risk-Reward Ratio: ~1:2.5 (good for swing setups)
🚫 Invalidation Level:
Breakdown and close below ₹2,490 on weekly timeframe.
For Education purposes only

Can ETH Really Hit $80K? Adoption Trends and Technicals Say, YESEthereum’s adoption is booming in 2025, with over 50 major enterprises building on its network, a 21.7% global crypto ownership share, and $102 billion in stablecoin volume. Daily transactions hit $13.74 billion, and new addresses doubled to 200,000 in January 2025. The 3W chart shows ETH at $1,859.1, oversold (Stochastic RSI -101.5), hinting at a potential bounce. A 43x increase to $80K would need a $40 trillion market cap—steep but not impossible given historical 400x growth (2016–2021). Layer 2 scaling and ETF inflows support the bull case, but competition from Solana and privacy concerns could hinder the journey. What do you think? Or am I just insane?

Analysis of the latest gold trend on May 2:
Key technical signal confirmation
Trend break: 4-hour chart confirms breaking below the bottom of the 3270-3260 box, 1-hour moving average dead cross (such as MA5 crossing MA20), short momentum increases.
Resistance conversion: The previous support 3260-3270 (trading concentration area) turns into strong resistance, and a rebound to this point can be regarded as a short-selling opportunity.
Weakness sign: If the rebound cannot reach 3260, it indicates that the market is extremely weak and may accelerate the decline.
Today's operation strategy
Short opportunity
Ideal short-selling area: 3260-3270 (reverse pressure position after the box breaks), stop loss set above 3280, target down to 3220→3200.
Aggressive short-selling: If the price rebound is weak, enter the market in batches at 3245-3255 (1-hour moving average suppression area), stop loss 3265, target the same as before.
Long positions should participate cautiously
Short-term rebound only: If the support of 3190-3200 is touched for the first time (previous low of the daily line or Fibonacci retracement level), a light position can be used to rebound, with a stop loss of 3180 and a target of 3220-3230.
Key points:
First resistance: 3245 (dynamic pressure of 1-hour MA20 moving average)
Strong resistance: 3260-3270 (break conversion position).
Support below:
First target: 3200 (short-term psychological barrier)
Strong support: 3165-3175 (weekly support band).
Market sentiment and risk management
Short sellers dominate: The 4-hour MACD is heavy in volume below the zero axis, and the RSI is below 40. You need to be alert to oversold rebounds but do not blindly buy the bottom.
Data risk: If there is sudden news in the European or US market (such as a pullback of the US dollar or geopolitical conflicts), the stop loss needs to be adjusted flexibly.
Summary: The market is mainly rebounding and high-altitude during the day. The market remains bearish below 3260. Long orders are only used as a quick entry and exit aid. Traders need to confirm the entry timing based on real-time price momentum (such as the 15-minute K-line engulfing pattern) and strictly control their positions.

More potential downsideEveryone is picking bottoms that is dangerous in this environment, this chart is Elliott wave we are at the top of the b-wave and it is considered a bull trap but we could get a v shape and may not get follow through in which case the b-wave becomes a new wave 5. It could go either wave but my bias is we get follow through to the downside but its just an opinion you have to due whats best for you.

Quarterly support for PZZA since 2014 = $28-$38History will repeat it self ?
A. Yes
B. No
On the other hand: "Berkshire Hathaway, added two new stocks to its equity portfolio: Pool Corporation and Domino's Pizza." Not Papa Johns !!!

Correlation Coefficient btw SP500 and PZZA - The relation between SPX and PZZA is at one of the lowest since the IPO !!!
- Yes we could go lower
- RSI and MACD suggest the is it $30ish is our trough land
*** Or this is irrelevant and we crash to 20ish !!!

Simple Technical Analysis for Bitcoin
If the price closes above $69,150, then, God willing, we may head toward the next target at $107,000.
However, if it closes below this level, the likely direction would be toward $84,200.
In my personal view — and God knows best — the chances of a downward move seem higher than an upward one at the moment.

Current ratio, cash ratio and Debit ratio!! Should be consideredNot an expert on this, but these ratios seems to be talked about allot by
financial experts when analyzing companies. In general they mean the
ability of PZZA'S ability to pay its short/long term debits

PZZA Cash & Equivalents very low = Fundamentally bad Yes/No ?According to different figures on line interest payments on debt for PZZA in 2024 will be above FWB:40M !!! Q4 could be $10M !!! $7M will be left on hand !!!
Not a financial advisor/analyst but this thing is so low !!!
Technically is bottoming Vs Fundamentally ( I do not know)

Hurst's 4.5 Year cycles is in "Time wise"=Trough is close or notHurst's Cyclic Theory:
The basic tenant behind this theory is that markets achieve significant lows (or troughs) at the beginning (or end) of a cycle. Cycles have varying degrees based on wave length (in time) and are harmonized with the higher level cycles.
- Blue is 4.5 starting the day of the IPO !!!

US30 shortWhat is a bear market?
A downward market with strong rallies. we are around a turn around area. Positive job data is just hysteria, false confidence.
>Momentum to the upside fading
>lower high on 5 mins
>countertrend!

Non-farm data is released, and gold is still going to fall.
📌 Gold information
Today, the market will usher in the heavy non-farm data for April. From the expected value, there are only 130,000 people, far lower than the expected 228,000 people, and the unemployment rate remains at 4.2%.
If we refer to the unsatisfactory ADP data in April, then the number of non-farm people in April should have declined, or it is lower than expected, but the ADP data cannot fully correspond to the final non-farm data. This is the answer given to us by too many experiences in the past, so it cannot be concluded that the non-farm data this time will be lower than expected.
📊Comment analysis
Combined with the technical aspect, the strong technical pressure above the international gold price is around 3280, and then the 3300 mark. Even if it rebounds next, the pressure of the above two prices cannot be broken, and there is still a probability of a pullback adjustment. The initial support below is 3230, and after breaking through the position, it will follow the trend to explore 3205.
💰Strategy Package
If today's non-agricultural data cannot provide strong support for gold prices, the rise in gold prices in the short term will be difficult to sustain. The specific decision can only be made after the final release of the afternoon data and the guidance on prices. The trend fluctuations tonight will be very intense. Remember to strictly control your positions to prevent risks.
⭐️ Note: Labaron hopes that traders can properly manage their funds
- Choose the number of lots that matches your funds
- Profit is 4-7% of the fund account
- Stop loss is 1-3% of the fund account

CDSL weekly timeframeYou're analyzing the **weekly chart** of **CDSL (Central Depository Services India Ltd)**, and here's a breakdown of the key elements from your chart:
---
### **Chart Overview & Interpretation:**
1. **Current Price**: ₹1,328.20
* Showing a **modest gain of 0.62%** on the week.
2. **Chart Type**: Weekly time frame (1W), good for **long-term trend analysis**.
3. **Support & Resistance:**
* **Strong support zone** near ₹1,150–₹1,155.
* **Resistance zone** around ₹1,900–₹2,000 (marked by top of green box).
* The **target zone** is around ₹2,473.20, suggesting a **long trade setup**.
4. **Trade Setup Observed (Likely Long Position):**
* **Entry Price**: Around ₹1,328.20
* **Stop-Loss**: ₹1,038.05 (red zone)
* **Target**: ₹2,473.20 (green zone)
* **Risk-Reward Ratio**: Roughly 1:3, which is favorable
5. **Trend**:
* After a sharp fall, stock **bounced back from the support level**.
* Shows a **potential trend reversal** or **continuation of the long-term uptrend**.
6. **Indicators (not shown directly but inferred):**
* Price bounced after a pullback → likely some **demand zone**.
* Forming **higher lows**, indicating **bullish structure**.
---
### **Conclusion (Trading View):**
* **Bullish Bias**: Based on the risk-reward setup and bounce from support.
* **Good R\:R Setup**: Entry at ₹1,328 with SL at ₹1,038 and target near ₹2,473.
* Suitable for **swing or positional trading** if broader market supports.
Would you like a clearer chart with technical indicators like RSI or moving averages added?
