BTC Elliott wave analysis 5/3/2025For me , I think the Wave B of the Big 4 is already finished as you can see the clear divergence in 4 hours timeflame and the small wave count is also confirm that the end of wave be should be finish and Wave C is ready to coming down. Since the wave B retraced in the range of 0.618 - 0.8 (weak B) we expect the target for the end of wave C is around 1.272 - 1.382 of wave A (B-Failure flat) or around 68000- 65000.Surpisingly , the price target that we get is the same level as the huge suppot zone in 2024 making the 68000- 65000 target price more likely to be the end of C wave. But we should also think of the alternate scenario that the Big wave 4 is already end in WXYXZ (in the wave A) and the upcoming wave 5 (wave B)is already coming up and hit the resistance and waiting to go higher.
Wave Analysis

Bitcoin BTC Has Started CorrectionHello, Skyrexians!
Hope we understood what is going to happen with the Bitcoin dominance, if briefly we are waiting for correction and this dominance dump will likely happen on BINANCE:BTCUSDT dump.
Let's take a look at the impulse which has been started at $75k, it looks like this impulse has been finished already with the 5 Elliott waves cycle. At the very top we can see the bearish divergent bar and bearish divergence with the Awesome Oscillator. Moreover oscillator started to print red columns, it means that momentum is gone and now it's time to go down.
Best regards,
Ivan Skyrexio
___________________________________________________________
Please, boost this article and subscribe our page if you like analysis!

Summary of the Gold Market This WeekThis week, the gold market showed a clear downward trend, with spot gold accumulating a 2.43% decline.👉👉👉
The economic data had a significant impact on the gold market this week. Data released by the US Department of Labor on the 2nd showed that the non - farm payroll employment in the US increased by 177,000 in April, much better than the expected 138,000, and the growth data for the previous two months were revised downwards. The US unemployment rate was 4.2% in April, in line with market expectations. The strong non - farm payroll data reduced the possibility of the Federal Reserve cutting interest rates in June. Under normal circumstances, the reduction in the interest rate hike expectation should be bullish for gold. However, the gold market did not rise sharply this time, mainly because the gold price had risen significantly in the early stage and the long - term investors had a strong sentiment of taking profits. At the same time, the relatively good employment data also reflected the resilience of the US economy to a certain extent, weakening the appeal of gold as a safe - haven asset. As a result, the gold price did not show an obvious upward trend immediately after the data was released. Instead, it remained volatile in the short term.
From a technical perspective, although the gold price has declined this week, the futures price still has certain technical advantages in the near term. On the daily chart, although a negative candlestick was recorded this week, the previous upward trend has made the moving average system still show a long - term arrangement. From the perspective of the RSI, the current value is hovering around 50, indicating that the market's long and short forces are temporarily relatively balanced, and neither side has an obvious advantage. Therefore, the gold price has entered a consolidation stage.
With the economic development in Asia and the changes in consumers' demand for gold investment and jewelry, Asia's influence in the global gold market has become increasingly prominent. If the demand in Asia remains strong in the future, it will provide strong support for the gold price. On the contrary, if the demand weakens, it may increase the downward pressure on the gold price.
Looking ahead to next week, the gold market still faces many uncertainties. On the one hand, the continuous changes in economic data and the direction of the Federal Reserve's monetary policy remain key factors. If the subsequently released data continue to show the resilience of the US economy, it may further reduce the market's expectation of a rate cut by the Federal Reserve, thereby suppressing the gold price. On the other hand, any new development in the international trade situation may trigger fluctuations in the market's risk - averse sentiment, thus affecting the supply - demand relationship and price trend of gold.

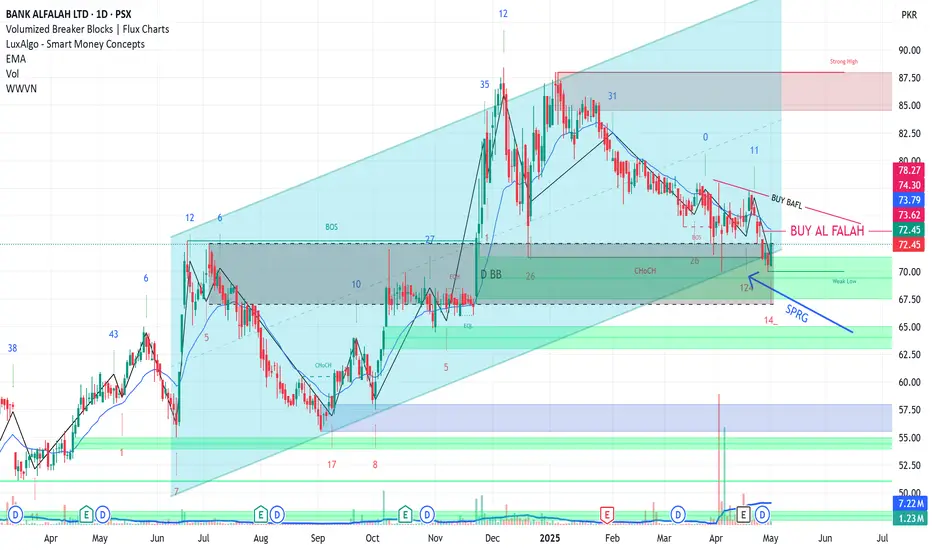
BAFL LONG TRADEBAFL has been in uptrend channel since long
It has touched its bottom and given positive rebound yesterday
It just needs one more green candle confirmation above 73
Buy BAFL if it crosses 73.5
TP 84
SL 68
SSGC LONG TRADESSGC has rebound from trendline, it's continuously in uptrend
Buy SSGC 39-41
TP 44.5
SL 37.9

Bitcoin Range-Bound in Heavy Resistance – CME Gap Still Open!Bitcoin ( BINANCE:BTCUSDT ), like Gold , has been moving in a Range for the past 5-6 days and is currently in a Heavy Resistance zone($95,950-$88,500) , as it has been in the past few days .
In terms of Elliott Wave theory , Bitcoin appears to be completing a main wave 4 . The main wave 4 structure can take two forms: Double Three Correction(WXY)_Expanding Flat(3-3-5) .
I label this analysis " Short " for the following reasons:
Due to Bitcoin's higher correlation with the S&P 500 Index ( SP:SPX ) these days, I am short on the S&P 500 Index.
China’s president Xi Jinping says Trump lied about them having a phone call ; it is NOT good news for the S&P 500 Index and Bitcoin .
CME Gap($92,525-$91,415) has NOT filled yet, and I think Bitcoin will NOT start the next bullish rally before filling the CME Gap.
I expect Bitcoin to drop to at least $92,830 and then decline to the Support zone($92,000-$91,400) if the Support lines are broken.
Cumulative Short Liquidation Leverage: $96,741-$95,520
Note: If Bitcoin can touch $97,000, we should expect more pumping.
Note: If Bitcoin goes below the 100_SMA(Daily), we should expect a fall.
Please respect each other's ideas and express them politely if you agree or disagree.
Bitcoin Analyze (BTCUSDT), 1-hour time frame.
Be sure to follow the updated ideas.
Do not forget to put a Stop loss for your positions (For every position you want to open).
Please follow your strategy and updates; this is just my Idea, and I will gladly see your ideas in this post.
Please do not forget the ✅' like '✅ button 🙏😊 & Share it with your friends; thanks, and Trade safe.

Gold's Symmetrical Triangle Near Break – Support Test Imminent!Gold ( OANDA:XAUUSD ) moved as I expected in my previous post and attacked the Support zone($3,282-$3,245) and Support lines for the second time . The question is, can Gold break the Support zone($3,282-$3,245) and Support lines or not!?
Please stay with me .
Gold is moving between Support zone($3,282-$3,245) and Resistance zone($3,386-$3,357) again . In fact, it can be said that Gold has been moving in a range for the past 5-6 days .
From a Classical Technical Analysis perspective, Gold appears to be forming a Symmetrical Triangle Pattern. A break of either line could indicate the next direction for Gold, but since the Symmetrical Triangle Pattern is a Continuation Pattern , the lower line is more likely to break .
In terms of Elliott Wave Theory analysis , it seems that we still have to wait for the next five downwaves .
------------------------------------------
Today, important U.S. data — JOLTS Job Openings and CB Consumer Confidence — will be released.
Let’s quickly review their potential impact on Gold:
JOLTS Job Openings :
If the number comes lower than expected , it signals a weakening labor market, increasing the chances of a dovish Fed → Bullish for Gold .
If the number is stronger than expected , it indicates a robust labor market, pushing the Fed to stay hawkish → Bearish for Gold .
CB Consumer Confidence :
A drop in consumer confidence reflects economic worries , driving demand for safe-haven assets like Gold → Bullish .
A rise in consumer confidence shows economic strength, reducing the appeal of Gold → Bearish .
Historical Impact :
Both indices have caused strong intraday moves in Gold recently, especially if the figures surprise the market.
Summary :
Weak JOLTS and low Confidence → Gold bullish
Strong JOLTS and high Confidence → Gold bearish
Be prepared for high volatility during the releases. Always manage your risk carefully!
------------------------------------------
I expect Gold to attack the Support zone($3,282-$3,245) and Support lines for at least the third time , and if it breaks, the next target could be $3,223 .
Note: If Gold can move above $3,393, we can expect more pumps and maybe make a new All-Time High(ATH).
Gold Analyze ( XAUUSD ), 1-hour time frame.
Be sure to follow the updated ideas.
Do not forget to put a Stop loss for your positions (For every position you want to open).
Please follow your strategy; this is just my idea, and I will gladly see your ideas in this post.
Please do not forget the ✅' like '✅ button 🙏😊 & Share it with your friends; thanks, and Trade safe.

BTC Elliot Waves I'm looking for at least one more high, but wave III could already reach that level.

NATGAS Resistance Ahead! Sell!
Hello,Traders!
NATGAS is growing sharply
But the price is nearing a
Strong horizontal resistance
Around 3.80$ so after the
Retest on Monday we will be
Expecting a local bearish
Correction as Gas is already
Locally overbought
Sell!
Comment and subscribe to help us grow!
Check out other forecasts below too!
Disclosure: I am part of Trade Nation's Influencer program and receive a monthly fee for using their TradingView charts in my analysis.

BTC Ready to Rally ?Disclaimer on
this is simple strategy that I did base on Bitcoin cycle in the past , seems this one ready to rally, while they hit by good news either from the government, or the big holder, minor correction is healthy, I mean drow down is good for the coin, I predict this one will hit the target around August, might be wrong, but either right,
personal target around 128.000 - 130.000
do your own research

CSAP LONG TRADEAfter its six month long accumulation range, CSAP is pulling back since several days.
It is expected to rebound from recently created buyside Breaker Block
BUY 118
TP 159
SL 104

AUDUSD LOOKING FOR A PULLBACK TO 0.62700 AND PUMP TO 0.685AUDUSD looking for a retarcement to the goldbach FVG zone at 0.62700 and then a impulse to the higher order block to complete the return to origin

On H4 correction not overTimeframe H4:Wave A finished,now wave B.
More correction on wave C if break zone 1.13

USDSGD LONG TO 1.36750 WITH GOLDBACH AND FIB BACKING USDSGD with a clean fib structure and looking to target 0.90 retrace in line with a Goldbach retrace to the higher order block zone

EURUSD UPDATESFX:EURUSD since this new idea are not your typical trades.
I expect the 2021 highs liquidity would be the target on this Run.
Build up method is like a re-accumulation phase then expansion, or it might go lower a bit.
This idea are on higher time frame, base on the 2021 highs liquidity pool.
THis is not a financial advice.
Follow for more swing trades.
Oh hello, Got funded on 5 er s. now. see my X.
slowly but surely trades, trade only small lots if you're a swing trader.
Pewwww

YOUR SEEING THIS NOT BY ACCIDENT (GOLD SWING)
remember this idea before, way early to short right?
Now its the time to short it. initial and 2nd tp zone. probable the swing tp could be 2700-2600 or
lower.
See this a liquidity grab on internal/inside a monthly basis chart.
This is not a random as you see this, it means you trade this for Long shot or swing thot.
Guys this idea is on my self only.
This is not a financial advice.
See you again next week.
The previous news or the ADP NFP are non sense. we a make a new highs again once this idea works?
This is only my view.
sharing this could turn your idea to swing trades.
Follow for more.

“MSTR Bullish Setup Reminder: Watch for Breakout Above $401”✅ Bullish Summary – MSTR Daily Chart
Pattern: Inverse Head & Shoulders (bullish reversal)
Trend: Bullish momentum confirmed by Heikin Ashi candles and EMA alignment
Key Resistance: $401.95 (neckline – breakout trigger)
Support Levels: $372, $347, $254
Targets: $480 (short-term), $520–$569 (full breakout projection)
Outlook: Bullish, pending confirmation above $401.95
🔔 Reminder Note :
Let this serve as a key reminder.
🚨 Bearish Risk Levels :
A rejection at $401 without a confirmed close could lead to a pullback toward $372 or EMA clusters.
Breakdown below $347 invalidates short-term bullish setup and returns price to range.

Complete Mapping Analysis — USDJPY (H1 Chart)Strategy Focus: Elliott Wave (Impulse) + AO Divergence + Fibonacci Extensions
🔍 1. Current Wave Structure (Elliott Wave Count)
You’ve identified:
A completed Wave 3 (impulse).
A completed or nearly completed Wave 4 correction.
Now projecting Wave 5 to complete the 5-wave impulse.
Substructure breakdown:
Wave 1-2: Clean impulse and pullback.
Wave 3: Strong rally with AO confirming higher momentum peaks.
Wave 4: Corrective move, breaking below the internal trendline (initial break), signaling potential end of correction.
Wave 5 (projected): Final push upward to complete the motive wave.
📊 2. Fibonacci Extension Targets
From Wave 0–3 and Wave 4 retracement:
2.618 extension: ~146.50
2.886 extension: ~146.78
4.236 extension: ~148.22 (Aggressive top for a possible extended fifth)
These are possible Wave 5 termination zones. Confluence with previous supply zones increases likelihood of reversal here.
📉 3. Momentum Confirmation — Awesome Oscillator (AO)
You're watching for:
Bearish Divergence on AO:
Wave 3 had a strong momentum peak.
Expect Wave 5 to push higher in price, but AO shows a lower high, signaling weakening momentum.
This aligns with classic Wave 5 behavior — price extension with momentum exhaustion.
🧭 4. Entry Strategy
Setup: Long entry at Wave 4 bottom.
Entry trigger: Initial break → minor pullback → bullish confirmation candle.
AO: Turns green after red bars = first sign of momentum recovery.
Optional confirmation: Break of short-term structure high (micro Wave 1 in Wave 5).
🎯 5. Take Profit Plan
Layered take-profit strategy based on Fibonacci and AO:
Target Zone Price Area Action
TP1 (Safe) ~1.618 (145.44–145.72) Take partial profit (30–50%)
TP2 (Primary) ~2.618 (146.50) Secure majority of profit (80%)
TP3 (Max/Stretch) ~4.236 (148.22) Optional final push / runner
🛡 6. Stop Loss Strategy
SL placement: Below Wave (4) low (~143.73 zone) or below structure break.
Use structure break or strong bearish engulfing as a reason to exit early if momentum fails.
⚠️ 7. Divergence & Reversal Monitoring
Once price enters your TP2–TP3 zone:
Look for:
AO divergence (price high vs. AO lower high).
Bearish engulfing candles or microstructure breaks.
Weak volume or extended wick rejection.
These may indicate Wave 5 completion and the start of Wave A (correction) or a reversal.
🔄 8. Next Play After Wave 5 Completes
If divergence confirms and reversal begins:
Map corrective structure (ABC).
Short from:
Break of rising wedge/trendline.
AO flips red + break of microstructure.
Target retracement:
0.382 to 0.618 retracement of the full Wave 1–5 impulse.
Target zone: ~144.80 – 143.70
✅ Summary: Strategic Flow
✅ Identify Wave 4 completion → Confirm via initial break + minor pullback.
✅ Long entry for Wave 5 → Enter on bullish candle or structural break.
✅ Track AO → Expect divergence at Wave 5 peak.
✅ Use Fibonacci for TP zones.
✅ Exit with confirmation of divergence and reversal signs.
✅ Option to reverse short post-Wave 5.

Technical and digital analysisWe notice that we are in an upward correction and there is an increase in momentum. We are waiting for sellers to weaken in order to buy

DOGE Breakout alertDOGE Successfully breakout this resistant line
Expect can pump more from here with short term target 10%
Invalid if daily candle close below 0.153

XAUUSD 1st week May 2025After this week continuing its correction to 3202, at the end of the week gold found its support. This has the opportunity as a reversal area to continue its bullish trend.
If Monday could break 3270, it has a strong posibility to reverse.
Goodluck !

FTT Breakout soonWaiting for breakout this resistant line
You can buy some after breakout with a short -term target of at least 10%+.

Iluka Resources Stock Quote | Chart & Forecast SummaryKey Indicators On Trade Set Up In General
1. Push Set Up
2. Range Set up
3. Break & Retest Set Up
Notes On Session
# Iluka Resources Stock Quote
- Double Formation
* Wave Feature - Wave (3)) Ongoing | Completed Survey
* ((No Trade)) & Invalid Structure | Subdivision 1
- Triple Formation
* (Downtrend Argument)) | Subdivision 2
* (TP1) | Subdivision 3
* Daily Time Frame | Trend Settings Condition
- (Hypothesis On Entry Bias)) | Indexed To 100
- Position On A 1.5RR
* Stop Loss At 60.00 AUD
* Entry At 58.00 AUD
* Take Profit At 52.00 AUD
* (Downtrend Argument)) & No Pattern Confirmation
* Ongoing Entry & (Neutral Area))
Active Sessions On Relevant Range & Elemented Probabilities;
European-Session(Upwards) - East Coast-Session(Downwards) - Asian-Session(Ranging)
Conclusion | Trade Plan Execution & Risk Management On Demand;
Overall Consensus | Sell
