BEL/USDTKey Level Zone: 0.3900 - 0.3920
HMT v8.1 detected. The setup looks promising, supported by a previous upward/downward trend with increasing volume and momentum, presenting an excellent reward-to-risk opportunity.
HMT (High Momentum Trending):
HMT is based on trend, momentum, volume, and market structure across multiple timeframes. It highlights setups with strong potential for upward movement and higher rewards.
Whenever I spot a signal for my own trading, I’ll share it. Please note that conducting a comprehensive analysis on a single timeframe chart can be quite challenging and sometimes confusing. I appreciate your understanding of the effort involved.
Important Note :
Role of Key Levels:
- These zones are critical for analyzing price trends. If the key level zone holds, the price may continue trending in the expected direction. However, momentum may increase or decrease based on subsequent patterns.
- Breakouts: If the key level zone breaks, it signals a stop-out. For reversal traders, this presents an opportunity to consider switching direction, as the price often retests these zones, which may act as strong support-turned-resistance (or vice versa).
My Trading Rules
Risk Management
- Maximum risk per trade: 2.5%.
- Leverage: 5x.
Exit Strategy
Profit-Taking:
- Sell at least 70% on the 3rd wave up (LTF Wave 5).
- Typically, sell 50% during a high-volume spike.
- Adjust stop-loss to breakeven once the trade achieves a 1.5:1 reward-to-risk ratio.
- If the market shows signs of losing momentum or divergence, ill will exit at breakeven.
The market is highly dynamic and constantly changing. HMT signals and target profit (TP) levels are based on the current price and movement, but market conditions can shift instantly, so it is crucial to remain adaptable and follow the market's movement.
If you find this signal/analysis meaningful, kindly like and share it.
Thank you for your support~
Sharing this with love!
HMT v2.0:
- Major update to the Momentum indicator
- Reduced false signals from inaccurate momentum detection
- New screener with improved accuracy and fewer signals
HMT v3.0:
- Added liquidity factor to enhance trend continuation
- Improved potential for momentum-based plays
- Increased winning probability by reducing entries during peaks
HMT v3.1:
- Enhanced entry confirmation for improved reward-to-risk ratios
HMT v4.0:
- Incorporated buying and selling pressure in lower timeframes to enhance the probability of trending moves while optimizing entry timing and scaling
HMT v4.1:
- Enhanced take-profit (TP) target by incorporating market structure analysis
HMT v5 :
Date: 23/01/2025
- Refined wave analysis for trending conditions
- Incorporated lower timeframe (LTF) momentum to strengthen trend reliability
- Re-aligned and re-balanced entry conditions for improved accuracy
HMT v6 :
Date : 15/02/2025
- Integrated strong accumulation activity into in-depth wave analysis
HMT v7 :
Date : 20/03/2025
- Refined wave analysis along with accumulation and market sentiment
HMT v8 :
Date : 16/04/2025
- Fully restructured strategy logic
HMT v8.1 :
Date : 18/04/2025
- Refined Take Profit (TP) logic to be more conservative for improved win consistency
Wave Analysis

#MAGIC/USDT#MAGIC
The price is moving within a descending channel on the 1-hour frame and is expected to break and continue upward.
We have a trend to stabilize above the 100 moving average once again.
We have a downtrend on the RSI indicator that supports the upward move with a breakout.
We have a support area at the lower boundary of the channel at 0.2045, which acts as strong support from which the price can rebound.
Entry price: 0.2060
First target: 0.2097
Second target: 0.2131
Third target: 0.2180

#PHB/USDT#PHB
The price is moving within a descending channel on the 1-hour frame and is expected to break and continue upward.
We have a trend to stabilize above the 100 moving average once again.
We have a downtrend on the RSI indicator that supports the upward move with a breakout.
We have a support area at the lower boundary of the channel at 0.652, which acts as strong support from which the price can rebound.
Entry price: 0.666
First target: 0.692
Second target: 0.712
Third target: 0.740

#SC/USDT#SC
The price is moving within a descending channel on the 1-hour frame and is expected to break and continue upward.
We have a trend to stabilize above the 100 moving average once again.
We have a downtrend on the RSI indicator that supports the upward move with a breakout.
We have a support area at the lower boundary of the channel at 0.003437. This area acts as strong support from which the price can rebound.
Entry price: 0.003466
First target: 0.003485
Second target: 0.003520
Third target: 0.003556

#STORJ/USDT#STORJ
The price is moving within a descending channel on the 1-hour frame, adhering well to it, and is on its way to breaking it strongly upwards and retesting it.
We are seeing a bounce from the lower boundary of the descending channel, which is support at 0.3060.
We have a downtrend on the RSI indicator that is about to break and retest, supporting the upward trend.
We are looking for stability above the 100 moving average.
Entry price: 0.3090
First target: 0.3125
Second target: 0.3170
Third target: 0.3231

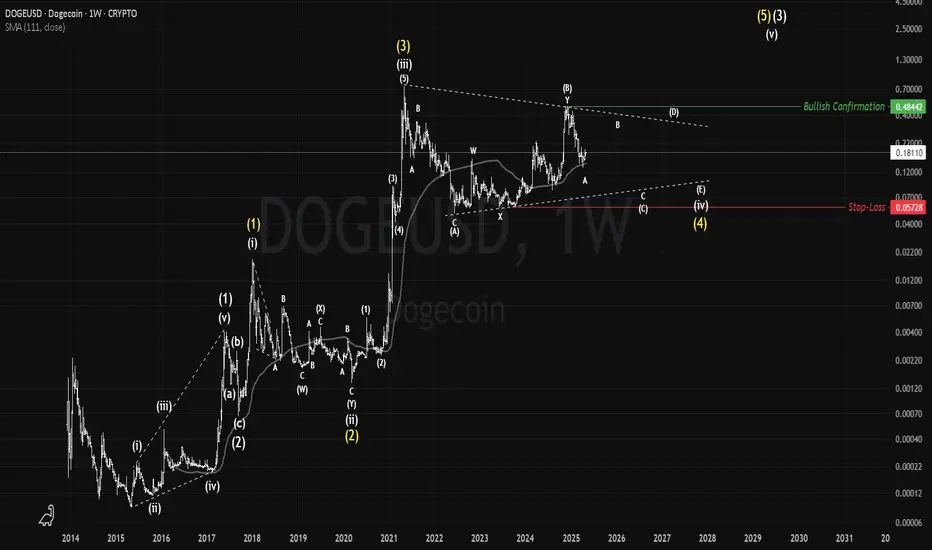
DOGE: The Dogecoin ArmyCRYPTOCAP:DOGE is among the top10 cryptocurrenices and although it's a memecoin but it's a legit store of value. After it's historical run during 2020/2021, it went in a 4 years long correction so far that is still ongoing and expected to last another couple of years as long as the price stays in the current bullish triangle pattern. By holding above $0.057 (the stop-loss) and below the level of $0.48 which passing it confirms targeting a new all-time high.
#Dogecoin
#CVX/USDT#CVX
The price is moving within a descending channel on the 1-hour frame and is expected to break and continue upward.
We have a trend to stabilize above the 100 moving average once again.
We have a downtrend on the RSI indicator that supports the upward move with a breakout.
We have a support area at the lower limit of the channel at 2.72, which acts as strong support from which the price can rebound.
Entry price: 2.83
First target: 2.90
Second target: 2.97
Third target: 3.06

2025-05-01 - priceactiontds - daily update - nasdaqGood Evening and I hope you are well.
comment: Way tougher than it looks. Both sides have good arguments why this continues higher or why today marked the top. I have a heavy bearish bias but I confirmation would only be below 19090 and that’s 700 points down. I do think if bears can close the gap down to 19640, we retest 19300 and there we have the first bull trend line. Below we go for 19100, which was the us gdp spike low and below that is armageddon. Bulls have nothing but continuation of this short squeeze. When Apple earnings disappoint, you know things are about to get real ducking bad next.
current market cycle: trading range
key levels: 19000 - 20000
bull case: Bulls got 20000 and even went above the April high, now what? Technically still a lower high until they hit 20537. They have going for them that today was the first bear bar after 7 consecutive bull days. They now want to defend the open gaps to keep the momentum going. A pullback can go way deeper than most bulls will be comfortable with, given the current environment. I do think best bulls can hope for tomorrow, is to go sideways and close the week above 20000.
Invalidation is below 19640.
bear case: Bears have all the macro schmackro arguments on their side that you can try to come up with. Structure says bullish until bull trend lines are broken. First is around 19500 and second is the bigger one around 19000. Can bears get to either tomorrow? I do think so yes. This was a nasty short squeeze but we are right under the weekly 20ema, technically still a lower high because the last major lower high was 20536. On the weekly chart this is a textbook two-legged pullback to the moving average and I pray daily that we will get another huge leg down to 15000. How likely is that? For now, very unlikely. Still it would be more fun if the bull trend line from the covid lows would break and we transition into a trading range 15000 - 22000.
Invalidation is above 20140.
short term: Neutral. For tomorrow I can see 20100 not getting hit again and we sell-off. If markets stays above 19700, bulls remain in full control. full bear mode below 19640. Above 20140 we likely go for 20500+.
medium-long term - Update from 2024-04-20: My most bearish target for 2025 was 17500ish, given in my year-end special. We are +18% from the lows and I do think, once this turns again, it will easily be the short trade of the year.
trade of the day: Longs near 1h 20ema. Was profitable couple of times. Sell-off into close was insider-trading. Absolutely certain that the earnings were leaked.

#FIL/USDT#FIL
The price is moving within a descending channel on the 1-hour frame, adhering well to it, and is heading towards a strong breakout and retest.
We are seeing a bounce from the lower boundary of the descending channel, which is support at 2.68.
We have a downtrend on the RSI indicator that is about to be broken and retested, which supports the upward trend.
We are looking for stability above the 100 moving average.
Entry price: 2.73
First target: 2.78
Second target: 2.86
Third target: 2.95

#ROSE/USDT#ROSE
The price is moving within a descending channel on the 1-hour frame and is expected to break and continue upward.
We have a trend to stabilize above the 100 moving average once again.
We have a downtrend on the RSI indicator that supports the upward move with a breakout.
We have a support area at the lower limit of the channel at 0.02800, which acts as strong support from which the price can rebound.
Entry price: 0.03023
First target: 0.03100
Second target: 0.03200
Third target: 0.03300

Highlighted in green between approximately $96,500 and $97,050.a 1-hour chart of Bitcoin (BTC/USD) on the BITSTAMP exchange. Here’s a breakdown of the chart:
Current Price: Around $96,479.
Sell Zone: Highlighted in green between approximately $96,500 and $97,050. This is likely a resistance zone where the trader expects selling pressure.
Red Zone Below: Represents the expected price drop area, indicating a bearish outlook.
Price Action: The chart shows a sharp move up into the Sell Zone, followed by a small pullback, and then a projected drop.
Target Zone: Around $93,242, with an extended potential drop to $91,572, indicated by the arrow.
Support Zone: The yellow rectangle near $93,200 is a key support area where price might stabilize or bounce.
This chart suggests a short (sell) trade setup, anticipating a reversal from the current high back toward support levels.

#BONK/USDT#BONK
The price is moving within a descending channel on the 1-hour frame and is expected to break and continue upward.
We have a trend to stabilize above the 100 moving average once again.
We have a downtrend on the RSI indicator that supports the upward move with a breakout.
We have a support area at the lower boundary of the channel at 0.00001825, which acts as strong support from which the price can rebound.
Entry price: 0.00001883
First target: 0.00001967
Second target: 0.00002078
Third target: 0.00002222

BITCOIN Will Keep Growing! Buy!
Hello,Traders!
BITCOIN is trading in an
Uptrend an the coin made
A bullish breakout of the
Key horizontal level of 94k$
Which is now a support and
Is now going up again so we
Are bullish biased and we will
Be expecting a further
Bullish continuation
Buy!
Comment and subscribe to help us grow!
Check out other forecasts below too!
Disclosure: I am part of Trade Nation's Influencer program and receive a monthly fee for using their TradingView charts in my analysis.

#FET/USDT#FET
The price is moving within a descending channel on the 1-hour frame, adhering well to it, and is heading towards a strong breakout and retest.
We are experiencing a rebound from the lower boundary of the descending channel, which is support at 0.695.
We are experiencing a downtrend on the RSI indicator that is about to be broken and retested, which supports the upward trend.
We are heading towards stability above the 100 moving average.
Entry price: 0.730
First target: 0.765
Second target: 0.810
Third target: 0.850

#INJ/USDT#INJ
The price is moving within a descending channel on the 1-hour frame, adhering well to it, and is heading for a strong breakout and retest.
We are seeing a rebound from the lower boundary of the descending channel, which is support at 9.54.
We have a downtrend on the RSI indicator that is about to be broken and retested, supporting the upward trend.
We are looking for stability above the 100 moving average.
Entry price: 10.00
First target: 10.32
Second target: 10.64
Third target: 11.00

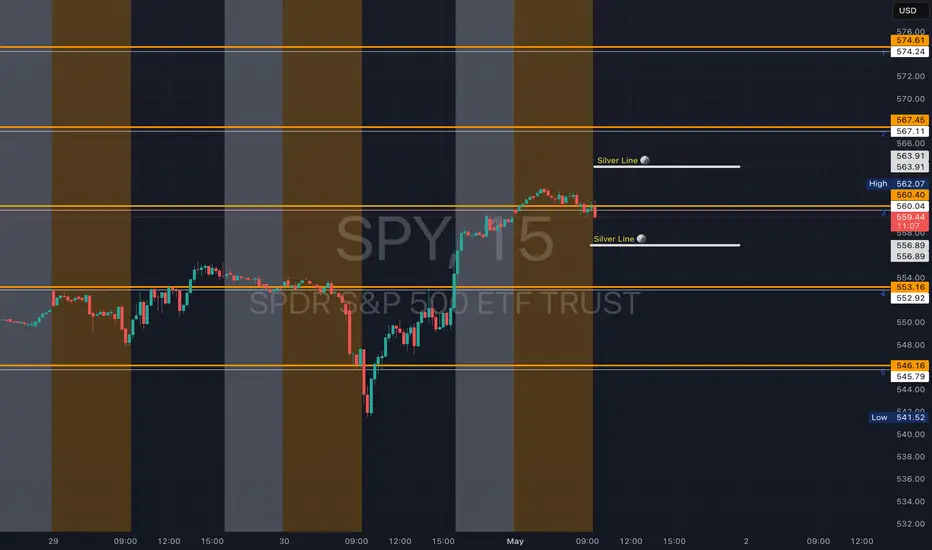
SPY - support & resistant areas for today May 1 2025These are Support and Resistance lines for today, May 1st, 2025, and will not be valid for the next day. Mark these in your chart by clicking grab this below.
Yellow Lines: Heavily S/R areas, price action will start when closing in on these.
White Lines: Are SL, TP or Mid Level Support and Resistance Areas, these are traded if consolidation take place on them.
Silver Lines: An Area where price action could happen and do work on a choppy day.
#MBOX/USDT#MBOX
The price is moving within a descending channel on the 1-hour frame, adhering well to it, and is on its way to breaking it strongly upwards and retesting it.
We are seeing a bounce from the lower boundary of the descending channel, which is support at 0.0551.
We have a downtrend on the RSI indicator that is about to break and retest, supporting the upward trend.
We are looking for stability above the 100 Moving Average.
Entry price: 0.0580
First target: 0.0634
Second target: 0.0666
Third target: 0.0713

#SOL/USDT#SOL
The price is moving within a descending channel on the 1-hour frame, adhering well to it, and is on its way to breaking it strongly upwards and retesting it.
We are seeing a bounce from the lower boundary of the descending channel, this support is at 144.
We have a downtrend on the RSI indicator that is about to break and retest, which supports the upward trend.
We are looking for stability above the 100 moving average.
Entry price: 149
First target: 153
Second target: 156
Third target: 161

#SEI/USDT#SEI
The price is moving within a descending channel on the 1-hour frame and is expected to break and continue upward.
We have a trend to stabilize above the 100 moving average once again.
We have a downtrend on the RSI indicator that supports the upward move with a breakout.
We have a support area at the lower limit of the channel at 0.2000, which acts as strong support from which the price can rebound.
Entry price: 0.2032
First target: 0.2074
Second target: 0.2119
Third target: 0.2164

$vvv bottom is in?bottom in at $1.88'
ai agent of base / coinbase
was horribly launched.. insider / rug pulls etc.. think its oversold and might be a winner going forward if the ai narrative comes back
NYSE:VVV
COINBASE:VVVUSD

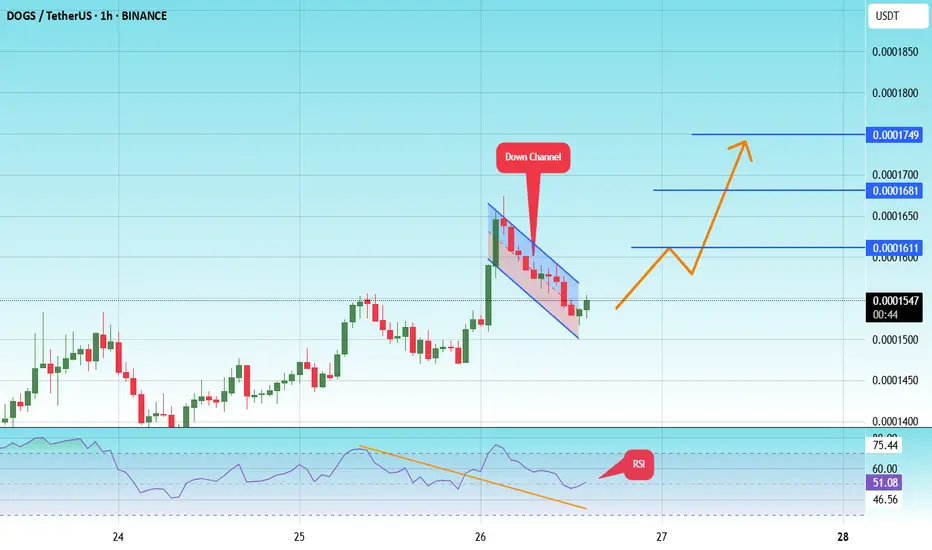
#DOGS/USDT#DOGS
The price is moving within a descending channel on the 1-hour frame and is expected to break and continue upward.
We have a trend to stabilize above the 100 moving average once again.
We have a downtrend on the RSI indicator that supports the upward move with a breakout.
We have a support area at the lower boundary of the channel at 0.0001510. This area acts as strong support from which the price can rebound.
Entry price: 0.0001545
First target: 0.00001611
Second target: 0.0001680
Third target: 0.0001750
BTC Breakdown Alert: Eyes on 94,900. Possible?BTC is currently at 96,565 and showing signs of potential downside; if it breaks below the key support level of 96,151, it could drop further toward 94,900 or even lower.

Is GOLD About to Begin a Bearish Trend or a False Signal?Is GOLD About to Begin a Bearish Trend or a False Signal?
Gold is approaching a critical moment—if the breakout happens, we could see a significant shift in trend. The price is forming a large triangle pattern, which suggests that a decline may be coming soon.
However, caution is needed.
Gold prices have been manipulated for a long time and it will be difficult to spot when the big bearish wave starts.
You may watch the analysis for further details!
Thank you and Good Luck!
❤️PS: Please support with a like or comment if you find this analysis useful for your trading day❤️
