USDEUR - inverted head and shouldershi traders,
Let's have a look at USDEUR on 4h.
It looks like the head and shoulders pattern formed.
The breakout has just occurred and the long position can be taken.
Put a stop loss below the right shoulder.
2,20% move expected.
Target: 0,9037
Wave Analysis

US30: Bullish Breakout on the Horizon – Next Target 44,000? US30: Bullish Breakout on the Horizon – Next Target 44,000?
Since our last analysis, US30 has climbed +2.7%, rising from 39,300 to 40,400.
The price is nearing a breakout from a large bullish triangle, which could trigger an even bigger upward move.
After hitting a low of 36,500 on April 7, US30 has been steadily rising, forming a strong triangle pattern. A breakout could start a powerful wave toward 44,000.
You may find more details in the chart!
Thank you and Good Luck!
❤️PS: Please support with a like or comment if you find this analysis useful for your trading day❤️
Previous analysis:

Analysis of the latest gold trend on May 1:
Summary of Gold 4-hour Chart Trading Strategy (Oscillating Convergence Phase)
Key Patterns and Trends
Technical Patterns:
Bollinger Bands close, price fluctuation range shrinks (3275-3340).
Potential Convergence Triangle: Highs move down, lows move up, waiting for the direction of breakthrough.
Current range: 3275 (support) - 3340 (resistance), short-term focus on 3320-3330 resistance & 3275-3265 support.
Trading Strategy (Cautious Operation Before Non-agricultural)
1. High-altitude within the range
Entry point: 3320-3330 (close to the upper track, stagflation signals such as K-line reversal, overbought indicators).
Stop loss: above 3340 (invalid if breakthrough).
Target: 3275-3265 (take profit in batches).
2. Follow up short orders after breaking support
Confirmation conditions: 4-hour closing price falls below 3275, and Bollinger Band opening widens.
Adding position strategy: chasing short to 3250-3230, stop loss 3285.
3. Short-term low-long (strict risk control is required against the trend)
Condition: first touch 3275-3265 + RSI oversold (<30) or rebound quickly.
Stop loss: below 3260, target 3300-3310 (quick in and out).
Non-agricultural data impact & weekly key points
Before non-agricultural:
Maintain the idea of shock, light position operation, avoid placing orders before the data (slippage risk).
Weekly closing:
If it closes negative: next week may further explore 3230-3200.
If it breaks through 3340: observe whether it can stand firm at 3350 (long signal).
Key points for implementation
Main strategy: If the price rebounds to 3320-3330, you can look for opportunities to try short selling, with a stop loss of 3340 and a target of 3275-3265.
Breakout follow-up: Go short if it breaks below 3275, and wait and see if it will go long if it breaks above 3340.
Risk control: Single stop loss ≤ 2% of position, reduce position before non-agricultural data.

Short-Term Trading Signals for NVIDIAShort-Term Trading Signals for NVIDIA (NVDA): Why Now May Not Be the Time to Buy
4H Timeframe
NVIDIA (NVDA) has recently formed two price gaps that are likely to be filled in the short term. These gaps could provide a solid foundation for the next potential upward move.
The current rally appears weak and lacks strong momentum, possibly driven more by overall market behavior than by stock-specific strength. With the Dow Jones showing signs of weakness, NVDA’s current price action may simply be following the broader trend rather than signaling genuine bullish intent.
Day Timeframe
We are anticipating a bullish breakout signal characterized by a sharp move — approximately a 10% gain in a single day. This breakout target may vary depending on the volatility of the asset, but for NVDA, a 10% intraday rise would qualify as a clear breakout signal based on its historical behavior.
Position: BUY
Entry: 100-109
Disclaimer: Remember, this is purely a short-term trading signal intended to optimize your entry timing. For medium- and long-term investors, NVDA remains a solid buy even at current levels.

Today is oct 14th 1929 I have moved back to Long puts at 105%The chart posted was in the forecast written dec 8th 2024 We have now reached my targets of 5669 area I have been buying the dips in calls and made $ I am now 105 % long in the money puts and I do Not see a bottom until july once we break and a second bottom mid oct The market should see a drop of 38 % into july and form a small double bottom in oct at 41 % off the highs . I will move to 125 % long puts on a sell stop at 5300 even the math at 5334 is key Best of trades WAVETIMER

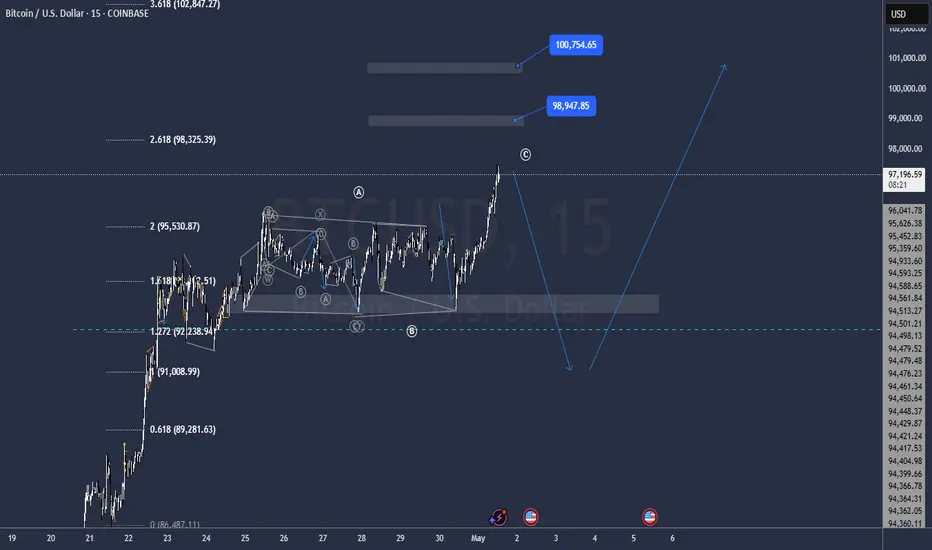
BTC 2025.05.01***Follow SEOVEREIGN to receive alerts.
**Boosts help SEOVEREIGN analyze more assets.
**Our team regularly publishes analysis reports on the cryptocurrency market.
🎯 Short-Term Bitcoin Downside Scenario
While we still envision long-term upward potential,
we are sharing a short-term bearish outlook based on the 15-minute chart for those engaged in futures trading.
A classic Crab Pattern has been identified,
which may serve as a helpful reference for those interested in harmonic patterns.
Target 1: 95,705
Target 2: 94,650
As long as the pattern remains valid, a correction toward these levels can be considered a natural move.
Please exercise caution and manage your risk appropriately when trading.

Gold plummeted as expected. Operation strategy?In my last analysis, Quaid predicted that gold was at risk of falling and breaking.
Quaid promptly told everyone that they could short trade at 3310-3320.
At present, the market situation is basically consistent with Quaid's expectations. As of now, gold has fallen to a low point near 3215. And it has been maintained for some time.
Quaid speculates that gold will continue to maintain a bearish trend and continue to retreat.
Quaid data analysis:
From the hourly chart, gold is currently following a wave trend, and the highest point of 3352 is the starting point of wave A. The high point of wave b is at 3320. If the current 3220 is the beginning of the low point of wave C, then be careful of its continued decline.
Trading strategy:
In terms of the next operation, Quaid suggests waiting for short trading near 3225.
If gold falls below 3210 again, then the bottom can directly look towards the 3190-3200 range.
Quaid warned everyone not to think that the trading range is very large; because the trading markets in some Asian countries are closed, any terrible thing could happen. It is recommended that everyone take profits in time.

Gold trading ideas after key data releaseOn the news front, the US April ISM manufacturing PMI was higher than expected, which led to the US Treasury bonds giving up their gains. From a technical analysis point of view, after the gold price fell out of the strong support of 3260 in the shock range, this position turned into the short-term resistance level for our short-term reference, followed by the position of multiple entity K-lines at the hourly level of 3275. There is a possibility of breaking through 3260 in the later period, so 3275 can also be treated as a defensive position.
Although the price of gold has been hovering around 3220, our main bearish direction remains unchanged in the short term. The trading strategy given in the afternoon is still a reference. For rebound, first focus on the 3240-3250 first-line resistance, and further look at the top-bottom transition position of 3260-3270. You can participate in transactions in small batches. Below, focus on the 3210-3200 support, and if it falls below, look for the 3193 first-line.
TVC:GOLD FOREXCOM:XAUUSD FXOPEN:XAUUSD FX:XAUUSD OANDA:XAUUSD

I might be Wrong in my previous ForecastBTC may be still in correction stage and one more fall is very possible, secure your buy poitioms
new buy zone is @ 92.000
A perfect masterpiece - my final trade & mic dropHello friends. I have found the perfect trade, and I went all in with my entire account because my conviction is so high that I can say I'm 99.9% sure that I will be correct. I have never been this confident about a trade in my entire career to date.
I have purchased six figures in put contracts on the SPY and SPX because I can see that a crash is about to happen. Here are a few of the factors that I am looking at which have made me so confident.
1) Retail is frantically buying the dip as well as the rip, and they are almost always wrong & lose money. Meanwhile, smart money has been selling this whole time.
2) My wave theory shows a clear WXY pattern that has now been completed. We can't currently be in an impulsive wave to the upside because there is too much overlapping.
3) Trade deal is NOT coming soon. Polymarket predicts only 19% odds for a US-China trade deal to happen before June. The tariff situation does not look good, and it isn't priced in anymore as we have retraced the entire tariff dump already.
4) The market is currently trading far above liquidity based fair value, which has been plummeting in recent weeks indicating that a drop is bound to happen soon for risk prices. To reach the fair price, the SPY should trade about 30% lower than current prices. This gives us enormous room for a cascade to the downside.

SENDAI - Analysis on potential price movementY wave with target (E) within stipulated time.
The price has recently broken above the downtrend line.
Price is trading near the bottom edge of the Kumo which currently appears reddish (bearish), indicating a resistance area.
Tenkan Sen is above Kijun Sen, signaling a short-term bullish sentiment.
The Chikou Span is close to the price area, and a move above the cloud would further confirm bullish momentum.
Key support at 0.335.
Resistance levels are marked by the cloud and Fibonacci retracement levels near the 0.580–0.600 range.
Entry: Consider entering a long position around the current price 0.470 or on a minor retracement closer to 0.455–0.465.
Stop Loss: Place a stop loss below a recent support, ideally below 0.425–0.430 to protect against false breakouts.
Primary target at the Y wave completion near 0.580–0.600.
Note:
1. Analysis for education purposes only.
2. Trade at your own risk.

B wave short incoming!if eth breaks its local top before making a double bottom this trade idea is invalid.

Nifty Analysis 02.05.2025As of May 1, 2025, the Nifty 50 index has demonstrated a robust performance, closing April with a gain of 3.46%, building upon a 6.30% rise in March. This upward momentum is largely attributed to substantial foreign portfolio investments (FPIs), with approximately $4.11 billion injected over nine trading sessions, marking the longest buying spree since July 2023.
mint
The rally has been further supported by optimism surrounding a potential U.S.-India trade agreement, India's strong economic outlook compared to global peers, and attractive valuations among Indian large-cap stocks. Notably, heavyweights like Reliance Industries have contributed to investor enthusiasm with strong corporate earnings.
Despite geopolitical tensions, including a recent militant attack in Kashmir, the markets have remained resilient. However, such events have introduced volatility, as evidenced by the Nifty volatility index rising for the fifth time in six sessions.
Looking ahead, historical trends suggest that May often yields modest gains for the Nifty 50, with positive returns in six out of the past ten years, averaging 1.5%. Sectors like Auto and FMCG have historically performed well during this month.

GOLD/USD Short-Term Bullish Setup – Final Wave 5 ExpectedAs per the current 30-min chart, Gold appears to be completing its corrective structure and is now poised for a bullish reversal. Key observations:
🔹 Support Zone:
Gold has respected the 78.6% Fibonacci retracement level (~3210), showing strong demand in this region. This marks the potential base of the upcoming 5th Elliott wave.
🔹 Trigger Level:
Price needs to break and sustain above 3240 to confirm bullish momentum. This is the neckline of the current consolidation and serves as the breakout zone.
🔹 Wave Projection:
We anticipate Gold to initiate Wave 5, the final impulsive move in the current sequence. A clear breakout above 3240 may trigger a rally towards 3300 / 3360 / 3420 in the short term.
🔹 Strategy:
Wait for a bullish candle close above 3240 to confirm breakout. Aggressive traders may initiate early positions near 3210 with tight stop-losses.
📌 Key Levels:
Support: 3210–3200 (78.6% Fib)
Breakout: 3240
Targets: 3300 / 3360 / 3420
🔻 Invalidation:
Break below 3200 would invalidate this bullish count and suggest deeper correction.
💬 Gold is gearing up for its final bullish thrust. Monitor 3240 zone for breakout confirmation. Keep risk managed!
❗ Disclaimer:
This analysis is for educational and informational purposes only. It does not constitute investment advice or a recommendation to trade. Always do your own research and consult your financial advisor before making trading decisions.

Wait to buyThe price will break the 1.12640 resistance. Look for an entry trigger in the 1.12517 to 1.11580 zone

Gold starts a unilateral decline?
📌 Gold information
U.S. stock indexes fell sharply in midday trading due to disappointing U.S. economic data. On Friday, the U.S. Department of Labor will release the crucial monthly employment report. This is likely to be the most important U.S. data point so far this year.
In other news, Dow Jones News Service reported: "Tariffs are beginning to bring pressure, prompting the Eastern giant to increase stimulus to support economic growth.
📊Comment analysis
For international gold, what you need to do now is to follow the market. Don't think about bottom fishing. You can do a short-term rebound during the day. When the market has clearly broken the structure, you should choose to believe in the technical side, rather than speculate on the next support. This will only be endless. At this stage, if you fail to bottom fishing, are you still ready to try again near the integer of 3200? This is not over yet. Even if it falls below 3200, the 3180 horizontal support will be immediately below.
This round of decline is about to completely give up the second rise in the front end, depending on 3180. This is why I just said that 3200 will immediately encounter a new support. The reason why many people choose to go long above 3240 is also because it is the first stage of the high platform of the front-end surge, and it is necessary to defend. Unfortunately, the defense is not successful now. In other words, if you want to go short next, you have to look at the continued decline. What are the characteristics of the continued decline? You certainly can't tolerate it having an excessive rebound, so don't think about any high-altitude trading strategy.
💰Strategy Package
Short position:
Actively participate at 3230 points, and the profit target is around 3200 points
⭐️ Note: Labaron hopes that traders can properly manage their funds
- Choose the number of lots that matches your funds
- Profit is 4-7% of the capital account
- Stop loss is 1-3% of the capital account

UVXY About to Take Off – Volatility Is Brewing!Volatility is creeping back into the markets — and CBOE:UVXY is showing strong signs of a potential breakout.
With SPX and Nasdaq flashing weakness, fear is quietly returning. Historically, moves like this in UVXY don’t wait long…
This could be the calm before a volatility storm.
Watch closely — upside momentum may come fast and hard.
Risk tight. Trade smart.

Azul Brazilian Airlines S.A Stock rebounding, we will watch a high liquidity increases
Stock on Buying signal
Target price = 2.56 - 2.88 $
Buy it now as much as you can 🔥

12pm updateThe move up looks finished. If it's correct that a C wave is next we will have minimal bouncing down to around 540 on SPY. Vix is now showing 4 hour bullish divergence, so an attempt at 28 resistance is expected (as of now)

US Markets on the Edge – Heavy Bloodshed Ahead!The charts are screaming caution!
SPX, Nasdaq, and major tech stocks are showing clear signs of exhaustion. We could be entering a heavy correction phase.
This is not the time to be greedy — protect your capital, manage risk, and tighten those stop losses.
Stay alert. Stay smart.
Massive moves are coming, and not everyone will survive them.

AXIATA - Trend reversal?Y Wave with target (E) within stipulated time.
Price breakout above the downtrend line – this suggests a potential bullish reversal.
Price is approaching the Kumo – breaking into or above the Kumo will strengthen the bullish signal.
Chikou Span is still below candles but starting to rise – watch for a cross above the price line as confirmation.
1.63 is marked as the 52-week low, a strong psychological and technical support level.
Price to maintain above Kijun-Sen and close inside Kumo with golden cross, that would further confirm trend reversal.
Support at 1.76 and 1.73. Set a stop loss when close below this level.
Note:
1. Analysis for education purposes only.
2. Trade at your own risk.

ECA - Looking for bullish momentumY wave with target (E) within stipulated time.
Price has just broken above the major downtrend line.
This breakout is a bullish signal, indicating a potential reversal or at least a corrective rally.
Tenkan Sen has crossed above Kijun Sen recently, which is a bullish crossover.
Price is near the lower boundary of the Kumo, which currently serves as resistance.
The cloud ahead is bearish, implying potential strong resistance to overcome before a sustained uptrend can form.
Chikou Span positions closer to price highs, suggesting increasing momentum.
Immediate support at 0.165.
Stronger support at 0.130.
Resistance near the cloud.
Entry: Consider entering a long position now or on a minor retracement near 0.170–0.175 after confirming support.
Stop Loss: Place stop loss below support around 0.160 or more conservatively below 0.150 to manage risk.
Target: Primary target towards the wave (E) at around 0.210 – 0.220.
Note:
1. Analysis for education purposes only.
2. Trade at your own risk.

Bitcoin Overall: Big short coming upIt is possible price doesn't reach the 'definite short zone', however a trade should be taken here (not financial advise).
Overall, however, BTC has made significant progress and it is likely new ATH are in the near future, but by the same token this BTC bull market is probably over this year.
