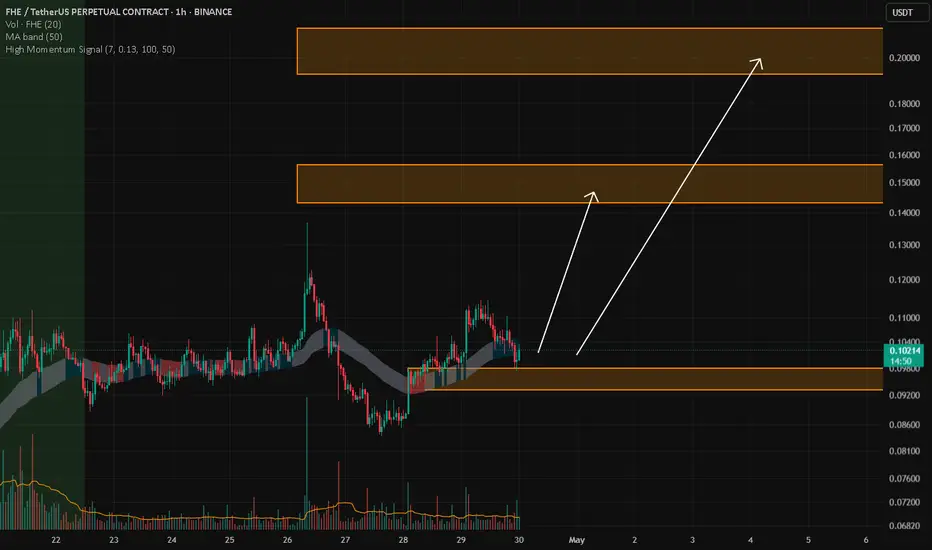
FHE/USDTKey Level Zone: 0.09320 - 0.09790
HMT v8.1 detected. The setup looks promising, supported by a previous upward/downward trend with increasing volume and momentum, presenting an excellent reward-to-risk opportunity.
HMT (High Momentum Trending):
HMT is based on trend, momentum, volume, and market structure across multiple timeframes. It highlights setups with strong potential for upward movement and higher rewards.
Whenever I spot a signal for my own trading, I’ll share it. Please note that conducting a comprehensive analysis on a single timeframe chart can be quite challenging and sometimes confusing. I appreciate your understanding of the effort involved.
Important Note :
Role of Key Levels:
- These zones are critical for analyzing price trends. If the key level zone holds, the price may continue trending in the expected direction. However, momentum may increase or decrease based on subsequent patterns.
- Breakouts: If the key level zone breaks, it signals a stop-out. For reversal traders, this presents an opportunity to consider switching direction, as the price often retests these zones, which may act as strong support-turned-resistance (or vice versa).
My Trading Rules
Risk Management
- Maximum risk per trade: 2.5%.
- Leverage: 5x.
Exit Strategy
Profit-Taking:
- Sell at least 70% on the 3rd wave up (LTF Wave 5).
- Typically, sell 50% during a high-volume spike.
- Adjust stop-loss to breakeven once the trade achieves a 1.5:1 reward-to-risk ratio.
- If the market shows signs of losing momentum or divergence, ill will exit at breakeven.
The market is highly dynamic and constantly changing. HMT signals and target profit (TP) levels are based on the current price and movement, but market conditions can shift instantly, so it is crucial to remain adaptable and follow the market's movement.
If you find this signal/analysis meaningful, kindly like and share it.
Thank you for your support~
Sharing this with love!
HMT v2.0:
- Major update to the Momentum indicator
- Reduced false signals from inaccurate momentum detection
- New screener with improved accuracy and fewer signals
HMT v3.0:
- Added liquidity factor to enhance trend continuation
- Improved potential for momentum-based plays
- Increased winning probability by reducing entries during peaks
HMT v3.1:
- Enhanced entry confirmation for improved reward-to-risk ratios
HMT v4.0:
- Incorporated buying and selling pressure in lower timeframes to enhance the probability of trending moves while optimizing entry timing and scaling
HMT v4.1:
- Enhanced take-profit (TP) target by incorporating market structure analysis
HMT v5 :
Date: 23/01/2025
- Refined wave analysis for trending conditions
- Incorporated lower timeframe (LTF) momentum to strengthen trend reliability
- Re-aligned and re-balanced entry conditions for improved accuracy
HMT v6 :
Date : 15/02/2025
- Integrated strong accumulation activity into in-depth wave analysis
HMT v7 :
Date : 20/03/2025
- Refined wave analysis along with accumulation and market sentiment
HMT v8 :
Date : 16/04/2025
- Fully restructured strategy logic
HMT v8.1 :
Date : 18/04/2025
- Refined Take Profit (TP) logic to be more conservative for improved win consistency
Wave Analysis
ID/USDTKey Level Zone: 0.20300 - 0.20500
HMT v8.1 detected. The setup looks promising, supported by a previous upward/downward trend with increasing volume and momentum, presenting an excellent reward-to-risk opportunity.
HMT (High Momentum Trending):
HMT is based on trend, momentum, volume, and market structure across multiple timeframes. It highlights setups with strong potential for upward movement and higher rewards.
Whenever I spot a signal for my own trading, I’ll share it. Please note that conducting a comprehensive analysis on a single timeframe chart can be quite challenging and sometimes confusing. I appreciate your understanding of the effort involved.
Important Note :
Role of Key Levels:
- These zones are critical for analyzing price trends. If the key level zone holds, the price may continue trending in the expected direction. However, momentum may increase or decrease based on subsequent patterns.
- Breakouts: If the key level zone breaks, it signals a stop-out. For reversal traders, this presents an opportunity to consider switching direction, as the price often retests these zones, which may act as strong support-turned-resistance (or vice versa).
My Trading Rules
Risk Management
- Maximum risk per trade: 2.5%.
- Leverage: 5x.
Exit Strategy
Profit-Taking:
- Sell at least 70% on the 3rd wave up (LTF Wave 5).
- Typically, sell 50% during a high-volume spike.
- Adjust stop-loss to breakeven once the trade achieves a 1.5:1 reward-to-risk ratio.
- If the market shows signs of losing momentum or divergence, ill will exit at breakeven.
The market is highly dynamic and constantly changing. HMT signals and target profit (TP) levels are based on the current price and movement, but market conditions can shift instantly, so it is crucial to remain adaptable and follow the market's movement.
If you find this signal/analysis meaningful, kindly like and share it.
Thank you for your support~
Sharing this with love!
HMT v2.0:
- Major update to the Momentum indicator
- Reduced false signals from inaccurate momentum detection
- New screener with improved accuracy and fewer signals
HMT v3.0:
- Added liquidity factor to enhance trend continuation
- Improved potential for momentum-based plays
- Increased winning probability by reducing entries during peaks
HMT v3.1:
- Enhanced entry confirmation for improved reward-to-risk ratios
HMT v4.0:
- Incorporated buying and selling pressure in lower timeframes to enhance the probability of trending moves while optimizing entry timing and scaling
HMT v4.1:
- Enhanced take-profit (TP) target by incorporating market structure analysis
HMT v5 :
Date: 23/01/2025
- Refined wave analysis for trending conditions
- Incorporated lower timeframe (LTF) momentum to strengthen trend reliability
- Re-aligned and re-balanced entry conditions for improved accuracy
HMT v6 :
Date : 15/02/2025
- Integrated strong accumulation activity into in-depth wave analysis
HMT v7 :
Date : 20/03/2025
- Refined wave analysis along with accumulation and market sentiment
HMT v8 :
Date : 16/04/2025
- Fully restructured strategy logic
HMT v8.1 :
Date : 18/04/2025
- Refined Take Profit (TP) logic to be more conservative for improved win consistency

OilusdEASYMARKETS:OILUSD
This wave analysis is one of many possible scenarios and is not a recommendation to buy or sell

TRUMP/USDTKey Level Zone: 12.750 - 13.500
HMT v8.1 detected. The setup looks promising, supported by a previous upward/downward trend with increasing volume and momentum, presenting an excellent reward-to-risk opportunity.
HMT (High Momentum Trending):
HMT is based on trend, momentum, volume, and market structure across multiple timeframes. It highlights setups with strong potential for upward movement and higher rewards.
Whenever I spot a signal for my own trading, I’ll share it. Please note that conducting a comprehensive analysis on a single timeframe chart can be quite challenging and sometimes confusing. I appreciate your understanding of the effort involved.
Important Note :
Role of Key Levels:
- These zones are critical for analyzing price trends. If the key level zone holds, the price may continue trending in the expected direction. However, momentum may increase or decrease based on subsequent patterns.
- Breakouts: If the key level zone breaks, it signals a stop-out. For reversal traders, this presents an opportunity to consider switching direction, as the price often retests these zones, which may act as strong support-turned-resistance (or vice versa).
My Trading Rules
Risk Management
- Maximum risk per trade: 2.5%.
- Leverage: 5x.
Exit Strategy
Profit-Taking:
- Sell at least 70% on the 3rd wave up (LTF Wave 5).
- Typically, sell 50% during a high-volume spike.
- Adjust stop-loss to breakeven once the trade achieves a 1.5:1 reward-to-risk ratio.
- If the market shows signs of losing momentum or divergence, ill will exit at breakeven.
The market is highly dynamic and constantly changing. HMT signals and target profit (TP) levels are based on the current price and movement, but market conditions can shift instantly, so it is crucial to remain adaptable and follow the market's movement.
If you find this signal/analysis meaningful, kindly like and share it.
Thank you for your support~
Sharing this with love!
HMT v2.0:
- Major update to the Momentum indicator
- Reduced false signals from inaccurate momentum detection
- New screener with improved accuracy and fewer signals
HMT v3.0:
- Added liquidity factor to enhance trend continuation
- Improved potential for momentum-based plays
- Increased winning probability by reducing entries during peaks
HMT v3.1:
- Enhanced entry confirmation for improved reward-to-risk ratios
HMT v4.0:
- Incorporated buying and selling pressure in lower timeframes to enhance the probability of trending moves while optimizing entry timing and scaling
HMT v4.1:
- Enhanced take-profit (TP) target by incorporating market structure analysis
HMT v5 :
Date: 23/01/2025
- Refined wave analysis for trending conditions
- Incorporated lower timeframe (LTF) momentum to strengthen trend reliability
- Re-aligned and re-balanced entry conditions for improved accuracy
HMT v6 :
Date : 15/02/2025
- Integrated strong accumulation activity into in-depth wave analysis
HMT v7 :
Date : 20/03/2025
- Refined wave analysis along with accumulation and market sentiment
HMT v8 :
Date : 16/04/2025
- Fully restructured strategy logic
HMT v8.1 :
Date : 18/04/2025
- Refined Take Profit (TP) logic to be more conservative for improved win consistency

Believe or Not- Blue SeasonBefore Donald Trump gets credit based on tariff's or anything like that I wanted to share the future of SPX 500 with everyone. It's definitely about to explode to a new all time high. Watch and learn. Market 101- Let's go USA!

GOLD - WAVE 4 CORRECTION TO $2,800 (UPDATE)Gold still dipping lower as I said would happen during my video analysis. We've seen a 'BOS' on the 1H TF, followed by a retest, now we're hoping for a continuation to the downside.
But get ready to buy the huge, discounted dip back up📈

Btc.d targetting lows.This is the short term target.
* The purpose of my graphic drawings is purely educational.
* What i write here is not an investment advice. Please do your own research before investing in any asset.
* Never take my personal opinions as investment advice, you may lose your money.

JPYCHF is going to boom....uphere we should have to look at the week chart , there we get an opportunity to get billions of dollars.... very easily..... hurrrrryyyy

Palo Alto Networks: Countermovement or Breakout?Palo Alto has faced increasing upward pressure and has been noticeably pushed higher. Thus, the stock is ogling our alternative scenario, which envisions a direct breakout above the resistance level at $207.24. In this 30% likely scenario, we would attribute the last low to the beige wave alt.IV and prepare for a new high of the blue wave alt.(I). Primarily, however, we classify the recent gains as a countermovement and locate the stock already in the bearish blue wave (II), which should settle its low within the blue Target Zone between $104.74 and $55.73; prior to that, the price must fall below the support at $130.04. After the wave (II) low, a new (wave (III)) uptrend should begin and eventually lead to new all-time highs above $207.24.

Long Position After failing to break the current support, price is likely to reversed to the upside and retest the previous resistance which was a resistance and if enough momentum it should break this resistance and swip the upside liquidity

EWTSU eurousd H1 subminuette wave (y) update
EWTSU eurousd H1 update
The three-wave corrective move (w)(x)(y) appears to be over
micro wave ((5)) should follow in 5 waves
invalidation : area 1.1330

GBPJPY Massive Short! SELL!
My dear friends,
Please, find my technical outlook for GBPJPY below:
The instrument tests an important psychological level 191.57
Bias - Bearish
Technical Indicators: Supper Trend gives a precise Bearish signal, while Pivot Point HL predicts price changes and potential reversals in the market.
Target - 189.14
Recommended Stop Loss - 192.84
About Used Indicators:
Super-trend indicator is more useful in trending markets where there are clear uptrends and downtrends in price.
Disclosure: I am part of Trade Nation's Influencer program and receive a monthly fee for using their TradingView charts in my analysis.
———————————
WISH YOU ALL LUCK

CADCHF Technical Analysis! SELL!
My dear friends,
CADCHF looks like it will make a good move, and here are the details:
The market is trading on 0.5967 pivot level.
Bias - Bearish
Technical Indicators: Supper Trend generates a clear short signal while Pivot Point HL is currently determining the overall Bearish trend of the market.
Goal - 0.5902
Recommended Stop Loss - 0.6001
About Used Indicators:
Pivot points are a great way to identify areas of support and resistance, but they work best when combined with other kinds of technical analysis
Disclosure: I am part of Trade Nation's Influencer program and receive a monthly fee for using their TradingView charts in my analysis.
———————————
WISH YOU ALL LUCK

Canopy Growth Corporation – High-Risk, High-Reward SpeculationThe stock of Canopy Growth Corporation experienced an unprecedented rally following its initial public offering (IPO). After a brief correction phase, the share price surged from CAD 0.25 to an all-time high of CAD 744.50 within four and a half years — an increase of over 244,000%. A sharp decline followed, interrupted by a temporary rebound that reached a new record high of CAD 766.80. This movement marked the beginning of a massive correction phase during which the stock dropped to CAD 1.09 — a loss of more than 99% from its peak.
At the low point of this move, a five-wave impulse structure emerged for the first time, which, according to Elliott Wave Theory, could indicate the potential end of the larger corrective Wave 2.
The following analysis takes a closer look at this initial impulse, including the resulting price development and potential entry zones for speculative investors. The analysis is based on Elliott Wave Theory and reflects a subjective market interpretation. The corresponding wave count can be found in the attached chart.
Market Structure According to Elliott Wave Theory
On April 9, 2025, Canopy's stock marked the low of the overarching Wave 2 at CAD 1.09. By April 25, 2025, a complete five-wave impulse had developed, ending at CAD 2.26. Since then, the price has been undergoing a corrective Wave 2.
This correction is unfolding in a classic A-B-C pattern with an internal 3-3-5 structure. Currently, the final downward movement — Wave C — is in progress, within which the corrective, slightly upward-directed Wave 4 is developing. Wave 4 is expected to conclude at one of the following Fibonacci retracement levels of the preceding Wave 3:
• 0.214 at CAD 1.85
• 0.382 at CAD 1.94
• 0.500 at CAD 1.99
The completion of Wave 4 is anticipated within this price range (CAD 1.85 – 1.99). This should be followed by the final Wave 5 within Wave C. A specific price target for Wave 5 can only be determined once Wave 4 is fully formed.
However, based on the larger Wave 1, a target zone for the end of the corrective Wave 2 can already be projected. Relevant retracement levels include:
• 0.618 at CAD 1.54
• 0.786 at CAD 1.34
• 0.887 at CAD 1.22
Given the relatively small market capitalization of currently around CAD 350 million, a test of the lower retracement levels at CAD 1.34 or even CAD 1.22 seems likely. Nevertheless, a premature reversal from CAD 1.54 is also possible.
Conclusion: Speculative Accumulation Zone and Price Targets
From a technical standpoint, the accumulation zone of interest for Canopy Growth lies between CAD 1.54 and CAD 1.22. Entering this range could represent a speculative opportunity with a high risk-reward ratio.
Following the completion of Wave 2, an upward-directed Wave 3 could aim for a minimum price target of CAD 2.99. Further extensions to CAD 3.44 or even CAD 4.16 are conceivable. Starting from the 0.618 retracement level at CAD 1.54, even the minimum target would represent a potential price gain of +94.5%.
Should this structure confirm itself in the larger time frame and develop into a broader five-wave impulse, long-term price targets in the range of CAD 1,240 to CAD 2,007 could be reached. This would imply a price increase of over 80,000% to 130,000% from the CAD 1.54 level. However, such a development would likely take several years.
Risk Disclaimer
Canopy Growth Corporation stock remains a highly volatile speculative investment. Given the extreme fluctuations and currently weak fundamental metrics, alongside the potential for extraordinary returns, there is always a corresponding risk of total loss. Investors should be fully aware of these risks and choose an appropriately sized position.
______________________________________________________________________
📌 Quick Summary – Canopy Growth (CGC)
🚀 Massive rally from CAD 0.25 → 766.80 (+244,000%), followed by >99% crash
📉 Current price structure suggests potential bottoming at CAD 1.09
🔁 Corrective Wave 2 (ABC structure) in progress — nearing final Wave C
🎯 Final Wave 2 target zone:
• CAD 1.54 (0.618 Fib)
• CAD 1.34 (0.786 Fib)
• CAD 1.22 (0.887 Fib)
📈 Speculative Buy Zone:
CAD 1.22 – 1.54 ✅
💡 Minimum Target (Wave 3):
CAD 2.99 (+94.5% from CAD 1.54)
🚀 Extended Targets:
CAD 3.44 – 4.16
🌌 Long-Term Potential (if macro impulse confirms):
CAD 1,240 – 2,007 (+80,000% to +130,000%)
⚠️ Risk Note: Highly speculative, extreme volatility, total loss possible. Trade with discipline & proper sizing.

EURUSD Technical Analysis! BUY!
My dear followers,
I analysed this chart on EURUSD and concluded the following:
The market is trading on 1.1364 pivot level.
Bias - Bullish
Technical Indicators: Both Super Trend & Pivot HL indicate a highly probable Bullish continuation.
Target - 1.1417
About Used Indicators:
A super-trend indicator is plotted on either above or below the closing price to signal a buy or sell. The indicator changes color, based on whether or not you should be buying. If the super-trend indicator moves below the closing price, the indicator turns green, and it signals an entry point or points to buy.
Disclosure: I am part of Trade Nation's Influencer program and receive a monthly fee for using their TradingView charts in my analysis.
———————————
WISH YOU ALL LUCK

GBPJPY bearish move🔹 Pair / TF | GBP/JPY, 1 h → 15 m |
| 🔹 Bias | Bearish (selling the break of support) |
1. 📊 Key Levels
Level Price Role
R1 191.721 Major resistance (green)
Broken Support 190.65 (black line) Minor support → now resistance
R4 189.828 Next minor support
R2 189.355 Next major support
2. 🚨 Trigger
Price closes below the 190.65 support (black line) on 1 h, AND
200-hour MA (red) has just been rejected—sellers stepping in.
This decisive break flips 190.65 into new resistance.
3. ✅ Confirmation
RFI oscillator on 15 m dips below its rising trendline and fails to reclaim it.
Momentum is clearly bearish—no divergence or oversold reversal signal.
4. 🎯 Entry & Stops
| 🔶 Entry Zone | 0.19060–0.19050 (just below 190.65) | | 🔴 Stop-Loss | 0.19180 (above R1 at 191.72) ≈ 120 pips |
Place a Sell-Stop at 0.19055 (mid-zone).
Risk: 1–2% of account on ~120-pip SL.
5. 🎯 Profit Targets
Target Level Pips RRR
T1 R4 189.828 ~82 pips 1 : 0.7
T2 R2 189.355 ~125 pips 1 : 1
Scale out:
Exit ½ at T1.
Let the rest run to T2.
6. ⚙️ Trade Management
Move SL to breakeven once +40 pips in profit.
Monitor RFI on 15 m:
If RFI spikes above its trendline before T1, close remaining.
Adjust if you see large wicks or volume spikes into support zones.
7. 🔑 Rationale
Support→Resistance flip at 190.65 gives a logical entry & SL.
200-hour MA rejection confirms sellers overpowering buyers.
RFI confirms sustained bearish momentum.
High RRR (>1 : 1) ensures edge even with a moderate win-rate.
⚡ Highlight:
This is a bank-order-flow style fade—selling the break of minor support after a MA confluence test, riding momentum into larger support zones.

EURGBP: Long Signal Explained
EURGBP
- Classic bullish setup
- Our team expects bullish continuation
SUGGESTED TRADE:
Swing Trade
Long EURGBP
Entry Point - 0.8501
Stop Loss - 0.8468
Take Profit - 0.8557
Our Risk - 1%
Start protection of your profits from lower levels
Disclosure: I am part of Trade Nation's Influencer program and receive a monthly fee for using their TradingView charts in my analysis.
❤️ Please, support our work with like & comment! ❤️

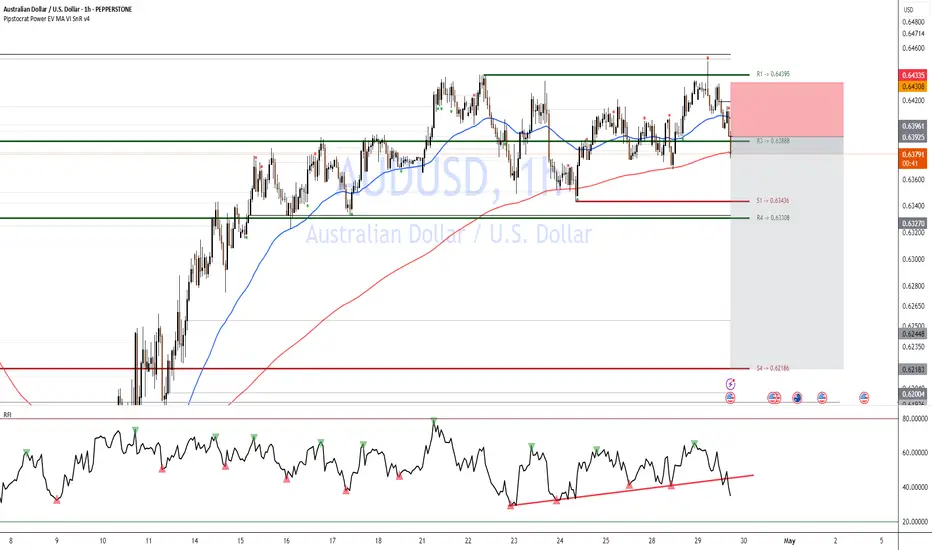
AUSSIE bearish move Short-setup: Breakdown of Support (AUD/USD)
Trigger: Price has decisively broken below R3 (0.63888) and the 200-hour MA (red) on the 1h chart.
Confirmation: RFI just dipped below its ascending trendline and failed to reclaim it—momentum is bearish.
Entry: Short at market 0.6385–0.6380 (just below R3).
Initial Stop: Above R1 (0.64395) ≈ 55 pips stop.
Targets:
T1: S1 (0.63436) (~40 pips → RRR ≈ 1 : 0.7)
T2: R4 (0.63308) (~55 pips → RRR ≈ 1 : 1)
⚡ Highlight: This is a bank-order-flow style fade—selling the break of minor support after a test of the 200-hour MA confluence.
🔑 Rationale
Support→Resistance flip at R3 gives logical entry & SL.
200-hour MA rejection confirms sellers overpowering buyers.
RFI confirms sustained bearish momentum.
High RRR (>1:1) ensures edge even with moderate win-rate.
NZDUSD Bearish moveShort-setup: breakdown of support
Trigger: Price has decisively broken below S1 (0.59337) and the 200-hour MA (red) on the 1h chart.
Confirmation: RFI just dipped below its ascending trendline and failed to reclaim it—momentum is bearish.
Entry: Short at market 0.5930–0.5925 (just below S1).
Initial Stop: Above R2 at 0.5944 (≈15-18 pips stop).
Targets:
T1: S2 at 0.5886 (~45 pips → RRR ≈ 1:3)
T2: R3 (long-term) at 0.5853 if momentum stays strong (~75 pips → RRR ≈ 1:5)
⚡ Highlight: This is a bank-order-flow style fade—selling the break of the minor support after a test of the 200-hour MA confluence.

EWTSU XAUUSD H4 minute wave ((5)) monitoring
Elliott wave trade setup H4
monitoring the start of minute wave ((5))
minute wave ((5)) should develope in 5 motive waves (impulsive/leading diagonal)
confirmation level: price break up steadly over 3350 area
invalidation level: price break steadly lower 3275 area

NZDUSD: Bullish Forecast & Bullish Scenario
The recent price action on the NZDUSD pair was keeping me on the fence, however, my bias is slowly but surely changing into the bullish one and I think we will see the price go up.
Disclosure: I am part of Trade Nation's Influencer program and receive a monthly fee for using their TradingView charts in my analysis.
❤️ Please, support our work with like & comment! ❤️

Will BNB break through the important $600 level?In this idea I marked the important levels for this week and considered a few scenarios of price performance
If the local trend line breaks down, we can expect further correction to the first support zone, also near the 0.382 Fibonacci level
Write a comment with your coins & hit the like button and I will make an analysis for you
The author's opinion may differ from yours,
Consider your risks.
Wish you successful trades! MURA

AUDCHF: Bulls Will Push Higher
It is essential that we apply multitimeframe technical analysis and there is no better example of why that is the case than the current AUDCHF chart which, if analyzed properly, clearly points in the upward direction.
Disclosure: I am part of Trade Nation's Influencer program and receive a monthly fee for using their TradingView charts in my analysis.
❤️ Please, support our work with like & comment! ❤️
