Is growth over? What to expect next for Bitcoin ?In this idea I marked the important levels for this week and considered a few scenarios of price performance
Important support will be at 90k, the price may show a local rebound from the level before showing further decline within the correction
Write a comment with your coins & hit the like button and I will make an analysis for you
The author's opinion may differ from yours,
Consider your risks.
Wish you successful trades! MURA
Wave Analysis

GBP/JPY Short, GBP/USD Short, AUD/CAD Short and AUD/USD ShortGBP/JPY Short
Minimum entry requirements:
• If structured 1H continuation forms, 1H risk entry within it.
GBP/USD Short
Minimum entry requirements:
• Corrective tap into area of value.
• 4H risk entry or 1H risk entry after 2 x 1H rejection candles.
Minimum entry requirements:
• Tap into area of value.
• 1H impulse down below area of value.
• If tight non-structured 5 min continuation follows, reduced risk entry on the break of it.
• If tight structured 5 min continuation follows, reduced risk entry on the break of it or 5 min risk entry within it.
• If tight non-structured 15 min continuation follows, 5 min risk entry within it if the continuation is structured on the 5 min chart or reduced risk entry on the break of it.
• If tight structured 15 min continuation follows, reduced risk entry on the break of it or 15 min risk entry within it.
AUD/CAD Short
Minimum entry requirements:
• 1H impulse down below area of value.
• If tight non-structured 15 min continuation follows, 5 min risk entry within it if the continuation is structured on the 5 min chart or reduced risk entry on the break of it.
• If tight structured 15 min continuation follows, reduced risk entry on the break of it or 15 min risk entry within it.
AUD/USD Short
Minimum entry requirements:
• 1H impulse down below area of interest.
• If tight non-structured 15 min continuation follows, 5 min risk entry within it if the continuation is structured on the 5 min chart or reduced risk entry on the break of it.
• If tight structured 15 min continuation follows, reduced risk entry on the break of it or 15 min risk entry within it.

Correction Within the Trend — Silver Update📉 Silver — Correction in Wave (ii)
After a strong impulse from April 7 to 25, silver is now in a wave (ii) correction. These second waves are often sharp, but we’re entering a promising long zone between 30.7–31.7.
🔍 A potential reaction may come from the vWap, VAL, or the 0.38 Fib imbalance area.
🧭 This setup fits perfectly into my broader outlook on silver — read the full breakdown here:
👉
📈 The target for the third wave remains around $35+.

Daily live trade with XAUUSD in 15m/30m/1h 20250505Daily live trade with XAUUSD in 15m/30m/1h 20250505

Gold might be busy with wave b for abc correction. If we only pullback to fib level between 50 - 68%, and get bearish confirmation we might start with leg C. But is also possible that if we go past ATH we might be busy with Wave 5.

Apple UpdateNot much to add to my Apple analysis. Price is behaving accordingly. As of now, price is in a spot where it needs to make a decision. Both patterns I am tracking suggest a continued move lower. The question is: will it fall to the turquoise box, implying that minor B is already complete? Or will it fall slightly lower to the grey target box competing minor B at that time.
Both patterns I am tracking point to the upper grey target box for intermediate wave (B) eventually. Intermediate (A) took just over 100 days to complete. If (B) is to follow suit, then we still have another 75 days or so until it completes. It doesn't have to take that long as no rules govern time duration. That's just an educated guess on the likely time frame we're looking at. It is for this reason I lean towards the white count. Hopefully we will find out or at least get more clues to the more immediate count this week.

Major Confluence Area for BTCBTC bulls have been very excitable recently but BTC has not yet done anything outside of a common bull trap norms.
The rally to 95K was perfectly inside the scope of a correction, see below idea;
Now we're into the biggest test area so far;
We have a possible butterfly (corrective pattern).
We have a possible 76 retracement (Corrective pattern)
We have a retest of the logical resistance (Corrective pattern).
If BTC is able to break through these this would be extremely positive. There's be no classical bear case to be made and failing funky bull traps this would likely develop into a good trend leg.
But if it's a bull trap, then this rally helps us to plan the downside levels (Which have not changed much).

US30 Eyes 41,300: Bullish Momentum Builds for Major BreakoutTechnical Analysis: The US30 has established a strong support base at 40500, with major support at 40000 serving as a safety net. Price action shows an upward channel formation on the 4-hour chart, indicating potential trend reversal. The risk-reward ratio of 1.60 (500 points risk for 800 points potential reward) provides favorable trading conditions. Recent price action demonstrates higher lows, suggesting accumulation phase and bullish momentum building.
Sentiment Analysis: Market sentiment shows cautious optimism despite recent volatility. Institutional investors maintain bullish positions, particularly in technology and energy sectors. The AAII Investor Sentiment Survey indicates decreased bullish sentiment, which often serves as a contrarian indicator suggesting potential upside movement. Economic forecasts pointing toward a soft landing rather than hard recession support continued equity market strength.
Support and Resistance Levels: Entry zone established around 40500, supported by historical price action and recent consolidation patterns. Major support at 40000 provides clear stop loss level, limiting downside risk. Target of 41300 aligns with previous resistance zone, offering realistic profit objective before encountering major resistance at 41500. Multiple tests of support levels have created strong foundation for upward movement.
Trade Management: Entry: 40500 Stop Loss: 40000 (500 points risk) Target: 41300 (800 points reward) Risk/Reward: 1.60
Additional Considerations: Recent market correction has created oversold conditions, suggesting potential mean reversion toward higher levels. Institutional buying pressure remains strong, with increased volume on upward movements. Technical indicators suggest room for upside before reaching overbought conditions. The 2024 performance showing 12.88% gain supports continued bullish momentum.
The combination of strong technical setup, positive institutional sentiment, and clearly defined support/resistance levels presents a compelling case for longing US30 with 41300 target. The favorable risk-reward ratio and multiple confirmation factors enhance the probability of successful trade execution.

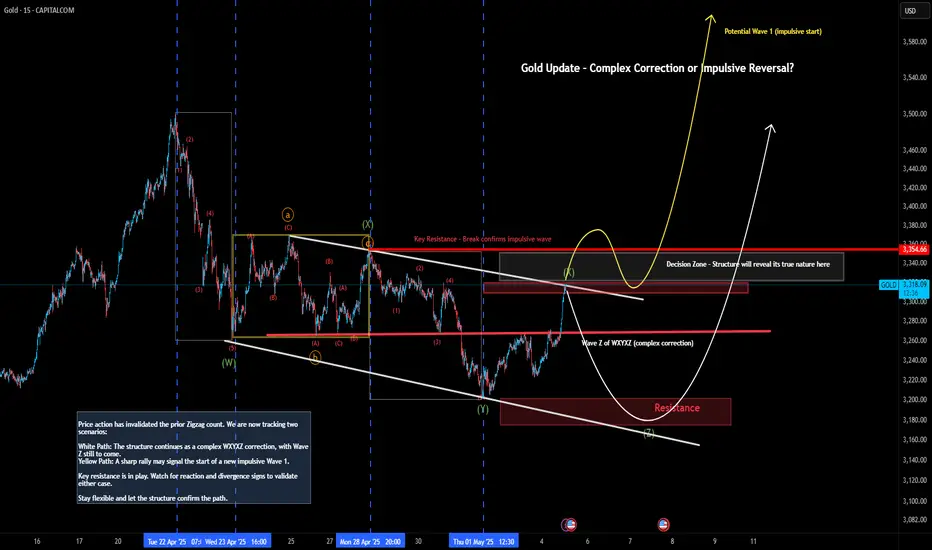
Gold Update – Complex Correction or Impulsive Reversal?
Price action has invalidated the prior Zigzag count. We are now tracking two scenarios:
White Path: The structure continues as a complex WXYXZ correction, with Wave Z still to come.
Yellow Path: A sharp rally may signal the start of a new impulsive Wave 1.
Key resistance is in play. Watch for reaction and divergence signs to validate either case.
Stay flexible and let the structure confirm the path.
HBL PROBABLY IN WAVE '' C '' OR " X " - SHORTThis is in continuation of our HBL wave count/idea shared earlier.
HBL is most probably in wave C or X which will take price down towards 127-122 range area,
prices are currently at a resistance level which has acted as a strong support previously therefore we are confident that it should hold and keep prices from climbing up.
We will short sell HBL once price break below 146.80 level and will target 133-130 range and further down 124-122 range, however prices might reach 160 before starting its decline. Alternately if prices break above 163 then this trade setup will get invalidated.
Although the risk/reward ratio is not that impressive but looking at the overall stock market momentum and geopolitical unrest, we have a little more confidence in this trade.
Trade setup:
Entry price: 146.80
Stop loss: 163
Targets:
T1: 133-130
T2: 124-122
Let see how this plays, Good Luck!
Disclaimer: The information presented in this wave analysis is intended solely for educational and informational purposes. It does not constitute financial or trading advice, nor should it be interpreted as a recommendation to buy or sell any securities.

Gold shorts coming?
Gold broke through and fell sharply, hitting the lowest level of 3200, breaking the previous shock pattern.
Friday's non-agricultural data was unexpectedly negative, and the rebound was under pressure at the top and bottom conversion level of 3268. The daily line closed with a cross K, and the overall shock remained.
Driving logic changes, and the impact of the tariff war weakens
The tariff tension that pushed gold to 3500 in the early stage has gradually eased, and the market focus has shifted to the Fed's policy.
The Fed's interest rate cut expectations have been postponed, and the non-agricultural data is strong, which strengthens the Fed's position of maintaining high interest rates, and gold is under pressure in the short term.
ETF positions continue to decrease. The world's largest gold ETF has continued to reduce its positions since it peaked on April 22, reflecting the bearish sentiment in the market.
Technical analysis
The daily structure, the cross K followed by three consecutive negatives, is usually a signal of continued decline. Combined with the bearish fundamentals, the probability of downward movement is relatively high.
The adjustment is not over yet, and attention should be paid to whether 3160 (61.8% golden ratio) can form support.
Short-term trend
The hourly chart rebound is weak, and the 100-day moving average continues to be under pressure, and the trend is still bearish.
Key positions and operation strategies
Pressure level: 3268-3275 (top and bottom conversion position), the extreme pullback does not break the 3280 watershed.
Support level: 3222-3224 (short-term support), break down to the 3200 mark, further target 3160.
Strategy:
Short at the beginning of the week based on the 3275-3268 pressure level, stop loss above 3280, target 3220-3200.
If it falls below 3200, follow up with short orders to 3160; if it stabilizes, observe the reversal signal.
Summary
Gold is dominated by shorts in the short term, and the operation is mainly rebound shorting, focusing on the Fed's policy expectations and the performance of the key support of 3160.

EURJPY → False breakout of strong resistance at 164.FX:EURJPY rallies on news and reaches an important milestone. The liquidity pool formed above 164.00 may prevent the price from rising. There is a high chance of a false breakout.
Against the backdrop of the dollar's growth caused by PMI news, the currency pair is forming a retest of the key resistance level of 164.188 as part of a consolidation distribution and, with no possibility of continuing its growth, is making a false breakout.
Consolidation in the sell zone (below 164.188) will trigger a reversal and a fall.
Overall, the situation is neutral, with the market in a sideways range, and a false breakout could lead to a correction or reversal of the local trend.
Resistance levels: 164.188
Support levels: 163.17, 162.57
The formation of a reversal pattern relative to resistance and price consolidation below the level could give a good signal for a reversal.
Best regards, R. Linda!


ATOM 4H – Potential Wave 3 Impulse SetupAfter a completed 5-wave impulse (likely Wave 1), followed by a corrective Wave 2, ATOM appears to be setting up for a potential Wave 3 to the upside based on Elliott Wave Theory.
This setup aligns with the idea of Wave 3 being typically the strongest and most extended move in the cycle.
📍Entry Zone: $3.90 – $4.30
🎯Take Profit (TP): $6.463
🛑Stop Loss (SL): $3.70
🌀Risk-Reward: Approx. 4:1

Gold prices surge as risk aversion risesGold has now broken through strongly and stabilized above 3350. Gold fell back in the Asian session and went long. Gold bulls restarted and accumulated energy. Now gold bulls obviously occupy a dominant position. Gold fell back in the Asian session and could only go long. For the current market, don't chase it easily. The market fluctuates too much. Wait patiently for the opportunity to go long after the decline.
The 1-hour moving average of gold has begun to cross upward to form a golden cross. Gold bulls have begun to exert their strength. After gold broke through the 3350 line yesterday, gold fell back to around 3305 and continued to exert its strength. In the short term, 3350 is the key to the turning point of gold bulls and bears. Gold fell back to 3350 in the early trading, which is an opportunity to go long on dips.
The market changes rapidly. Since gold bulls are more powerful at the moment, gold will continue to go long. After the adjustment of gold bulls, the bottom rose. Then the gold bulls may have just begun, and the gold bulls are expected to continue to rise.
Buy range: 3350-3348, SL: 3338, TP: 3370-3380
Sell range: 3395-3397, SL: 3407, TP: 3375-3365
Key points:
First support: 3350, second support: 3340, third support: 3330
First resistance: 3390, second resistance: 3400, third resistance: 3410
For more free sharing, please click on my avatar

BTCUSDT LONG/BUYBy utilizing Fibonacci retracement levels, historical patterns, , we can formulate a hypothesis that the market might follow a similar trajectory if bullish sentiment prevails.

GoldXAUUSD
- Falling Wedge in Long Time Frame
- Completed " 12345 " Impulsive Waves and " ABC " Corrective Waves
- Break of Structure
- Symmetrical Triangle as an Corrective Pattern in Short Time Frame
- Demand Zone
Nasdaq: The Rally Continues!The Nasdaq ended last week with strong upward momentum, moving swiftly toward the resistance at 20,694 points. Now it's getting interesting: once the index breaks above this mark, it should quickly enter our upper turquoise Target Zone (coordinates: 21,751 – 22,425 points), where we expect the peak of wave X in turquoise. Afterward, we anticipate a pullback during wave Y, which should aim for our lower turquoise Target Zone (coordinates: 17,074 – 15,867 points). The corrective magenta wave (4) should be completed there. However, if the Nasdaq directly surpasses the significant resistance at 23,229 points, our alternative scenario will take effect. In this 35% likely case, we would consider wave alt.(4) as already complete and locate the index in the impulsive wave alt.(5) .

GOLD SELL ZONE The $3271:$3272 sell zone for gold might be due to several factors:
- *Resistance Level*: This price range could be acting as a resistance level, where gold prices face selling pressure or struggle to break through.
- *Profit-Taking*: Investors might be selling gold at this price range to secure profits, especially if they've seen significant gains recently.
- *Technical Analysis*: Traders may be using technical indicators, such as moving averages or Relative Strength Index (RSI), to identify $3271:$3272 as a selling opportunity.
- *Market Sentiment*: Shifts in market sentiment, driven by news or economic data, could lead to increased selling pressure around $3271:$3272.

GOLD / XAUUSD: Breaking the down channel (correction wave)Therefore, if the 21-day SMA holds in the event of a weak US Non-Farm Payroll (NFP) report, a rebound toward the immediate static support-turned-resistance at 3260 could occur.
A sustained move above that level would encourage Gold buyers to push further toward the former channel support, now acting as resistance, at 3405.

TESLA: Bearish Continuation & Short Signal
TESLA
- Classic bearish formation
- Our team expects fall
SUGGESTED TRADE:
Swing Trade
Sell TESLA
Entry Level - 287.25
Sl - 299.67
Tp - 259.90
Our Risk - 1%
Start protection of your profits from lower levels
Disclosure: I am part of Trade Nation's Influencer program and receive a monthly fee for using their TradingView charts in my analysis.
❤️ Please, support our work with like & comment! ❤️

Gold Rally Continues (Bullish)XAUUSD (GOLD) 4H chart breaking out from Wave (4) with a clean Elliott Wave structure
Targeting the 3,480+ zone for Wave (5) — Fibonacci + EMA confluence + breakout confirmation all lining up!
Entry zone was right near the 0.5–0.618 fib sweet spot 🟦
Now we ride the wave
Current trade idea: Long bias
🎯 Target: $3,480
🛑 Risk: Below $3,166
🔍 Strategy: Wave theory + EMA trend confirmation + structure break
Let me know if you're in this move too — and drop a 🔥 if you caught the setup!

Nightly $SPY / $SPX Scenarios for May 6, 2025 🔮🔮
🌍 Market-Moving News 🌍
📉 Market Retreats Amid Tariff Concerns
U.S. stock markets declined on May 5, 2025, as investors reacted to potential tariffs and key earnings reports. The S&P 500 dropped 0.6%, and the Nasdaq decreased 0.7%. Notably, Palantir Technologies ( NASDAQ:PLTR ) fell nearly 8% in extended trading despite raising its full-year revenue forecast and exceeding Q1 revenue estimates.
🏛️ Fed Meeting Commences Amid Political Pressure
The Federal Reserve's two-day meeting begins today, with the central bank expected to maintain its benchmark interest rate at 4.25%-4.5%. Despite President Trump's calls for rate cuts, the Fed remains cautious due to inflationary risks from new tariffs and migration policies.
🎬 Entertainment Stocks Under Pressure
Streaming giants Netflix ( NASDAQ:NFLX ) and Disney ( NYSE:DIS ) experienced premarket losses of over 5% and 3%, respectively, following President Trump's proposal of a 100% tariff on foreign-made movies.
🏠 Housing Market Faces Challenges
The U.S. housing market is weakening due to persistent high mortgage rates and economic uncertainty driven by tariff policies. Mortgage rates, currently averaging 6.76%, have deterred both prospective buyers and sellers.
📊 Key Data Releases 📊
📅 Tuesday, May 6:
8:30 AM ET: U.S. International Trade in Goods and Services (March)
⚠️ Disclaimer:
This information is for educational and informational purposes only and should not be construed as financial advice. Always consult a licensed financial advisor before making investment decisions.
📌 #trading #stockmarket #economy #news #trendtao #charting #technicalanalysis
