NASDAQ: Bring On The Santa Rally! Short Term Buys!Welcome back to the Weekly Forex Forecast for the week of Dec. 22-26th.
In this video, we will analyze the following FX market: NASDAQ (NQ1!) NAS100
The NASDAQ is reaching towards the relative equal highs, and maybe with the help of a
Santa Rally, it gets their!
I like the fact that the market closed the last two days of last week with bullish candles. I expect to see some follow through into early next week.
Enjoy!
May profits be upon you.
Leave any questions or comments in the comment section.
I appreciate any feedback from my viewers!
Like and/or subscribe if you want more accurate analysis.
Thank you so much!
Disclaimer:
I do not provide personal investment advice and I am not a qualified licensed investment advisor.
All information found here, including any ideas, opinions, views, predictions, forecasts, commentaries, suggestions, expressed or implied herein, are for informational, entertainment or educational purposes only and should not be construed as personal investment advice. While the information provided is believed to be accurate, it may include errors or inaccuracies.
I will not and cannot be held liable for any actions you take as a result of anything you read here.
Conduct your own due diligence, or consult a licensed financial advisor or broker before making any and all investment decisions. Any investments, trades, speculations, or decisions made on the basis of any information found on this channel, expressed or implied herein, are committed at your own risk, financial or otherwise.
Weeklyoutlook

ES Weekly Outlook: Can the Santa Rally Carry ES Back to All TimeMacro Backdrop and Sentiment Over the Past Month
Over the past month, the macro narrative for ES has been defined by a gradual shift from momentum driven optimism to a more cautious and selective risk environment. Coming out of October, equities were supported by easing financial conditions, strong earnings from mega cap technology, and continued enthusiasm around productivity gains tied to AI investment. That optimism pushed ES to fresh all time highs by the end of October.
As November progressed, sentiment became more balanced. Market participants began to reassess forward growth expectations, the path of monetary policy, and the sustainability of stretched valuations. Rather than a sharp risk off move, the tape transitioned into a rotational regime where participants became increasingly responsive around well defined value areas.
This shift has resulted in slower tempo, overlapping value, and greater sensitivity to technical references rather than headline driven trend continuation. The market has increasingly rewarded patience, context, and execution around key levels as opposed to chasing momentum.
What the Market has done
• From the all time highs made at the end of October, the market rotated lower toward the 6605 area, which aligned with daily support. Responsive buyers entered aggressively at this level and successfully defended the level.
• Following the responsive buying, price auctioned higher toward the 6975 area, which aligned with daily resistance and the 5 November weekly value area high, where sellers responded and capped further upside.
• During the past week, the market broke below the first two weeks of December’s range and the composite value area, signaling a short term loss of acceptance at higher prices.
• Price then auctioned lower toward the 6780 area, which aligned with the 24 November weekly VPOC, where buyers once again responded and defended the level.
• Responsive buying from 6780 drove the price back higher toward the 6885 area, which sits near the 12 December weekly settlement and the two week composite value area low, reinforcing the broader balanced structure.
What to expect in the coming week
The key reference to frame the coming week is the previous week’s settlement at 6888.50.
Bullish scenario
• If the market can accept above 6888.50, expect an auction higher toward the 6970 area, which aligns with daily resistance, the 5 November weekly value area high, and the weekly 0.5 standard deviation high.
• Sellers are expected to respond in the 6970 area and attempt to rotate price back down
• If sellers fail to defend this area, continuation higher toward 7012 becomes likely, which aligns with all time highs and the weekly 1 standard deviation high.
Bearish scenario
• If the market is unable to accept above 6888.50, expect a move lower toward the 6827 area, which aligns with the previous week’s value area low and the weekly 0.5 standard deviation low.
• Buyers are expected to respond at 6827 to bid prices back up through value.
• If buyers fail to hold 6827, expect a continuation lower toward the 6780 area, which aligns with the previous week’s low, the 24 November weekly VPOC, and the weekly 1 standard deviation low.
Neutral scenario
• If the market is unable to extend meaningfully beyond 6970 on the upside or 6827 on the downside, expect the market to remain balanced and rotational.
• In this scenario, value is likely to continue shifting modestly higher as the market awaits the next catalyst.
Conclusion
ES remains in a broader balance regime where responsive trade dominates and initiative activity has struggled to sustain follow through. Until the market can show clear acceptance above resistance or below support, patience and level based execution remain critical. The previous week’s settlement at 6888.50 will act as the primary decision point this week that helps determine whether the market seeks higher prices, deeper balance, or continued two way trade. If seasonal Santa rally dynamics come into play, they may act as the catalyst that allows the market to regain initiative strength and auction back toward all time highs.
What is your take on ES? We would love to hear your view on it. Please give us your comments and give this a boost so that more traders in the community can participate. Thank you.
Disclaimer: This is not financial advice. Analysis is for educational purposes only; trade your own plan and manage risk.

US Dollar: Potentially Higher Prices In The Near TermWelcome back to the Weekly Forex Forecast for the week of Dec 22 - 26th.
In this video, we will analyze the following FX market: USD Dollar
The USD closed bullish last week. I expected price to move a bit higher in the near term.
towards the bearish OB, and into a -FVG. When the pullback indicates it is ending, that would be a good time to look for valid sells.
The move higher should happen between now and Tuesday. Short term .
Enjoy!
May profits be upon you.
Leave any questions or comments in the comment section.
I appreciate any feedback from my viewers!
Disclaimer:
I do not provide personal investment advice and I am not a qualified licensed investment advisor.
All information found here, including any ideas, opinions, views, predictions, forecasts, commentaries, suggestions, expressed or implied herein, are for informational, entertainment or educational purposes only and should not be construed as personal investment advice. While the information provided is believed to be accurate, it may include errors or inaccuracies.
I will not and cannot be held liable for any actions you take as a result of anything you read here.
Conduct your own due diligence, or consult a licensed financial advisor or broker before making any and all investment decisions. Any investments, trades, speculations, or decisions made on the basis of any information found on this channel, expressed or implied herein, are committed at your own risk, financial or otherwise.

NZDUSD: Bullish Momentum For 2 Weeks! Buy The Dip!Welcome back to the Weekly Forex Forecast for the week of Dec. 15 -19th.
In this video, we will analyze the following FX market: NZDUSD
NZDUSD is bearish on the HTFs, but it has started moving higher against a weakened USD.
The Daily shows the order flow is bullish, so there is no reason to sell this market in the short term.
Wait for the pullback, and by the dip.
Enjoy!
May profits be upon you.
Leave any questions or comments in the comment section.
I appreciate any feedback from my viewers!
Like and/or subscribe if you want more accurate analysis.
Thank you so much!
Disclaimer:
I do not provide personal investment advice and I am not a qualified licensed investment advisor.
All information found here, including any ideas, opinions, views, predictions, forecasts, commentaries, suggestions, expressed or implied herein, are for informational, entertainment or educational purposes only and should not be construed as personal investment advice. While the information provided is believed to be accurate, it may include errors or inaccuracies.
I will not and cannot be held liable for any actions you take as a result of anything you read here.
Conduct your own due diligence, or consult a licensed financial advisor or broker before making any and all investment decisions. Any investments, trades, speculations, or decisions made on the basis of any information found on this channel, expressed or implied herein, are committed at your own risk, financial or otherwise.

GBPUSD: Bullish! Wait To Buy The Dip!Welcome back to the Weekly Forex Forecast for the week of Dec 15 - 19th.
The GBP is stronger against a weakened USD, after the Fed cut the interest rate. It made gains in the second half of last week, and I expect that trend to continue into this week.
Be patient. Wait for the pullback for liquidity before the move up.
Enjoy!
May profits be upon you.
Leave any questions or comments in the comment section.
I appreciate any feedback from my viewers!
Like and/or subscribe if you want more accurate analysis.
Thank you so much!
Disclaimer:
I do not provide personal investment advice and I am not a qualified licensed investment advisor.
All information found here, including any ideas, opinions, views, predictions, forecasts, commentaries, suggestions, expressed or implied herein, are for informational, entertainment or educational purposes only and should not be construed as personal investment advice. While the information provided is believed to be accurate, it may include errors or inaccuracies.
I will not and cannot be held liable for any actions you take as a result of anything you read here.
Conduct your own due diligence, or consult a licensed financial advisor or broker before making any and all investment decisions. Any investments, trades, speculations, or decisions made on the basis of any information found on this channel, expressed or implied herein, are committed at your own risk, financial or otherwise.

EURUSD: Bullish! Buy The DIp!Welcome back to the Weekly Forex Forecast for the week of Dec 15 - 19th.
The EUR is stronger against a weakened USD, due to the interest rate cut by the Fed. I expect the bullishness to continue into next week.
Look for a pullback into the +FVG, and if there is a valid buy setup there on the LTFs, it should
be high probability to the upside.
Enjoy!
May profits be upon you.
Leave any questions or comments in the comment section.
I appreciate any feedback from my viewers!
Like and/or subscribe if you want more accurate analysis.
Thank you so much!
Disclaimer:
I do not provide personal investment advice and I am not a qualified licensed investment advisor.
All information found here, including any ideas, opinions, views, predictions, forecasts, commentaries, suggestions, expressed or implied herein, are for informational, entertainment or educational purposes only and should not be construed as personal investment advice. While the information provided is believed to be accurate, it may include errors or inaccuracies.
I will not and cannot be held liable for any actions you take as a result of anything you read here.
Conduct your own due diligence, or consult a licensed financial advisor or broker before making any and all investment decisions. Any investments, trades, speculations, or decisions made on the basis of any information found on this channel, expressed or implied herein, are committed at your own risk, financial or otherwise.

15/12/25 Weekly OutlookLast weeks high: $94,590.52
Last weeks low: $87,581.21
Midpoint: $91,085.87
A volatile yet directionless FOMC week comes to a close and a new week begins. As forecast the Fed cuts interest rates by 25bps, now at 3.75% (a 3-year low). Bitcoin reacted to the news with LTF volatility but in the end no direction as this cut had been forecast and priced in.
The weekly clearly capping any bullish move, multiple rejections from $94,500 with higher lows compressing price. Historically this compression pattern leads to an impulse move in a given direction. given what we have seen around the weekly high, if price cannot flip this level ($94,500) a continuation of the downtrend may be next as the bears are looking stronger as it stands. My key levels to look for are $84,000, $80,000 and $74,000. Should the weekly high be flipped and reclaimed $100,000 is the major test of resistance.
I am not sure if this week is too early to get our answer but I am planning for what the chart tells me. Until we get a confirmation on HTF direction the range is clear on the LTF.

Gold Weekly Playbook: Key Levels, Scenarios & Sentiment Triggers1. Macro Update
Gold continues to trade within a macro environment defined by shifting rate expectations and evolving recession probabilities. With the Fed maintaining a data-dependent stance, the market remains highly sensitive to inflation and employment prints. Cooling inflation supports the case for rate cuts, pulling real yields lower and creating a constructive backdrop for gold.
Conversely, stubborn inflation pushes the narrative toward “higher for longer,” often slowing upside momentum and encouraging more rotational price action. This doesn’t immediately turn GC bearish, but it does cap impulsive continuation as traders reassess forward guidance.
Recession sentiment is the second major driver. Rising recession odds tend to benefit gold as investors rotate into safe-haven assets, even without imminent Fed easing. A persistent soft-landing narrative—stable labor markets, steady consumption—can reduce defensive flows and temper gold’s velocity. Overall, the macro backdrop remains cautiously supportive, but still very catalyst-driven.
2. What Has the Market Done?
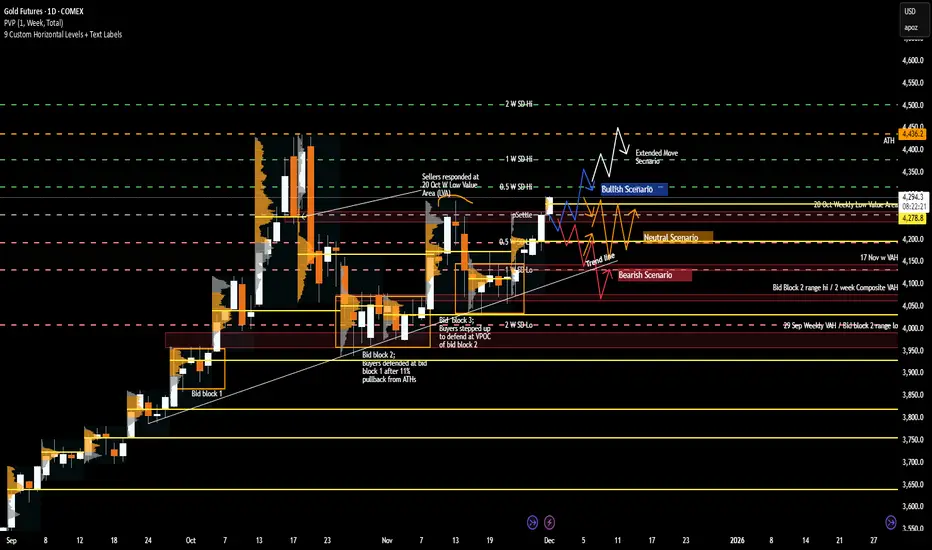
Gold has exhibited constructive price action, with the recent week imbalancing up and out of the 17 Nov weekly balance/value area. Importantly, the market closed at the highs of the week, signaling sustained buyer aggression and broad acceptance of higher prices.
Weekly value and Volume point of Control (VPOC) have shifted upward, reinforcing a meaningful change in participant behavior: buyers are willing to transact at progressively higher prices, and sellers have not shown the ability to force price back into prior balance. This upward migration of value marks a firm shift in short-term sentiment.
The market is also now at an important structural zone at 4251.3—the 13 Oct weekly VPOC and the 20 Oct weekly Low value area (LVA). How the market reacts at this level—rejecting, stalling, or accepting—will be a telling indicator of whether buyers maintain control or whether sellers can slow the advance.
3. What to Expect in the Coming Week
The key level to watch this week:
4254.9 - Previous week/month’s settlement price
This level acts as a major pivot for directional conviction. Holding above settlement supports the case for continuation; a sustained move below it increases the likelihood of rotation or deeper testing.
Bullish Scenario
If the market holds and accepts above 4254.9, upside continuation becomes likely.
Target 1: 4378.6 (Weekly 1 Standard Deviation (SD) High) – expect responsive sellers.
If market accepts above 4378.6:
Target 2: 4436.2 (ATH region) – extended bullish objective.
Bearish Scenario
If the market fails to hold above 4254.9, expect sellers to target 4195.3 (previous week’s VPOC).
Additional downside triggers:
If buyers cannot reclaim 4261.3 (previous week’s high), pressure may push price through prior value toward 4136.5.
If buyers then fail to reclaim back above 4195.3:
Next target: 4131.2 (Weekly 1 SD Low / 17 Nov VPOC / Bid Block 3 midpoint).
Continued seller control may extend the move toward 4070/80, aligned with the 2-week composite VAH and upper boundary of Bid Block 2.
Neutral Scenario
If neither buyers nor sellers show conviction, expect two-way consolidation around previous week’s settlement, 4254.9, between 4316.7 and 4193.1 (10 Nov weekly high / 20 Oct LVA / weekly 0.5 SD high).
This remains the most probable balance zone unless a macro catalyst drives breakout behavior.
This week’s structure is clean: one major pivot and clearly defined pathways for both sides. Whether GC breaks out or slips back into rotation will hinge on how price behaves around 4254.9.
What’s your outlook for Gold this week? Drop a comment and give this post a boost so more traders in the community can join the discussion!
Disclaimer: This is for educational purposes only and not financial advice. Always trade your own plan with proper risk management.
08/12/25 Weekly OutlookLast weeks high: $94,171.14
Last weeks low: $83,809.87
Midpoint: $88,990.51
Bitcoin performs a double Swing Fail Pattern (SFP) as price sweeps both extremities of the range before closing out near the midpoint. After such a dramatic drawdown during Q4 so far, the possibility of a V-shape reversal as the year comes to a close was never going to be a high probability. With that we have seen a steady base being built and a higher low printed, certainly a more bullish structure than last weeks opening.
This week we have FOMC on Wednesday:
Previous: 4.0%
Forecast: 3.75% (-25bps)
Actual: ?%
A 25bps cut is forecast with an 87% chance. Could this finally reignite some buyside volume? The timing of year end doesn't help, I think volume stays relatively subdued until 2026 where the Fed ending QT & lowering rates help risk-on assets. For now I will maintain that a $80,000-$100,000 range is where Bitcoin stays for some time, thin orderbooks creating short term volatility but not necessarily strong moves in either direction.

GBPUSD: Bullish! Buys Are Best Against A Weakened US Dollar!Welcome back to the Weekly Forex Forecast for the week of Dec 8 - 15th.
The GBPUSD is sitting in a +FVG that could send prices higher. As long as it holds, the bullish momentum over the last couple of weeks in this paper will continue.
Enjoy!
May profits be upon you.
Leave any questions or comments in the comment section.
I appreciate any feedback from my viewers!
Like and/or subscribe if you want more accurate analysis.
Thank you so much!
Disclaimer:
I do not provide personal investment advice and I am not a qualified licensed investment advisor.
All information found here, including any ideas, opinions, views, predictions, forecasts, commentaries, suggestions, expressed or implied herein, are for informational, entertainment or educational purposes only and should not be construed as personal investment advice. While the information provided is believed to be accurate, it may include errors or inaccuracies.
I will not and cannot be held liable for any actions you take as a result of anything you read here.
Conduct your own due diligence, or consult a licensed financial advisor or broker before making any and all investment decisions. Any investments, trades, speculations, or decisions made on the basis of any information found on this channel, expressed or implied herein, are committed at your own risk, financial or otherwise.

CORE5 WEEKLY WARMAP — 1 DECEMBER 2025The market opens the week with the dollar locked inside a well-defined range between 97.67 and 99.98. Price is sitting near the mid-zone around 98.60, showing no structural breakout. Until one of these levels is taken out with conviction, this is a rotation environment, not a trend environment.
Yields continue to firm. The 10-year is up about 1.63 percent and the 2-year roughly 1.66 percent. Higher yields paired with a rangebound dollar create a more selective backdrop for risk assets. ES holds strength inside its upper band, but rising volatility signals a shift toward more two-way movement. Gold liquidated last week’s high and remains in a two-month bullish range. Across the six-chart grid, the underlying message is the same: strength on the surface, tension underneath.
The calendar is dense. ISM Manufacturing, ADP employment, ISM Services, trade balance, consumer credit, Michigan sentiment, and the full employment situation report arrive in a tight cluster. Each print feeds directly into expectations for the Fed’s December path.
Through the CORE5 lens, the dollar’s range defines the entire week. Market Structure confirms a rotation box. Dynamic Geometry shows price in discount, favoring fast intraday swings rather than smooth trends. Volume Flow flipped bearish last week after failing the bullish daily range, turning prior volume shelves into supply. Order Flow across FX pairs remains bullish, removing justification for blind shorting of risk assets. Execution must stay high-frequency, level-to-level, and based on clear confirmation.
The weekly thesis is direct: markets are being driven by firm yields and a heavy sequence of U.S. data. This is a reaction-driven week, not a predictive one. Intraday rotations offer more clarity than directional conviction.
The takeaway: the dollar remains inside its box, yields are firm, and volatility is rising. Treat every level as a behavior test. Trade the rotations, not your opinions.
— CORE5DAN
Institutional Logic. Modern Technology. Real Freedom.

01/12/25 Weekly OutlookLast weeks high: $93,088.10
Last weeks low: $85,279.04
Midpoint: $89,183.57
A brutal start to the week for the bulls here. A -6% move to the downside as soon as the Month of December opens rejecting off the range weekly high. Across the high time frame this confirms a new lower high and a failure to get back within the trend that has stayed consistent throughout this bull market.
All of last weeks recovery bounce has been wiped out in a matter of hours, so now the question is where does the buy side pick up, if at all? FOMC interest rate decision is predicting another rate cut (80% probability) as well as the end of quantitative tightening and the beginning of quantitative easing on paper should bring more liquidity into risk-on markets such as Bitcoin, but that is on a longer timescale.
In the more immediate time frame I think the range broadly $80,000-$100,000 with this weeks range seeing a lot of the noisy PA. Midpoint is a key S/R level to gauge sentiment and conviction, a reclaim of the level may open the door to a stop loss hunt around weekly high but for now the momentum is definitely with the bears.

AUDUSD: Wait Until The Pullback Ends Before Selling!Welcome back to the Weekly Forex Forecast for the week of Dec. 1-5th.
In this video, we will analyze the following FX market: AUDUSD
AUDUSD had a surprisingly strong week. The weekly candle closed above the previous candle. This would indicate some follow through towards last week's high.
But... it is in a pullback on the HTFs, and could turn over mid to late week, towards the downside.
Wait for the market structure shift before entering new trades.
I'm sticking with the overall trend down until the market shifts the other way.
Enjoy!
May profits be upon you.
Leave any questions or comments in the comment section.
I appreciate any feedback from my viewers!
Like and/or subscribe if you want more accurate analysis.
Thank you so much!
Disclaimer:
I do not provide personal investment advice and I am not a qualified licensed investment advisor.
All information found here, including any ideas, opinions, views, predictions, forecasts, commentaries, suggestions, expressed or implied herein, are for informational, entertainment or educational purposes only and should not be construed as personal investment advice. While the information provided is believed to be accurate, it may include errors or inaccuracies.
I will not and cannot be held liable for any actions you take as a result of anything you read here.
Conduct your own due diligence, or consult a licensed financial advisor or broker before making any and all investment decisions. Any investments, trades, speculations, or decisions made on the basis of any information found on this channel, expressed or implied herein, are committed at your own risk, financial or otherwise.

24/11/25 Weekly OutlookLast weeks high: $96,057.33
Last weeks low: $93,034.53
Midpoint: $80,642.73
Has Bitcoin found its low, or is there more downside to come?
After yet another brutal week of downtrend BTC tags $80,000 before bouncing back towards the weekly range midpoint at $88,000, a +10% bounce. It's important to note that back in April during the Tariff War sell-off, the $80,000 area was the origin of the subsequent move up to $110,000. So historically this area should provide support when retested as it has initially.
What this does mean to me, the high time frame trend has shifted from bullish with areas of choppy rangebound consolidation before the next leg up, to now a new lower high ($108,000 rejection) which confirmed the 1d 200 EMA as resistance, and much lower low ($80,000 last weeks low) which confirms a bearish flip.
For me this week it's about finding out if the bottom is already in or if not, where will it be? In terms of bullish target should the bottom already be in, it's the $98,000-$100,000 area. This key s/r level has been an important battleground since December '24, it's a big even level too so psychologically important, and the origin of this 20% sell-off. Fear & Greed Index currently sits at 19 but hit as low as 11 over the weekend, the lowest so far this bull run. These factors have me leaning towards the local bottom is in.
However, if the bottom is not in then $74,000 comes into play, the Tariff war low. That would complete a full retrace of this years move up to $126,000 (-40% from high). The current weekly low sits at -36% move which is the largest of the bull run so far but not uncommon in previous cycles.
Good luck this week everybody!

Weekly FOREX Forecast: USDCAD, USDCHF & USDJPY Are Bullish!Welcome to Part 2 of The Weekly FOREX FORECAST!
Part 1 covered USD, EU, GU, AU, NU in the previous video.
In this video, we will analyze the following FX markets:
USD Index, USDCAD, USDCHF, and USDJPY.
Enjoy!
May profits be upon you.
Leave any questions or comments in the comment section.
I appreciate any feedback from my viewers!
Like and/or subscribe if you want more accurate analysis.
Thank you so much!
Disclaimer:
I do not provide personal investment advice and I am not a qualified licensed investment advisor.
All information found here, including any ideas, opinions, views, predictions, forecasts, commentaries, suggestions, expressed or implied herein, are for informational, entertainment or educational purposes only and should not be construed as personal investment advice. While the information provided is believed to be accurate, it may include errors or inaccuracies.
I will not and cannot be held liable for any actions you take as a result of anything you read here.
Conduct your own due diligence, or consult a licensed financial advisor or broker before making any and all investment decisions. Any investments, trades, speculations, or decisions made on the basis of any information found on this channel, expressed or implied herein, are committed at your own risk, financial or otherwise.

Weekly FOREX Forecast: USD Is Bullish Vs EUR, GBP, AUD NZDWelcome back to the Weekly Forex Forecast!
This is Part 1 of the FOREX futures outlook for the week of Nov 24-28th.
In this video, we will analyze the following FX markets:
USD Index, EUR, GBP, AUD, NZD
Enjoy!
May profits be upon you.
Leave any questions or comments in the comment section.
I appreciate any feedback from my viewers!
Like and/or subscribe if you want more accurate analysis.
Thank you so much!
Disclaimer:
I do not provide personal investment advice and I am not a qualified licensed investment advisor.
All information found here, including any ideas, opinions, views, predictions, forecasts, commentaries, suggestions, expressed or implied herein, are for informational, entertainment or educational purposes only and should not be construed as personal investment advice. While the information provided is believed to be accurate, it may include errors or inaccuracies.
I will not and cannot be held liable for any actions you take as a result of anything you read here.
Conduct your own due diligence, or consult a licensed financial advisor or broker before making any and all investment decisions. Any investments, trades, speculations, or decisions made on the basis of any information found on this channel, expressed or implied herein, are committed at your own risk, financial or otherwise.

[CRT] Early-Week Outlook for EURUSD [Candle Range Theory]Context:
During the week of November 10th, the European currencies EURUSD and GBPUSD attempted to attack their previous weekly high on Friday afternoon, so we speculated that the direction for the week of November 17th would be bearish, targeting the low of the week of November 3rd.
Last week this hypothesis was confirmed, with the weekly candle closing outside the body of the previous one:
For this week:
This week the same thing has happened but in the opposite direction. However, this time it’s different because the move failed while going in the direction of the bias, so we anticipate a bullish start to the week in order to position for new sells:
Although from a CRT perspective, if we drop to the daily timeframe, the range would be invalidated. DXY and GBPUSD do give us directional clues for a small retracement at the start of the week:
Here we can observe DXY:
And here GBPUSD:
Even though we have clearly defined upside targets on GBP and downside targets on DXY, we must not forget that it is very likely they will not be fully completed, since the broader direction for European currencies remains bearish continuation.
So in conclusion, we speculate with more cautious, lower-risk buys at the start of the week, since it makes sense for price to begin by pushing upward — not to shift the overall bias, but to complete the PO3 of the weekly candle. Once that weekly PO3 is formed, we will then look to join the sells when direction realigns with the broader bearish continuation.
Wishing everyone many profits!

17/11/25 Weekly OutlookLast weeks high: $107,526.18
Last weeks low: $93,034.53
Midpoint: $100,280.35
Bitcoins downtrend continues as price reaches a 6-month low of $93,000. This price action came as a result of a failed attempt to flip the $107,000-$108,000 level, as this area rejected the bears gained momentum sending BTC sub $100k big even level and the most worrying part of all for the bulls losing the $97,000-$98,000 level. On the Higher timeframes this new lower low sets up for a trend shift. Should any reaction from the bulls fail to flip the weekly high and rollover, I would then have confirmation of a bearish trend and trade accordingly.
Despite the US Government shut down coming to an end, it appears this has not been enough to get the market in a risk-on mood, at least not yet. This compounded with Nvidia earnings in midweek and the larger question mark about the AI industry as a whole has meant buyers are just not will to step in yet. My opinion is that IF Bitcoin trades into the $89,000-$92,000 area that is where support may be found, that's because we have an area of imbalance that broke the previous downtrend in April earlier this year during the tariff war.
This week I expect Wednesday 19th November to be a day of volatility, and some formation of a local bottom in Bitcoin, at least in the short term.
Good luck this week everybody!

10/11/25 Weekly OutlookLast weeks high: $110,732.65
Last weeks low: $98,972.09
Midpoint: $104,852.37
Bitcoins price action of last week tells an interesting story. The first trading hour of the week marked the weekly high, a sharp decline towards HTF support at $99,000 marked the weekly bottom, to finish the week a late surge recovered some of the losses to end the week at the range midpoint.
The double bottom at range low is a good sign for the bulls in a must win contested area around the $100,000 mark, not only is it a big even level but a HTF key S/R level too. Should the bulls lose this weekly low it opens the door to a $92,000 retest.
For the bulls should this rebound persist a flip of $108,000 is key but there is certainly a lack of spark in the markets at the moment.
I don't see the bulls making any significant ground until the US Government shutdown is announced to be coming to an end. This announcement could happen at any time and so this week that's what I am making plans for, how will the market react, volatility on announcement etc...
Good luck this week everybody!

03/11/25 Weekly OutlookLast weeks high: $116,415.75
Last weeks low: $106,320.38
Midpoint: $111,368.06
This week will be the third week in a row where ~$116,000 is acting as weekly high and a major resistance level. Last weeks price action was clear, the bulls are incapable of flipping that level and making it new support. As a result the bulls retreated back towards strong support at weekly low ~106,000 completing the SFP. Also this pattern is a mirror image of the previous weekly outlooks price action. No clear trend bias at all here but what is obvious is bull market momentum is dying out.
Bitcoin has always been hyper sensitive to liquidity, as always month end window dressing by the banks have a negative effect on liquidity, it usually takes a few days to get over this and resume normal levels again. The Government shutdown in the US does not help this as spending from the Treasury General Account has stopped with approximately $150Bn coming out of the market in October alone as a result.
Should Bitcoin push higher it can only do so once Government operations resume IMO. FOMC resulted in a 25bps cut and QT (Quantitative tightening) is ending on 1st December, all bullish signs for the future but currently and for this week I think chop/ gradual drawdown continues.
Good luck this week everybody!

KERNEX buy setupKERNEX buy setup : I take position in weekly candle basis. hold for 2-3-5 months until the trend is reversing. Please Note: This template is for informational purposes only and is not a substitute for professional legal advice.

Wall Street Weekly Outlook - Week 45 2025 [03.11.- 07.11.2025]Wall Street Weekly Outlook - Week 45 2025
📅 November 3 – November 7, 2025
Let’s kick off an exciting new trading week — and a brand-new trading month! 🚀
Seasonal factors often play a major role in November and December, and I’ll break them down for you in this week’s video. 🎥📈
Sit back, enjoy the overview, and dive into the world of banks, hedge funds, and institutional flows — with exclusive insights into how the pros are positioned right now. 🧠💼📊
💡 Bonus segments: Strategies, setups & market psychology — everything you need to know for the week ahead. ⚡️
📘 Topics covered in this week’s outlook:
🏛 Seasonality in the Nasdaq:
🥇 Seasonality in Gold:
... and many more charts & concepts in the video! 🎬📊
💬 I’m looking forward to your questions, comments, and an active discussion here on TradingView!
👋 Best,
Meikel

GBPUSD: Bearish From The -OB. Look For Valid Sells!Welcome back to the Weekly Forex Forecast for the week of Oct. 27 - 31st.
The GBPUSD traded up into the Supply Zone, then dropped from it, as forecasted last week. This week should see more bearish price action.
I like GBPUSD for shorts more than EURUSD, btw. Seems to be technically weaker.
FOMC on Wednesday, so be mindful of the volatility injection into the markets.
Enjoy!
May profits be upon you.
Leave any questions or comments in the comment section.
I appreciate any feedback from my viewers!
Like and/or subscribe if you want more accurate analysis.
Thank you so much!
Disclaimer:
I do not provide personal investment advice and I am not a qualified licensed investment advisor.
All information found here, including any ideas, opinions, views, predictions, forecasts, commentaries, suggestions, expressed or implied herein, are for informational, entertainment or educational purposes only and should not be construed as personal investment advice. While the information provided is believed to be accurate, it may include errors or inaccuracies.
I will not and cannot be held liable for any actions you take as a result of anything you read here.
Conduct your own due diligence, or consult a licensed financial advisor or broker before making any and all investment decisions. Any investments, trades, speculations, or decisions made on the basis of any information found on this channel, expressed or implied herein, are committed at your own risk, financial or otherwise.
