#WLD/USDT Pump Anticipated#WLD
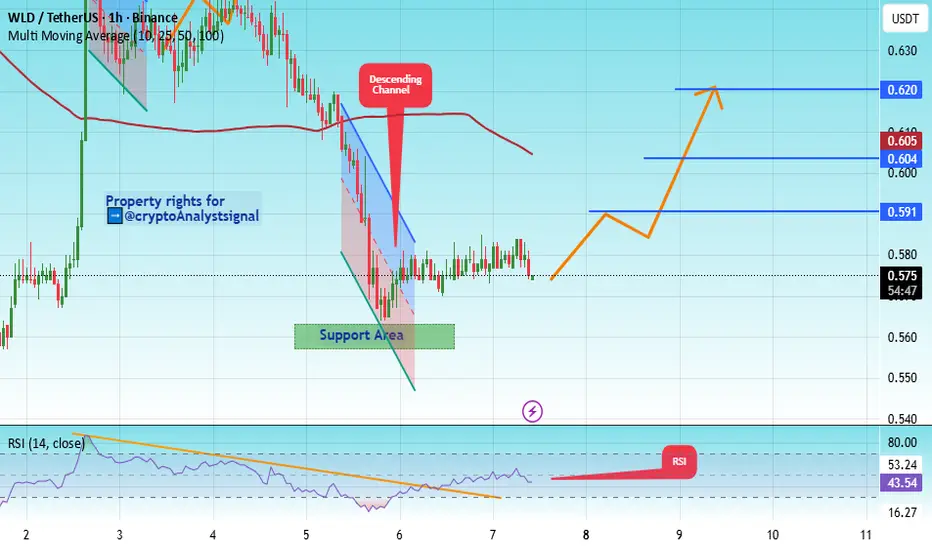
The price is moving in a descending channel on the 1-hour timeframe. It has reached the lower boundary and is heading towards breaking above it, with a retest of the upper boundary expected.
We have a downtrend on the RSI indicator, which has reached near the lower boundary, and an upward rebound is expected.
There is a key support zone in green at 0.563. The price has bounced from this zone multiple times and is expected to bounce again.
We have a trend towards stability above the 100-period moving average, as we are moving close to it, which supports the upward movement.
Entry price: 0.580
First target: 0.591
Second target: 0.604
Third target: 0.620
Don't forget a simple principle: money management.
Place your stop-loss below the support zone in green.
For any questions, please leave a comment.
Thank you.
WLDUSDT
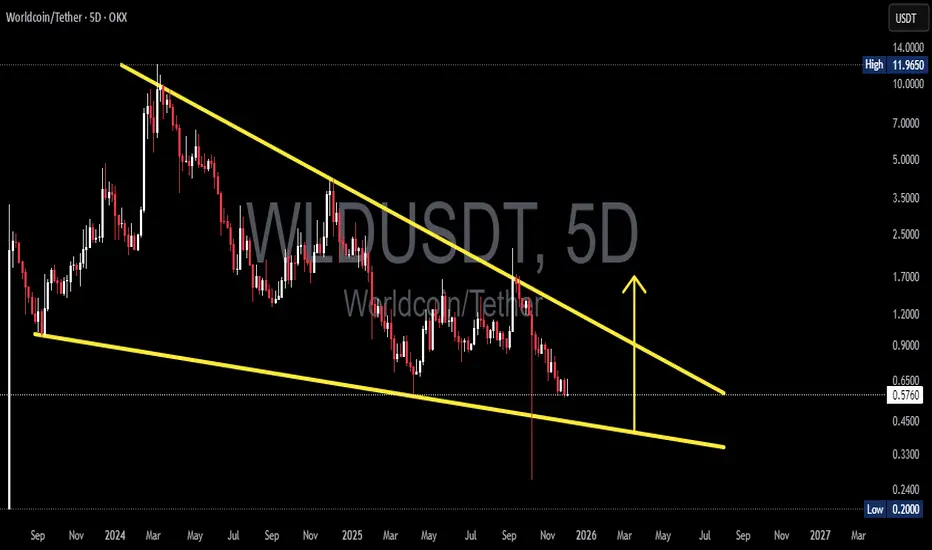
WLD/USDT — Falling Wedge: : Reversal or Final Capitulation?WLD/USDT on the 5D timeframe is entering the most critical phase of its long-term structure. Price action has formed a large Falling Wedge, a classic pattern that appears when bearish momentum fades while smart money quietly accumulates liquidity.
The upper trendline continues to slope downward sharply, but the lower boundary is flattening — a clear sign that sellers are losing strength, even though volatility remains elevated.
The long downside wick signals an aggressive liquidity sweep — often a precursor to a major move.
Price action is tightening, volatility is compressing, and WLD is now sitting right at the decision zone.
This type of structure rarely lasts long — it usually ends with a violent breakout or a final capitulation flush.
---
📈 Bullish Scenario (High-Potential Reversal Setup)
If WLD manages to bounce and break above the upper wedge trendline, it would be the first structural sign that multi-month selling pressure is exhausted.
Bullish confirmation requires:
A clean 5D close above 0.65–0.75
Strong volume expansion
A successful retest of the breakout trendline
If all criteria align, WLD could enter a medium-term trend reversal phase.
🎯 Bullish Targets:
1.00 – 1.20 → first major swing resistance
1.70 – 2.50 → extended targets if momentum accelerates
Potential formation of the first higher-high since the downtrend began
Large wedges often produce explosive upside once broken due to long-term volatility compression.
---
📉 Bearish Scenario (Final Breakdown & Capitulation Risk)
If the wedge support fails to hold (0.45 – 0.50 area), WLD may enter a capitulation phase.
Bearish confirmation includes:
A decisive 5D close below the wedge
No immediate recovery (no reclaim)
Increasing selling volume
If breakdown occurs, expect:
🎯 Bearish Targets:
0.33 → mid-level support
0.20 → extreme support (already marked on the chart)
Large wedge breakdowns often trigger a sharp liquidity flush before any meaningful recovery.
---
📌 Key Takeaways
WLD is at the most critical zone within its long-term falling wedge.
Tightening volatility = major accumulation or distribution underway.
Breakout = potential trend reversal.
Breakdown = potential capitulation phase.
When multi-month compression breaks, the move is usually fast and aggressive.
#WLD #WLDUSDT #Worldcoin #FallingWedge #CryptoAnalysis #PriceAction #BreakoutSetup #ReversalPattern #CryptoTrading
#WLD/USDT Pump Anticipated#WLD
The price is moving in a descending channel on the 1-hour timeframe. It has reached the lower boundary and is heading towards breaking above it, with a retest of the upper boundary expected.
We have a downtrend on the RSI indicator, which has reached near the lower boundary, and an upward rebound is expected.
There is a key support zone in green at 0.616. The price has bounced from this zone multiple times and is expected to bounce again.
We have a trend towards stability above the 100-period moving average, as we are moving close to it, which supports the upward movement.
Entry price: 0.636
First target: 0.642
Second target: 0.663
Third target: 0.684
Don't forget a simple principle: money management.
Place your stop-loss order below the support zone in green.
For any questions, please leave a comment.
Thank you.

#WLD/USDT Pump Anticipated#WLD
The price is moving in a descending channel on the 1-hour timeframe. It has reached the lower boundary and is heading towards breaking above it, with a retest of the upper boundary expected.
We have a downtrend on the RSI indicator, which has reached near the lower boundary, and an upward rebound is expected.
There is a key support zone in green at 0.623. The price has bounced from this zone multiple times and is expected to bounce again.
We have a trend towards stability above the 100-period moving average, as we are moving close to it, which supports the upward movement.
Entry price: 0.628
First target: 0.633
Second target: 0.641
Third target: 0.652
Don't forget a simple principle: money management.
Place your stop-loss order below the support zone in green.
For any questions, please leave a comment.
Thank you.

#WLD/USDT Pump Anticipated#WLD
The price is moving within an ascending channel on the 1-hour timeframe and is adhering to it well. It is poised to break out strongly and retest the channel.
We have a downtrend line on the RSI indicator that is about to break and retest, which supports the upward move.
There is a key support zone in green at the price of 0.683, representing a strong support point.
We have a trend of consolidation above the 100-period moving average.
Entry price: 0.698
First target: 0.708
Second target: 0.726
Third target: 0.740
Don't forget a simple money management rule:
Place your stop-loss order below the support zone in green.
Once the first target is reached, save some money and then change your stop-loss order to an entry order.
For any questions, please leave a comment.
Thank you.

#WLD/USDT Pump Anticipated#WLD
The price is moving within an ascending channel on the 1-hour timeframe and is adhering to it well. It is poised to break out strongly and retest the channel.
We have a downtrend line on the RSI indicator that is about to break and retest, which supports the upward move.
There is a key support zone in green at the 0.770 price level, representing a strong support point.
We have a trend of consolidation above the 100-period moving average.
Entry price: 0.790
First target: 0.825
Second target: 0.853
Third target: 0.888
Don't forget a simple money management rule:
Place your stop-loss order below the green support zone.
Once the first target is reached, save some money and then change your stop-loss order to an entry order.
For any questions, please leave a comment.
Thank you.

#WLD/USDT — The Final Defense Zone: Decision Time for Worldcoi#WLD
The price is moving within an ascending channel on the 1-hour timeframe and is adhering to it well. It is poised to break out strongly and retest the channel.
We have a downtrend line on the RSI indicator that is about to break and retest, which supports the upward move.
There is a key support zone in green at the 0.770 price level, representing a strong support point.
We have a trend of consolidation above the 100-period moving average.
Entry price: 0.786
First target: 0.801
Second target: 0.820
Third target: 0.842
Don't forget a simple money management rule:
Place your stop-loss order below the green support zone.
Once the first target is reached, save some money and then change your stop-loss order to an entry order.
For any questions, please leave a comment.
Thank you.

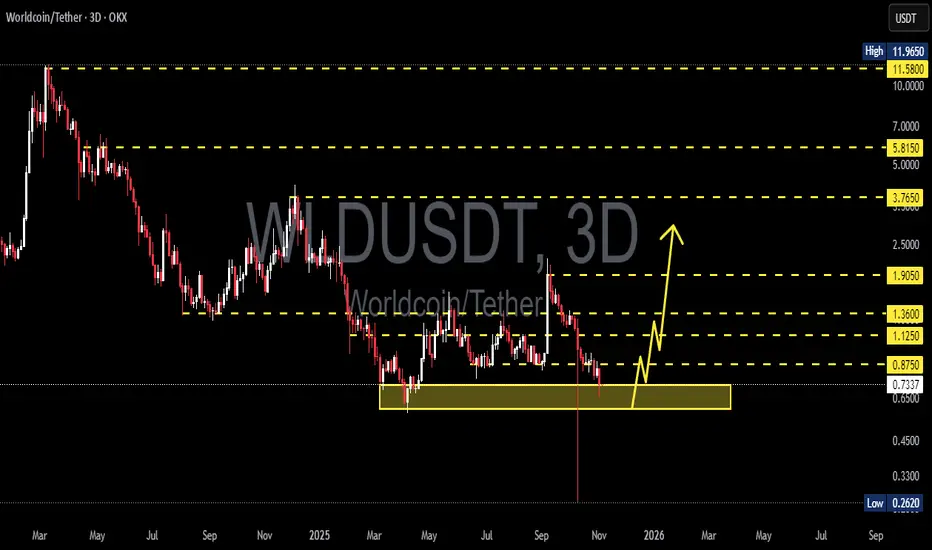
WLD/USDT – Decision Point: Major Reversal or Bear Continuation?WLD/USDT is now sitting right at one of the most critical accumulation zones of the year, between 0.73–0.595 — the same area that previously triggered two significant rallies.
However, this time the setup looks different. The price structure remains in a clear downtrend, and the recent long lower wick signals a liquidity sweep — a battle zone between smart money accumulation and panic selling.
This yellow zone is the make-or-break level for WLD’s broader trend.
If it holds, we could witness the early stages of a major trend reversal.
But if it breaks cleanly below, the market may enter a distribution and continuation phase toward the historical lows near 0.33–0.26.
---
Bullish Scenario – Reversal from Demand Zone
A strong reaction from 0.62–0.73, followed by a confirmed 3D/weekly close above 0.875, could mark the first sign of bullish control returning.
A successful retest of 0.73 as new support would offer an ideal confirmation entry.
Upside targets:
→ 1.125 – 1.36 (first reaction zone)
→ 1.905 (major resistance and key pivot)
→ If momentum extends, next zone around 3.76 becomes reachable.
Bullish Narrative:
“If this accumulation base holds once again, WLD could be setting up one of the most interesting bottom reversal structures of Q4 2025.”
---
Bearish Scenario – Breakdown and Capitulation
A confirmed 3D/weekly close below 0.595 would invalidate the accumulation zone.
A failed retest afterward could accelerate the decline toward 0.33, and potentially retest 0.262 as a historical support level.
Such a move could mark a final capitulation phase before long-term accumulation resumes.
Bearish Narrative:
“If 0.595 gives way, it’s not just a technical breakdown — it’s a loss of short-term structural confidence. The market could seek deeper liquidity before finding stability again.”
---
Technical Structure & Pattern
Primary trend: Medium-term downtrend with a descending price structure.
Yellow zone: Key demand/accumulation area repeatedly tested, reflecting an institutional tug-of-war.
Liquidity sweep: The deep lower wick beneath the zone indicates a stop-hunt event — typical before major reversals or continuation breakdowns.
---
Strategic Notes
Watch higher timeframes (3D/weekly) for confirmation; avoid reacting to intraday noise.
Conservative entries: wait for a confirmed close and retest above 0.875 (bullish) or below 0.595 (bearish).
Stop-loss strategy: place it outside the accumulation zone boundaries to avoid being swept by volatility.
Volume confirmation is crucial — breakouts without volume risk turning into false moves.
---
Conclusion
WLD is currently balancing between accumulation and distribution — a tipping point where market direction for the coming quarter will be decided.
If buyers defend 0.73–0.595, a strong reversal structure could form.
If not, sellers will likely regain control and drive price into new low territories.
Either way, this zone defines the next major trend for WLD.
---
#WLDUSDT #Worldcoin #CryptoAnalysis #TechnicalAnalysis #PriceAction #SupportResistance #DemandZone #BreakoutOrBreakdown #ReversalZone #CryptoMarket #SmartMoney #TrendAnalysis
#WLD/USDT#WLD
The price is moving in an ascending channel on the 1-hour frame, adhering well to it, and is heading for a strong breakout and retest.
We have a bearish trend on the RSI indicator that is about to be broken and retested, which supports the upward breakout.
There is a major support area in green at 0.883, representing a strong support point.
We are heading for stability above the 100 moving average.
Entry price: 0.900
First target: 0.912
Second target: 0.938
Third target: 0.963
Don't forget a simple matter: capital management.
When you reach the first target, save some money and then change your stop-loss order to an entry order.
For inquiries, please leave a comment.
Thank you.

#WLD/USDT Pump Anticipated#WLD
The price is moving within a descending channel on the 1-hour frame, adhering well to it, and is heading for a strong breakout and retest.
We have a bearish trend on the RSI indicator that is about to be broken and retested, which supports the upward breakout.
There is a major support area in green at 0.875, representing a strong support point.
We are heading for consolidation above the 100 moving average.
Entry price: 0.889
First target: 0.904
Second target: 0.923
Third target: 0.942
Don't forget a simple matter: capital management.
When you reach the first target, save some money and then change your stop-loss order to an entry order.
For inquiries, please leave a comment.
Thank you.

WLD/USDT — The Final Defense Zone: Decision Time for Worldcoin!Worldcoin (WLD) is currently testing its final line of defense, sitting firmly inside the key demand zone between 0.877 – 0.75 USDT.
This area has historically acted as a major accumulation base and a strong bounce zone for months.
However, the latest 2D candles are revealing growing selling pressure, as buyers attempt to defend the level once again.
The market structure shows a gradual loss of bullish momentum, yet this zone still holds the potential for a significant structural reversal — if buyers can reclaim control with volume confirmation.
At this stage, WLD is standing at a make-or-break point, and the next reaction here could define its direction for the rest of the quarter.
---
Technical Structure & Pattern
Price has been trading in a wide consolidation range since March 2025.
A sequence of lower highs confirms sustained bearish pressure.
The 0.877 – 0.75 USDT zone remains the most critical demand area where previous accumulation took place.
Recent candles indicate a liquidity sweep / false breakdown, suggesting the presence of smart money accumulation beneath support.
Overall, WLD is now in a critical inflection phase — preparing for either a rebound or a continuation breakdown.
---
Bullish Scenario
Confirmation: Strong bullish rejection or engulfing candle within 0.75–0.877 zone on the 2D timeframe, supported by rising volume.
Upside Targets:
1️⃣ 1.344 USDT → minor structure retest
2️⃣ 1.524 USDT → first resistance cluster
3️⃣ 1.947 USDT → key resistance zone
A decisive close above 1.95 USDT would confirm a trend reversal and potentially open a mid-term rally toward 3.80 – 4.20 USDT.
---
Bearish Scenario
Confirmation: 2D candle closes below 0.75 USDT with high volume — confirming a full breakdown of the demand zone.
Downside Targets:
1️⃣ 0.45 USDT → major liquidity pool & historical support
2️⃣ 0.25 – 0.30 USDT → final accumulation zone
Such a move would confirm a macro downtrend continuation, possibly marking a capitulation phase before the next long-term bottom forms.
---
Conclusion
The 0.877 – 0.75 USDT range is the most critical price zone for WLD right now.
If buyers manage to defend this area, a strong recovery rally could emerge toward 1.3–1.9 levels.
But if it breaks down, the market could witness another leg of bearish continuation, targeting deeper support zones unseen since early cycle lows.
> This isn’t just a support zone — it’s Worldcoin’s Final Defense.
---
#WLDUSDT #Worldcoin #CryptoTA #TechnicalAnalysis #BreakoutWatch #SupportZone #MakeOrBreak #ReversalSetup #AltcoinAnalysis #SmartMoney #CryptoTrading

#WLD/USDT LONG SET UP ALERT#WLD
The price is moving within a descending channel on the 1-hour frame, adhering well to it, and is heading for a strong breakout and retest.
We have a bearish trend on the RSI indicator that is about to be broken and retested, which supports the upward breakout.
There is a major support area in green at 0.964, representing a strong support point.
We are heading for consolidation above the 100 moving average.
Entry price: 0.996
First target: 1.046
Second target: 1.09
Third target: 1.15
Don't forget a simple matter: capital management.
When you reach the first target, save some money and then change your stop-loss order to an entry order.
For inquiries, please leave a comment.
Thank you.

#WLD/USDT LONG SET UP ALERT#WLD
The price is moving in a descending channel on the 1-hour frame and is expected to break and continue upward.
We have a trend to stabilize above the 100 moving average once again.
We have a downtrend on the RSI indicator that supports the upward move with a breakout.
We have a major support area in green that pushed the price higher at 0.919.
Entry price: 0.942.
First target: 0.969.
Second target: 1.01.
Third target: 1.06.
To manage risk, don't forget stop loss and capital management.
When you reach the first target, save some profits and then change your stop order to an entry order.
For inquiries, please comment.
Thank you.

#WLD/USDT Pump Anticipated#WLD
The price is moving within a descending channel on the 1-hour frame, adhering well to it, and is heading for a strong breakout and retest.
We have a bearish trend on the RSI indicator that is about to be broken and retested, which supports the upward breakout.
There is a major support area in green at 1.26, representing a strong support point.
We are heading for consolidation above the 100 moving average.
Entry price: 1.31
First target: 1.35
Second target: 1.39
Third target: 1.44
Don't forget a simple matter: capital management.
When you reach the first target, save some money and then change your stop-loss order to an entry order.
For inquiries, please leave a comment.
Thank you.

WLD ROADMAPTo me the view is pretty clear.
* The purpose of my graphic drawings is purely educational.
* What i write here is not an investment advice. Please do your own research before investing in any asset.
* Never take my personal opinions as investment advice, you may lose your money.

TradeCity Pro | WLD: Consolidating at Key Fibonacci Support👋 Welcome to TradeCity Pro!
In this analysis I want to review the WLD coin for you. This is one of the crypto projects where Sam Altman, the CEO of OpenAI, also serves as the CEO. The coin currently has a market cap of $2.81 billion and is ranked 42 on CoinMarketCap.
⏳ 4-Hour Timeframe
In the 4-hour timeframe, this coin is sitting on a very important support area. This PRZ zone is significant not only as a key support but also because it aligns with the 0.618 Fibonacci level.
✔️ After a bullish move that pushed the price up to 2.038, WLD entered a corrective phase. Following the break of the 0.382 Fibonacci level, the price has now corrected down to this important area.
⭐ A very attractive range box has formed around this PRZ zone, and the price has built a clean structure within it.
📊 Volume has gradually decreased inside this box, but after a shadow wick touched the bottom of the support, buying volume entered the market again, suggesting that the price now has enough momentum to potentially break above 1.396.
⚡️ There are two SMAs (25 and 99) on the chart, both showing a slight upward slope and converging toward each other.
💥 This indicates that volatility in the market has decreased significantly, and since the market tends to move after periods of low volatility, the likelihood of a breakout has increased.
🔄 If the box breaks to the upside and the 1.396 trigger is activated, a bullish move can begin. The main confirmation of the uptrend will come after stabilization above 1.468, but in my opinion, the breakout of 1.396 alone is strong enough to justify an early long entry.
🔑 However, if the box breaks downward, the trend for this coin will turn completely bearish, with the next major support zone located at 1.037. The price could even decline further in the future.
📝 Final Thoughts
Stay calm, trade wisely, and let's capture the market's best opportunities!
This analysis reflects our opinions and is not financial advice.
Share your thoughts in the comments, and don’t forget to share this analysis with your friends! ❤️

WLD Market Update📊 MIL:WLD Market Update
MIL:WLD is possibly forming a bullish Double Bottom pattern ✅
If it breaks out of the red resistance zone 🔴 with confirmation, the first target will be the blue line level 🎯

WLDUSDT: Correction After Strong RallyOn the daily timeframe, WLD’s RSI is gradually declining, signaling a potential correction. On the hourly chart, RSI continues to fall toward 40, further confirming the corrective outlook.
I expect WLD to extend its pullback toward the two support levels at $1.523 and $1.40. At the moment, I am looking for an exit price to close 50% of my WLD holdings to ensure safety.
Disclosure: I am currently holding WLD, and this may influence my personal outlook.
This analysis is for reference only and should not be considered financial advice.

#WLD/USDT — Retest at the Golden Zone. Bullish Momentum#WLD
The price is moving within a descending channel on the 1-hour frame, adhering well to it, and is heading for a strong breakout and retest.
We have a bearish trend on the RSI indicator that is about to be broken and retested, which supports the upward breakout.
There is a major support area in green at 1.54, representing a strong support point.
We are heading for consolidation above the 100 moving average.
Entry price: 1.57.
First target: 1.59.
Second target: 1.63.
Third target: 1.67.
Don't forget a simple matter: capital management.
When you reach the first target, save some money and then change your stop-loss order to an entry order.
For inquiries, please leave a comment.
Thank you.

WLD Market Update📊 MIL:WLD Market Update
After an uptrend, MIL:WLD is now retracing 📉
👉 If the price keeps dropping to the green support zone 🟢, it could bounce up from there.
This level is where buyers previously accumulated and may push price up again with confirmation ✅
⚡ Be patient — wait for confirmation before entering.

WLDUSDT – Approaching Key Support | Long Setup AheadWLD had a powerful rally last week, but recent price action has seen a healthy retracement. This pullback is bringing the price into a critical support zone between $1.25 and $1.35, which previously acted as a strong base for bullish momentum.
The overall structure remains bullish, and this zone presents a high-confluence area for a potential long spot entry. If buyers step in here, we could see a strong reaction and continuation toward higher targets.
🔹 Trade Setup
• Entry Zone: $1.25 – $1.35
• Take Profit Targets:
🥇 $1.80 – $2.00
🥈 $2.40 – $2.65
• Stop Loss: Daily close below $1.20
#WLD #Worldcoin #CryptoTrading #Altcoins #CryptoSetup #LongTrade #TechnicalAnalysis #SupportZone #CryptoRally #SpotTrade #CryptoChart #WLDUSDT #BreakoutSetup #SwingTrade #CryptoBullish

#WLD/USDT — Retest at the Golden Zone. Bullish Momentum Contin#WLD
The price is moving within a descending channel on the 1-hour frame, adhering well to it, and is heading for a strong breakout and retest.
We have a bearish trend on the RSI indicator that is about to be broken and retested, which supports the upward move.
There is a major support area in green at 1.56, representing a strong support point.
For inquiries, please leave a comment.
We are in a consolidation trend above the 100 Moving Average.
Entry price: 1.70
First target: 1.77
Second target: 1.85
Third target: 1.94
Don't forget a simple matter: capital management.
When you reach the first target, save some money and then change your stop-loss order to an entry order.
For inquiries, please leave a comment.
Thank you.

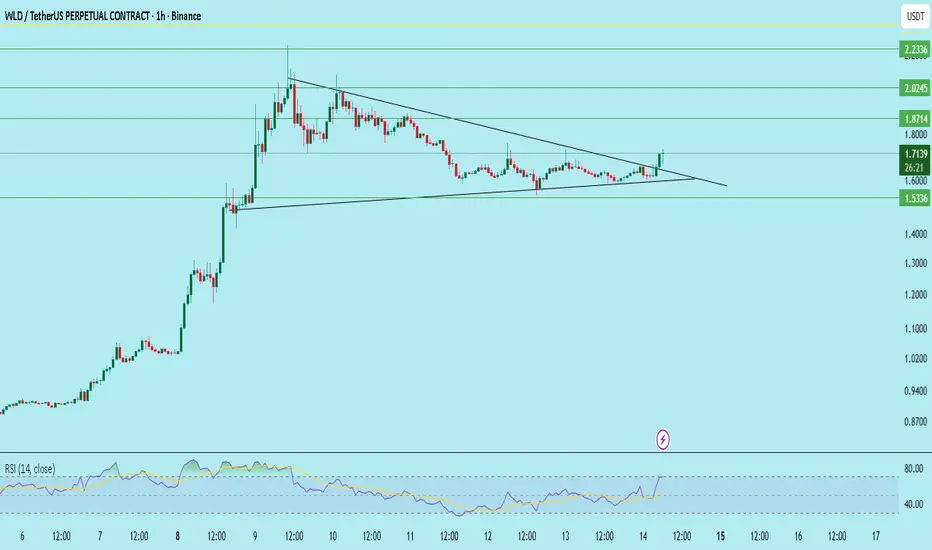
WLD/USDT — Bullish triangle breakout (1H)WLD formed a symmetrical triangle after a sharp advance. The price has broken above the triangle’s descending trendline with bullish follow-through candles. Buyers have been defending the rising lower trendline, and RSI has recovered from mid-range to ~59 — momentum is building but not overbought.
Key observations
Pattern: Symmetrical triangle → breakout to the upside on the hourly chart.
Candles: Breakout candle followed by bullish follow-through; watch for a clean retest of the breakout trendline as confirmation.
Momentum: RSI ~59 (room to run).
Support: 1.53 (strong demand area and triangle base).
Immediate resistance cluster: 1.87 → 2.02 → 2.23.
Trade plan (if you choose to take it)
Entry: 1.65 – 1.70
Stop loss: 1.53 (invalidation of triangle breakout)
Targets:
T1: 1.87 — Expected profit ≈ 10.00% – 13.33% (entry 1.70 → 1.65).
T2: 2.02 — Expected profit ≈ 18.82% – 22.42%.
T3: 2.23 — Expected profit ≈ 31.18% – 35.15%.
Risk if stopped: loss ≈ 7.27% – 10.00% (depending on entry within the range).
Risk notes / invalidation
Loss of 1.53 would invalidate the breakout and likely push price back to lower supports; treat 1.53 as the key invalidation level.
Ideal confirmation: retest of breakout trendline with clean rejection and/or volume confirmation.
Not Financial Advice | DYOR !!