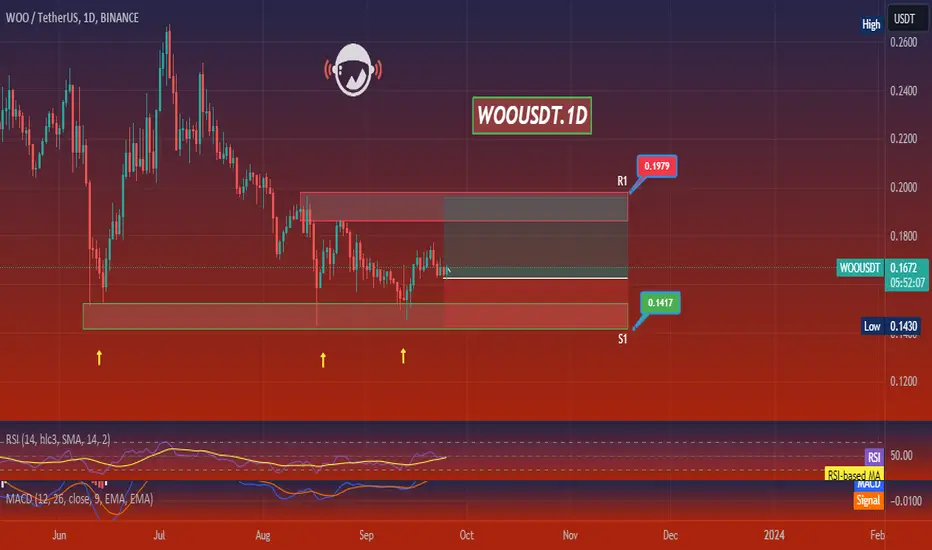
WooWOO had a perfect level to long from Weekly FVG at 0.1462$
Unfortunately wasn’t checking on this coin, so I missed that good opportunity to long.
I expect bullish trend continuation on this coin. Also the reason is Bullish monthly close.
Levels I would book some profits are 0.2$ where the coin has W FVG and W 50 ema resistance; 0.22$ and 0.29$ (Lines 1 - 2)
If the coin comes back to 0.1644$ from the CURRENT level, in this case, the coin can come back to 0.1462$ price level to test it. And only closing below that level, will leave the coin lower to 0.1178$ (lines 3 - 4)
WOOUSDT

MY WOO DOUBLE PATTERN TRADEIn the past days, I posted an idea about BINANCE:WOOUSDT forming a potential double top pattern. Then, entered with the confirmation of a breakout on the first diagonal support line along with other confluences such as good selling volume and the RSCD (RSI and MACD).
Take profit areas:
1) Price touching the second and the longer diagonal support.
2) Price reaching the neckline support.
3) Price on the 0.5 fib area/ common support line.
4) Stop profit above neckline.
How to Use the TP/SL Split Target Feature on Binance Futures
www.binance.com

WOO: DOUBLE TOP PATTERNIn this technical analysis, the idea presented is the 4-hour chart of BINANCE:WOOUSDT , which appears as a bearish indication of a double top pattern. With that, I plotted two potential diagonal support lines to consider for a breakdown to materialize.
I have a bearish sentiment for WOO based on an unlocking happening this October 10 per defillama.com . What is unlocking? From a coin perspective, investors have the attempt to sell the unlocked tokens that they held for some time, which can decrease the price of the coin.
We're currently on a weekend, so we can't expect volume. I will continue to monitor this coin from time to time and provide updates as well in the comments.
On another note, consider checking my article about BTC CRUCIAL TRIANGLE as we could expect a massive move and could correlate with altcoins as well.
Always plan your trades by knowing your support and resistance along with take profit or stop-loss areas when entering a position. Happy trading!

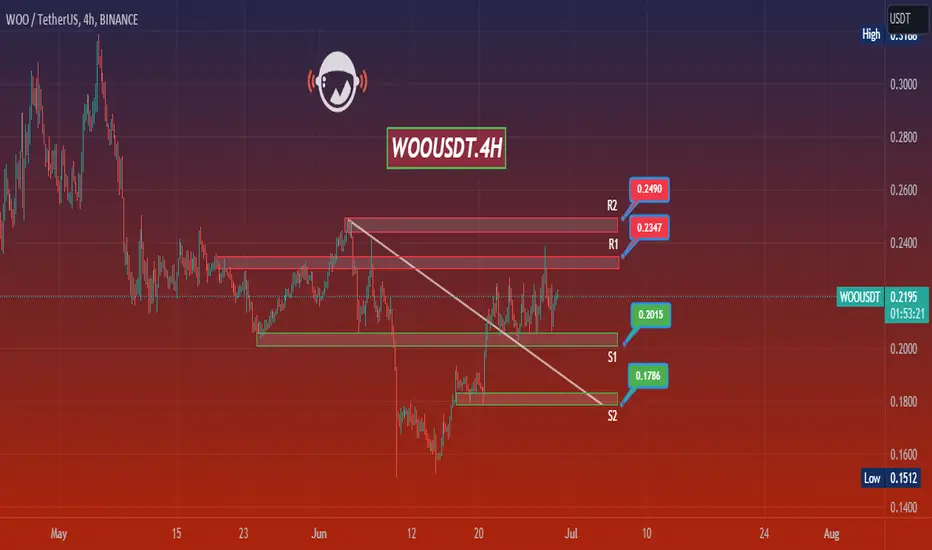
WOOUSDT - Buy Setup!!WOOUSDT (1D Chart) Technical analysis
WOOUSDT (1D Chart) Currently trading at $0.18
Buy level: Above $0.177
Stop loss: Below $0.161
TP1: $0.187
TP2: $0.2
TP3: $0.23
TP4: $0.27
Max Leverage 2x
Always keep Stop loss
Follow Our Tradingview Account for More Technical Analysis Updates, | Like, Share and Comment Your thoughts

WOOUSDTThis is a 1D frame analysis for WOOUSDT Our first support zone has been able to support the price multiple times and move it upwards, and currently the price has managed to move back to the first resistance zone after bouncing off. We expect the price to move towards our first resistance line from this zone.
Another drop analysisFrom Elliot's rules, we find that the price made three historical downward waves, then corrected in three other waves, and it is expected to decline in five large waves in order to end the historical decline of the currency

WOO SHORT SETUP After hitting the fvg, bearish order flow has been well transferred to the candles.
Then after the bearish order flow was transferred, we saw a bearish CH.
A dynamic resistance has been formed above the price, which is the place of divorce between descending blocks. As the invalidation level is close, sell/short trades can be attractive.
The main and strong demand is Demand 2, where you should completely exit Sell/Short trades
For risk management, please don't forget stop loss and capital management
When we reach the first target, save some profit and then change the stop to entry
Comment if you have any questions
Thank You

WOOUSDTWOOUSDT is trading in symmetrical triangle pattern. The price is reacting well the support and resistance of triangle.
Currently the price is at the support of triangle where it is also forming a local support zone and seems like the price may break through the triangle.
If the breakout sustain to upside the optimum target could be 0.1800.

WOO Network (WOO) formed bullish Gartley for upto 12.50% pumpHi dear friends, hope you are well and welcome to the new update on WOO Network (WOO) with US Dollar pair.
Previously we caught almost 70% pump of WOO as below:
Now on a 4-hr time frame, WOO has formed a bullish Gartley move for the next pump.
Note: Above idea is for educational purpose only. It is advised to diversify and strictly follow the stop loss, and don't get stuck with trade.

Woo dump#woo is rejected from red trendline. It will go down and hit green trendline. If price goes above the red trendline then Bearish Scenario will be invalid.

WOO back to 0.1The description of the WOO network project itself does not provide specific information about the reasons why the value of this native token could increase.

Long Swing Trade: Woo/Usdt (Binance)The red box with range (0.167-0.16) is a good range to buy Woo for a potential Swing setup, with TPs mentioned. Let's get this bread

WHY WOO COIN PRICE DROP ? WOO COIN ANALYSIS AND TRADE SETUP !!WOO Coin Update & Possible Move !!
• On 4h tf Currently holding now its support . ( small bounce expected.
• MACD &RSI are Bearish on 4h, 1D &1W Chart.
• Personally i open trade in long with 1% on 0.18$ lets see what happen.
• If its break its 4h support then next stop is at 0.15$.
FOLLOW ME FOR MORE ANALYSIS

Support Zones | Long BiasDaily Chart
BINANCE:WOOUSDT 's downed to support around 0.19
I expect BINANCE:WOOUSDT will bounce from this zones and go up to 0.22
Wait for next move

Head and shouldersIt is clear that a head, right shoulder and left shoulder have been formed and are ready to break down, so please secure your deals .. Good luck

WOOUSDT Rally: Bullish Momentum Gains Steam!💎Since finding support at $0.15, #WooNetwork has been on a continuous ascent, forming higher highs and higher lows. The breakthrough above the downtrend trendline, along with the subsequent minor resistance breakout, signals a potential shift in momentum as buyers assert their presence.
💎Currently, the probability of an uptrend is slightly higher compared to the downtrend scenario, prompting buyers to seek a favorable risk/reward opportunity. #WOO is currently trading near the demand zone and testing the support uptrend trendline, indicating a phase of buying accumulation. This accumulation process is likely to persist as long as the price remains above the demand zone.
💎Such accumulation is expected to pave the way for an explosive price growth, offering a promising 73% upside potential. In the event of an uptrend, #WOO is likely to target the previously formed high at $0.35. However, the price action around the 78.6% Fibonacci retracement level, representing a minor supply zone, warrants close monitoring.
💎While maintaining a bullish outlook on #WOOUSDT, it is essential to consider an alternative scenario. Should the price break below the demand zone, the probability could shift in favor of the bears, potentially leading to a drop down to the 78.6% Fibonacci support or even lower.
💎As diligent Paradisers, we shall remain attentive to both possibilities, ensuring informed decisions amid the evolving market conditions. Stay informed, stay prepared! 🌴


WOOUSDTThis is a risky position because of the sensitive conditions of Bitcoin
⚠️"Daily crypto market analyses I provide are personal opinions & not financial advice. Trading carries risks, so do your own research & seek advisor's help."
Don't forget to like and comment
Woo...What goes up must come downI gone short on Woo, we have a bearish harmonic pattern, rejection at resistance, sharp short down to support. Lev 25x. The red labels are resistance, blue support, also has the % coin has to travel to hit targets. Should help with position size
My leverage extended, Lets see how these trades go for the week

#WOO/USDT 8h (ByBit) Descending trendline breakoutWoo Network looks good for bullish continuation after consolidating above 100EMA support, targeting broadening wedge resistance.
⚡️⚡️ #WOO/USDT ⚡️⚡️
Exchanges: ByBit USDT
Signal Type: Regular (Long)
Leverage: Isolated (5.9X)
Amount: 5.0%
Current Price:
0.2131
Entry Targets:
1) 0.2103
Take-Profit Targets:
1) 0.2389
Stop Targets:
1) 0.1960
Published By: @Zblaba
FWB:WOO #WOOUSDT #WooNetwork #CeFi
Risk/Reward= 1:2
Expected Profit= +80.2%
Possible Loss= -40.1%
Estimated Gaintime= 1-2 weeks
woo.org

WOO target 0.24~0.274h time frame
-
WOO has potential to create a structure to reach 0.24~0.27.
Be careful of the PRZ there.
-
TP: 0.24~0.27
SL: 0.202

WOOUSDTHello Crypto Lovers, This is a 4H frame analysis for WOOUSDT The price is currently fluctuating within the range between the first support line and the resistance line, and as you can see, until the price breaks out from one side, we cannot issue a signal, so if the price is able to break the resistance line and establish a higher low, I expect a bullish move towards the resistance line. Currently, the price is moving towards the resistance line and there is a possibility of breaking it. Warning: This is just a suggestion and we do not guarantee profits. We advise you to analyze the chart before opening any positions. Take care
WOOUSDT Will WOOUSDT repeat the previous pattern for a massive bullish attempt of around 17% ?. If the instrument close above 0.2255 , will be a nice buying option.
