WOOI chose 3 options for woo, if there is no deterioration in the trend, the normal impulse wave will continue. If there is any bear market, I think it will continue as w,x,y or a,b,c correction.
WOOUSDT

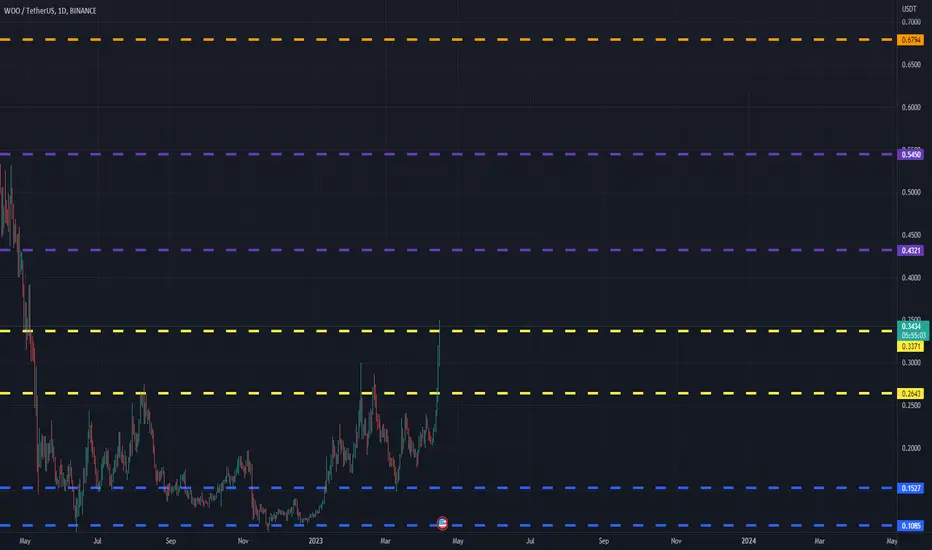
WOOUSDT(WOO Network) Daily tf Range Updated till 16-04-23WOOUSDT(WOO Network) Daily timeframe range. there are still lots of room here for price discovery if we zoomout the chart. lots of possibility's. for now breaking above #0.3371 clean will open a space till #0.4321. failing that will get back to 0.2643.
WOOUSDTWOOUSDT
Thoughts
After a long downtrend, buyers were able to stop the price and began to form a consolidation area. As a result, the Inverted Head and Shoulders pattern formed. The situation is very similar to the symmetrical pattern on the BTC chart we talked about.
In addition to spot positions, you can also consider futures. But before entering a position, it is worth remembering that it is much more dangerous than a spot. You need to be calm and clearly aware of your actions.
Sample thoughts for those who wish to enter the futures:
WOO long
Entry: up to 0.2590 (look at the situation)
🔘Add position: 0.2312
Shoulder: 5-10X
🟢Take-profit: 0.3044 - 0.3338 - 0.3837
🚫Stop: 0.2114
Focus strictly on your shoulders, do not forget to drag stops into boo and divide the margin to gain a position. Move stops with take calculation 25% - 50% - 75% -...
If you like the idea, don't forget to subscribe and rate like👍

WOOusdt ,,,, 🎯 Target It may rise to 3000 .
it is currently bullish and has maintained its uptrend line.

WOO Network (WOO) formed bullish BAT for upto 16% pumpHi dear friends, hope you are well and welcome to the new update on WOO Network (WOO) with US Dollar pair.
Previously we caught a nice trade of WOO as below:
Now on a 4-hr time frame, WOO has formed a bullish BAT move for another price reversal.
Note: Above idea is for educational purpose only. It is advised to diversify and strictly follow the stop loss, and don't get stuck with trade

Keep an eye on wooWoo making a solid inverse H&S pattern in 3D chart
🔸I think it's so bullish for midterm
🔸We can see woo above 0.5$ incase of breakout the neckline
If u like this idea hit like, follow for more ideas like that and tell me ur opinion about woo🎯

WOO holding Trendline SupportWOO is holding it's Trendline Support!
Wait for Breakdown and Retest for SHORT

WOOUSDT IdeaAfter creating:
1. The 50-SMA crossed the 100-SMA
2. The price reached the 50-SMA and returned
A strong and rapid potential for upward movement is created.
Wait for the right time to enter a long trade.
we can call it The Setup
✅ ✅ Risk warning, disclaimer: the above is a personal market judgment and analysis based on published information and historical chart data on The trading view,
And only some of these analyzes are my actual real trades.
I hope Traders consider I am Not responsible for your trades and investment decision.

WOO CAN DROP AGAINHi, dear traders. how are you ? Today we have a viewpoint to SELL/SHORT the WOO symbol.
For risk management, please don't forget stop loss and capital management
When we reach the first target, save some profit and then change the stop to entry
Comment if you have any questions
Thank You

SHORT WOO 11RRbeautiful support breakdown
backtested as resistance.
Im in a little more leverage because btc and eth are not looking convincing.

Support and Resistance Trend Line Trading (Woo 4H)Hey guys, let me share today's perspective!
We expect the 4hour candle to rebound when it closes with beekeeping.
If you break below the support line and the resistance line, Run away.!

WOOUSDT another jump ahead...WooNetwork drop was stopped at the demand area. This implies bullish dominance and should result in at least one more wave to the upside.

WOOUSDT good RR trade setupWe love this pullback, as we are able to get some WOO at a discounted price. At least onether strong wave up is expected.

Pump signal! $WOO & $ORAI project Pump coming with Woo and #oraichain $ORAI
AI most advance project with main use case
(AI smartcontract)
Do you remember ethereum When people realized value of Classic smartcontract?

Massive cup and handle? With the handle currently formingMight be a big cup and handle pattern with the handle currently forming within the ascending triangle? The RSI is also making an ascending triangle. Not to sure if this will hold up tho just publishing it so I can keep a track of it.

BLOOD WOOİkili tepe formasyonu çalışırsa eğer hedeflenen bölgeye doğru düşüş gerçekleşecektir. BTC hareketleri izlenmeli... Yatırım tavsiyesi değildir.
Bekleyip göreceğiz.

WOO 1D chartAt the beginning of January this year, with the rise of BTC, many currencies also rose, and WOO was no exception.
-
It can be seen from the 1D chart that WOO has broken through the pressure trend line starting from the high point of 0.2747. After breaking through the previous high of 0.1975, it came to 0.2281, and the trend turned to higher high and higher low.
-
Fibonacci retracement with the high point of 0.2281 and the low point of 0.1016, WOO steps back at 0.1649~0.1798, and the first target is 0.2914~0.3063.
It should be noted that 0.2764 (1.382) overlaps with the previous high of 0.2747. The previous high point usually has a resistance effect, and WOO may consolidate here for a period of time before going out.
-
WOO target price:
0.2764
0.2914~0.3063
0.3546
0.4103
0.4382
-


WOOUSDT - LongSimple range breakout play, of course dependent on BTC behaving. So long as BTC stays in range I trust this goes to test and take out the liquidity resting 0.23 region.
I'm long with a risk defined below Monday's low.

Woousdt buy idea We break the general downtrend ,I think the price will retest the broken trend then continue uptrend also we have fib 76 area which increases the chance to go up.

WOO - 10/01 - 1D Chart UpdateWOO - 10/01
#WOO is currently trading in a ascending channel after it manage to confirm a breakout on the daily candle.
After some good news on the WOO Network the coin had a 48% increase and touched the first resistance.
Given the current market we can expect it to try a breakout again from the first resistance zone ($0.189~$0.205) and if it manages to break that zone we can easily see the price go to $0.25.
*Candle color depicts volume

WOO/USDT | Seems like Ready to FLY. 🚀🚀
#WOO Seems like Ready to FLY. 🚀🚀
Falling Wedge Formation in Weekly timeframe.
RSI is Printing Bullish Divergence.
Massive Buying Volume Coming in..
+500-600% Profit Potential in the Midterm.
Please like the idea for Support & Subscribe for More ideas like this and share your ideas and charts in Comments Section..!!
Thanks for Your Love & Support..!!

WOOUSDT fast drop - sell tradeIt seems we'll see another downside swing very very soon. Perhaps even today or tomorrow.
