WTI Oil H4 | Rising into a swing-high resistanceWTI oil (USOIL) is rising towards a swing-high resistance and could potentially reverse off this level to drop lower.
Sell entry is at 59.71 which is a swing-high resistance that aligns close to the 50.0% Fibonacci retracement.
Stop loss is at 62.30 which is a level that sits above an overlap resistance.
Take profit is at 55.10 which is a swing-low support.
High Risk Investment Warning
Trading Forex/CFDs on margin carries a high level of risk and may not be suitable for all investors. Leverage can work against you.
Stratos Markets Limited (tradu.com):
CFDs are complex instruments and come with a high risk of losing money rapidly due to leverage. 63% of retail investor accounts lose money when trading CFDs with this provider. You should consider whether you understand how CFDs work and whether you can afford to take the high risk of losing your money.
Stratos Europe Ltd (tradu.com):
CFDs are complex instruments and come with a high risk of losing money rapidly due to leverage. 63% of retail investor accounts lose money when trading CFDs with this provider. You should consider whether you understand how CFDs work and whether you can afford to take the high risk of losing your money.
Stratos Global LLC (tradu.com):
Losses can exceed deposits.
Please be advised that the information presented on TradingView is provided to Tradu (‘Company’, ‘we’) by a third-party provider (‘TFA Global Pte Ltd’). Please be reminded that you are solely responsible for the trading decisions on your account. There is a very high degree of risk involved in trading. Any information and/or content is intended entirely for research, educational and informational purposes only and does not constitute investment or consultation advice or investment strategy. The information is not tailored to the investment needs of any specific person and therefore does not involve a consideration of any of the investment objectives, financial situation or needs of any viewer that may receive it. Kindly also note that past performance is not a reliable indicator of future results. Actual results may differ materially from those anticipated in forward-looking or past performance statements. We assume no liability as to the accuracy or completeness of any of the information and/or content provided herein and the Company cannot be held responsible for any omission, mistake nor for any loss or damage including without limitation to any loss of profit which may arise from reliance on any information supplied by TFA Global Pte Ltd.
The speaker(s) is neither an employee, agent nor representative of Tradu and is therefore acting independently. The opinions given are their own, constitute general market commentary, and do not constitute the opinion or advice of Tradu or any form of personal or investment advice. Tradu neither endorses nor guarantees offerings of third-party speakers, nor is Tradu responsible for the content, veracity or opinions of third-party speakers, presenters or participants.
WTI

Hellena | Oil (4H): SHORT to support area of 55.204.Colleagues, I believe that the price will continue its downward movement. At the moment we are observing a combined correction. I expect the completion of wave “Y”. Even if it is already completed, the price is still waiting for a downward correction to the support area of 55.204. Therefore, I think that 55.204 is the 1st minimum target.
There are two possible ways to enter the position:
1) Market entry
2) Pending Limit orders.
Manage your capital correctly and competently! Only enter trades based on reliable patterns!

WTI TRADE IDEAhello everyone
From the previous oil movement, the entry at 58.52 moved up by 80 pips before hitting breakeven. For the upcoming open market, if the trendline and support or resistance break out as shown on the M30 chart, it could signal an opportunity to enter the market.
Ensure strong confirmation before acting, and keep an eye on shifts in market structure.
Thanks a lot for your support & best of luck
**My trading strategy is not intended to be a signal. It's a process of learning about market structure and sharpening my trading my skills also for my trade journal**

BRIEFING Week #18 : Waiting for RotationHere's your weekly update ! Brought to you each weekend with years of track-record history..
Don't forget to hit the like/follow button if you feel like this post deserves it ;)
That's the best way to support me and help pushing this content to other users.
Kindly,
Phil

WTI TRADE UPDATEhi all
Based on the current situation for WTI, with the stop loss hit from the previous trade idea, Plan A now relies on a breakout of the trendline and the support turning into resistance as confirmation for taking a long position.
However, if rejection occurs at the trendline or at the support-turned-resistance level, there's a possibility that the price will decline again, given that a breakout has already happened on the daily timeframe. Therefore, closely monitoring price movements around these key levels is crucial before making any trading decisions.
Ensure strong confirmation before acting, and keep an eye on shifts in market structure. Feel free to share any new updates, and best of luck with your strategy!
good luck all
**My trading strategy is not intended to be a signal. It's a process of learning about market structure and sharpening my trading my skills also for my trade journal**
Thanks a lot for your support

WTI Oil H4 | Pullback resistance at 50% Fibonacci retracementWTI oil (USOIL) is rising towards a pullback resistance and could potentially reverse off this level to drop lower.
Sell entry is at 60.49 which is a pullback resistance that aligns with the 50.0% Fibonacci retracement.
Stop loss is at 62.30 which is a level that sits above the 61.8% Fibonacci retracement and an overlap resistance.
Take profit is at 56.68 which is a multi-swing-low support.
High Risk Investment Warning
Trading Forex/CFDs on margin carries a high level of risk and may not be suitable for all investors. Leverage can work against you.
Stratos Markets Limited (tradu.com):
CFDs are complex instruments and come with a high risk of losing money rapidly due to leverage. 63% of retail investor accounts lose money when trading CFDs with this provider. You should consider whether you understand how CFDs work and whether you can afford to take the high risk of losing your money.
Stratos Europe Ltd (tradu.com):
CFDs are complex instruments and come with a high risk of losing money rapidly due to leverage. 63% of retail investor accounts lose money when trading CFDs with this provider. You should consider whether you understand how CFDs work and whether you can afford to take the high risk of losing your money.
Stratos Global LLC (tradu.com):
Losses can exceed deposits.
Please be advised that the information presented on TradingView is provided to Tradu (‘Company’, ‘we’) by a third-party provider (‘TFA Global Pte Ltd’). Please be reminded that you are solely responsible for the trading decisions on your account. There is a very high degree of risk involved in trading. Any information and/or content is intended entirely for research, educational and informational purposes only and does not constitute investment or consultation advice or investment strategy. The information is not tailored to the investment needs of any specific person and therefore does not involve a consideration of any of the investment objectives, financial situation or needs of any viewer that may receive it. Kindly also note that past performance is not a reliable indicator of future results. Actual results may differ materially from those anticipated in forward-looking or past performance statements. We assume no liability as to the accuracy or completeness of any of the information and/or content provided herein and the Company cannot be held responsible for any omission, mistake nor for any loss or damage including without limitation to any loss of profit which may arise from reliance on any information supplied by TFA Global Pte Ltd.
The speaker(s) is neither an employee, agent nor representative of Tradu and is therefore acting independently. The opinions given are their own, constitute general market commentary, and do not constitute the opinion or advice of Tradu or any form of personal or investment advice. Tradu neither endorses nor guarantees offerings of third-party speakers, nor is Tradu responsible for the content, veracity or opinions of third-party speakers, presenters or participants.

USOIL - Bearish Double TOPHello Traders !
The USOIL price formed a double top pattern.
Currently, The neckline is broken !
So, I expect a bearish move📉
________________
TARGET: 59.410🎯

WTI OIL Bearish Cross confirming more selling ahead.WTI Oil (USOIL) has been trading within a Channel Down pattern since the December 06 2024 Low. The last Bearish Leg started on a 1D MA200 (orange trend-line) rejection and was confirmed with a 1D MACD Bearish Cross 3 days after.
At the moment we have had a 1D MA50 (blue trend-line) rejection and today we will complete a new 1D MACD Bearish Cross. As a result, we almost have a new sell confirmation. Once completed, sell and target $53.50 (-19% from the point of the rejection).
-------------------------------------------------------------------------------
** Please LIKE 👍, FOLLOW ✅, SHARE 🙌 and COMMENT ✍ if you enjoy this idea! Also share your ideas and charts in the comments section below! This is best way to keep it relevant, support us, keep the content here free and allow the idea to reach as many people as possible. **
-------------------------------------------------------------------------------
Disclosure: I am part of Trade Nation's Influencer program and receive a monthly fee for using their TradingView charts in my analysis.
💸💸💸💸💸💸
👇 👇 👇 👇 👇 👇

Oil - Short Term Sell Trade Update!!!Hi Traders, on April 17th I shared this idea "Oil - Looking To Sell Pullbacks In The Short Term"
I expected to see bearish continuation until the two Fibonacci resistance zones hold. You can read the full post using the link above.
The price is currently holding in the first Fibonacci resistance zone.
Until both the Fibonacci resistance zones hold my bearish view still remains.
If you enjoy this idea, don’t forget to LIKE 👍, FOLLOW ✅, SHARE 🙌, and COMMENT ✍! Drop your thoughts and charts below to keep the discussion going. Your support helps keep this content free and reach more people! 🚀
-------------------------------------------------------------------------------------------------------------------
Disclosure: I am part of Trade Nation's Influencer program and receive a monthly fee for using their TradingView charts in my analysis.

WTI Oil H4 | Bearish reversal off an overlap resistance?WTI oil (USOIL) is rising towards an overlap resistance and could potentially reverse off this level to drop lower.
Sell entry is at 62.04 which is an overlap resistance.
Stop loss is at 64.95 which is a level that sits above a multi-swing-high resistance.
Take profit is at 59.18 which is a swing-low support that aligns close to a 61.8% Fibonacci retracement.
High Risk Investment Warning
Trading Forex/CFDs on margin carries a high level of risk and may not be suitable for all investors. Leverage can work against you.
Stratos Markets Limited (tradu.com):
CFDs are complex instruments and come with a high risk of losing money rapidly due to leverage. 63% of retail investor accounts lose money when trading CFDs with this provider. You should consider whether you understand how CFDs work and whether you can afford to take the high risk of losing your money.
Stratos Europe Ltd (tradu.com):
CFDs are complex instruments and come with a high risk of losing money rapidly due to leverage. 63% of retail investor accounts lose money when trading CFDs with this provider. You should consider whether you understand how CFDs work and whether you can afford to take the high risk of losing your money.
Stratos Global LLC (tradu.com):
Losses can exceed deposits.
Please be advised that the information presented on TradingView is provided to Tradu (‘Company’, ‘we’) by a third-party provider (‘TFA Global Pte Ltd’). Please be reminded that you are solely responsible for the trading decisions on your account. There is a very high degree of risk involved in trading. Any information and/or content is intended entirely for research, educational and informational purposes only and does not constitute investment or consultation advice or investment strategy. The information is not tailored to the investment needs of any specific person and therefore does not involve a consideration of any of the investment objectives, financial situation or needs of any viewer that may receive it. Kindly also note that past performance is not a reliable indicator of future results. Actual results may differ materially from those anticipated in forward-looking or past performance statements. We assume no liability as to the accuracy or completeness of any of the information and/or content provided herein and the Company cannot be held responsible for any omission, mistake nor for any loss or damage including without limitation to any loss of profit which may arise from reliance on any information supplied by TFA Global Pte Ltd.
The speaker(s) is neither an employee, agent nor representative of Tradu and is therefore acting independently. The opinions given are their own, constitute general market commentary, and do not constitute the opinion or advice of Tradu or any form of personal or investment advice. Tradu neither endorses nor guarantees offerings of third-party speakers, nor is Tradu responsible for the content, veracity or opinions of third-party speakers, presenters or participants.

WTI CRUDE OIL: Buy signal at the bottom of the Channel Up.WTI Crude Oil turned bearish on its 1D technical outlook (RSI = 42.387, MACD = -1.000, ADX = 27.186) as it crossed under the 4H MA50. Still, it hit and is so far contained at the bottom of the Channel Up, which makes it a strong short term buy opportunity. Aim for the 4H MA200 (TP = 65.00).
## If you like our free content follow our profile to get more daily ideas. ##
## Comments and likes are greatly appreciated. ##

#USOIL 4HUSOIL (4H Timeframe) Analysis
Market Structure:
The chart is forming a classic Head and Shoulders pattern, which often signals a potential reversal from an uptrend to a downtrend. The left shoulder, head, and right shoulder are clearly visible, and the neckline is an important support zone to monitor.
Forecast:
A sell opportunity may be considered if the price breaks and closes below the neckline with confirmation. This breakdown could indicate the start of a bearish trend continuation.
Key Levels to Watch:
- Entry Zone: Look for a sell setup once the neckline is broken and retested as resistance.
- Risk Management:
- Stop Loss: Positioned above the right shoulder to minimize risk.
- Take Profit: Target nearby support zones or use a measured move technique based on the pattern's height.
Market Sentiment:
As long as the neckline holds and the breakdown is confirmed, bearish momentum is likely. A failure to break below the neckline would delay or invalidate the selling setup.

Is this still the ‘Top Trade’ of 2025? (WTI crude oil)It’s not a big secret actually- I’m talking about crude oil!
In the final week of 2024, the team and I highlighted two versions of the WTI crude oil weekly chart and asked ‘is this the top trade of 2024?’
Version 1 has already happened, WTI crude hit $55 per barrel, the downside objective of the smaller triangle pattern on the chart.
Version 2 showed a much larger triangle pattern (which we show again this week) and had a downside target of nearly $30! It would take a lot of conviction to ride the price that far down, but could crude oil still move a lot lower this year?
What’s interesting is that this is still one of the ‘less talked about’ situations in the market today because of the huge volatility seen in both stocks, forex and fixed income.
And I like that nobody’st talking about it - because you don’t want everyone in on it - that means the move could already be over.
Crude oil hit a five-year low. That’s meaningful.
Strong markets don’t hit 5-year lows, weak markets do. And we like to sell weak markets.
Of course, ‘oversold markets’ hit 5-year lows too - and that largely explains the ‘bottom feeders’ who bought WTI crude oil at $55.
Downside volatility got extreme owing to Trump’s tariffs and mean-reversion helped it rebound on news of the 90-day pause, much like stock markets.
I am completely open to the idea that $55 is a multi-year low and essentially marked the bottom. The huge Hammer reversal candlestick pattern adds weight to that idea.
But with the price having hit $65 last week, buying the lows is yesterday’s trade. What do we do today?
We will be looking to do what we said in Week 53 of 2024 in case crude oil turns out to be the ‘top trade of 2025’ as we imagined.
By the way, Brent crude oil has a very similar setup so this is not a ‘US oil’ thing.
There are two parts to trading ‘planning the trade, and trading the plan’.
There isn’t much use in making a plan, and not taking the trade.
There are always reasons not to take a trade- but if it’s a ‘good trade’ that fits the rules of your trading strategy, then those reasons are usually just ‘noise’.
WTI Crude (USO/USD)
Long term chart (weekly)
Trend: Down
Phase: Re-test of breakdown
Resistance = $70
Support = $55
Price action: Price has broken down, rebounded and is now testing the breakdown level, while under the 30-week moving average. Should the price break back over the broken long term rising trendline then we know the idea, or at least the timing on the idea is not right.
View: Bearish while under broken up-sloping long term support

CRUDE OIL Move Down Ahead! Sell!
Hello,Traders!
USOIL was making a
Bullish correction but
It is in the downtrend
Overall, so as the price
Is hovering beneath the
Horizontal resistance
Of 64.80$ from where
We will be expecting a
Local bearish correction
Sell!
Comment and subscribe to help us grow!
Check out other forecasts below too!
Disclosure: I am part of Trade Nation's Influencer program and receive a monthly fee for using their TradingView charts in my analysis.

BRIEFING Week #17 : AAPL's fate is the SP'sHere's your weekly update ! Brought to you each weekend with years of track-record history..
Don't forget to hit the like/follow button if you feel like this post deserves it ;)
That's the best way to support me and help pushing this content to other users.
Kindly,
Phil

Buy idea on Crude Oil (CL1!)Based on :
- US10Y Leading long spike
- Commercials and Non Commercials at Extremes
- Open Interest at Extremes
- Cycles and quantitative data
- Undervalued conditions
-Demand zone

CRUDE OIL BEARISH WEDGE|SHORT|
✅CRUDE OIL has formed a
Bearish wedge pattern and
Then made a breakout and a
Pullback so we are locally
Bearish biased and we will
Be expecting a further
Bearish move down
SHORT🔥
✅Like and subscribe to never miss a new idea!✅
Disclosure: I am part of Trade Nation's Influencer program and receive a monthly fee for using their TradingView charts in my analysis.

OIL...SHORT BLACKBULL:WTI
is approaching the key resistance zone at .
I'm watching closely for a valid reaction before considering any position.
***If the level breaks and price retests it successfully, I may consider a counter-directional setup.

WTI crude about to resume lower?WTI formed a large bearish engulfing candle on its daily chart yesterday near the key $65 resistance level. Was that an indication that prices have ended their corrective bounce? Time will tell, but today's oil prices have bounced back. With the trade uncertainty in the background, demand concerns remain high.
So, I wouldn't be surprised if prices were to resume lower from here. The trend is clearly bearish with the moving averages all pointing lower, not to mention the lower highs and lower lows.
If the selling resumes, watch for possible bounces at the next key round handles like $62, $61 and $60. But there is always the possibility of a sweep below this month's earlier lows if macro concerns intensify.
Meanwhile, the bullish idea is off the table for me for now until we see some progress in US-China trade talks at least, or if prices show a major bullish reversal signal.
By Fawad Razaqzada, market analyst with FOREX.com

WTI OIL Oversold rebound at the bottom of 7-month Channel Down.WTI Oil (USOIL) hit last week the bottom (Lower Lows trend-line) of the 7-month Channel Down while its 1D RSI turned oversold (<30.00), the lowest it's been since March 2020 and the COVID crash.
Naturally, the price rebounded but still hasn't even tested the 1D MA50 (blue trend-line), which indicates that it remains a strong medium-term buy opportunity. With the previous Lower Low almost reaching the 0.786 Fibonacci retracement level, we expect to see at least $72.50 in the medium-term.
-------------------------------------------------------------------------------
** Please LIKE 👍, FOLLOW ✅, SHARE 🙌 and COMMENT ✍ if you enjoy this idea! Also share your ideas and charts in the comments section below! This is best way to keep it relevant, support us, keep the content here free and allow the idea to reach as many people as possible. **
-------------------------------------------------------------------------------
Disclosure: I am part of Trade Nation's Influencer program and receive a monthly fee for using their TradingView charts in my analysis.
💸💸💸💸💸💸
👇 👇 👇 👇 👇 👇

Crude Oil Is Making Hard Work of Gains into ResistanceCride oil may have recovered back above $60, but it is making hard work of it. And with resistance looming and large specs increasing short bets, perhaps a pullback due. But does that mean a break below $60 is imminent?
Matt Simpson, Market Analyst at Forex.com and City Index

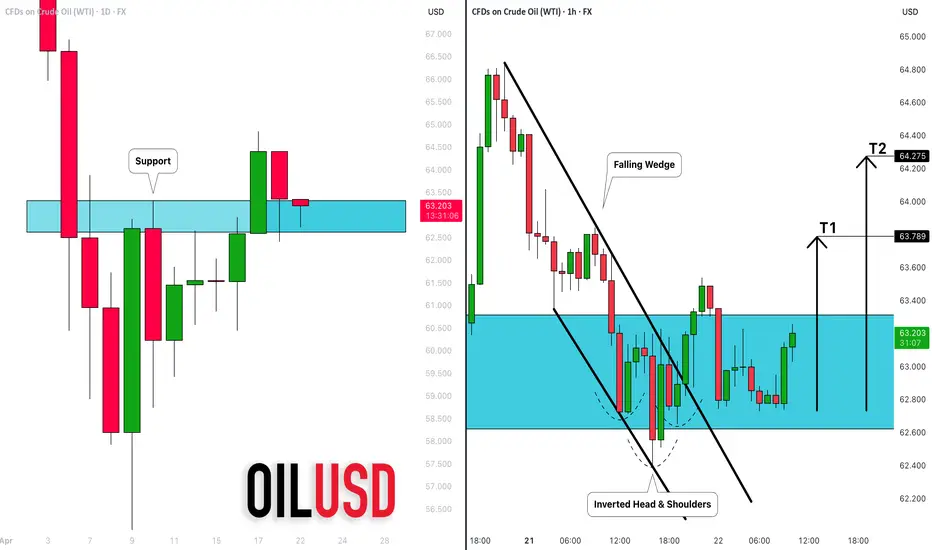
CRUDE OIL (WTI): Long From Support Explained
There is a high chance that WTI Crude Oil will go up
from the underlined key daily support.
As a confirmation, the price violated both a neckline of an inverted
head & shoulders pattern and a resistance line of a falling wedge
on an hourly time frame.
Goals: 63.780 / 64.275
❤️Please, support my work with like, thank you!❤️
Habibi, the Price is Right at 70-79$Habibi, the Price is Right
Post Content (with emojis version of title at the top):
🤝🛢️ Habibi, the Price is Right at 70–79$ 💸🎯
The Call That Never Happened (But Might Have)
📞 I was just updating my crude oil chart when suddenly… my phone rang.
No caller ID. I answered. And somehow— I was patched into a live call between:
🍊🦅 Trump and 🌴👑 the King of Saudi Arabia.
They mistook me for a translator.
So naturally, I stayed on the line.
Here’s how the oil market actually got settled...
🍊🦅 Trump: “Hello? Who is this? I have the best phone security. The Chinese can’t hack it. Nobody can.”
🌴👑 King: “Donald, ya’ani... it’s me!”
🍊🦅 Trump: “Me who? I know the most people, you sound like an immigrant, do you have a visa?”
🌴👑 King: “Your King of Saudi Arabia, habibi! Your favorite oil guy! I can afford all the Visas and Mastercards!”
🍊🦅 Trump: “My King! My favorite King, my guy, what a Tremendous timing. Oil prices are way too high. I need cheap oil to start my tariff wars again! ”
🌴👑 King: “Habibi, we said $88! We need to fund flying taxis and desert ski slopes. The Line isn’t building itself, ya’ani.”
🍊🦅 Trump: “But I gave you the PGA Tour! LIV Golf is huge ! You’re welcome.”
🌴👑 King: “ Mashallah , yes... but we paid this Tiger Woods $800 million just to say no. Wallah , that’s expensive rejection, Donald.”
🍊🦅 Trump: “That’s nothing my King. Peanuts. Melania’s token did better than that. Peanuts my King, peanuts for the camels. What about $76?”
🌴👑 King: “Cristiano Ronaldo costs $200M a year! And he wants an oasis with seven pools! And now we want Messi from Miami and Ronaldinho. Mashallah! ”
🍊🦅 Trump: “I need lower gas prices my King or I can’t revive the economy!
And you made Messi cry in the World Cup, my King — not my fault. You kicked his ass, not my fault..I need to check on his visa if he is legally in my great country (again) or i will send him to El Salvador and you can get him cheap from there”
🌴👑 King: “Inshallah. But we’re also building a ski slope in the desert. With real snow.
We need $88.88 oil Donald! 88$ minimum”
💙🧠 FXPROFESSOR: “Uh... sorry to interrupt... I don’t know how I got on this call... but I think I can help.
I understand charts.”
🍊🦅 Trump: “Who is that?!I know the voice, who is that?”
💙🧠 FXPROFESSOR: “I’m the FXPROFESSOR. And I might have a solution for you.
It’s called… The Compromise Zone. ”
🌴👑 King: “Ya’ani… go on.”
💙🧠 FXPROFESSOR: “$70–79. That’s where the technicals align.
Trump gets a few more months below that, help him with low oil for inflation until he can deal with Powell, then you two take it sideways in that range 70-79$ and you get stability for The Line, the AI and all the great things the Kingdom is working on.”
🍊🦅 Trump: “I know the Professor! I follow him on TradingView. Genius. Huge brain. One of the best brains. I bought Ethereum at 4400$ because of him and I'm down 60% but it's ok..peanuts, great guy the Professor, great guy”
🌴👑 King: “Inshallah. But we still have losses. Ya’ani... Donald, how do we cover them? And how did this guy get on our call habibi”
🍊🦅 Trump: “Easy King, it's easy! We launch a Great meme coin together, me and you, the greatest token in the world. We call it — $KINGOFARABIA —meme token, we Pump it on Solana. We'll pump it like you pump Oil. Gonna be Great, we will Cover the gap my King.”
🌴👑 King: “We tried blockchain before. Royal IT guy lost the wallet. Had to… correct the situation. Plus i also invested on Ethereum Donald, Solana is for the kids and the stuff”
🍊🦅 Trump: “Let's find a solution my King and i will do this for you: I’ll send Jerome Powell. A gift. Let him run your rates. Take him for free (please take him)”
🌴👑 King: “Jerome is good for my country, he is so cold he will make the temeratures drop 2 degrees, ok we take him but One more thing Donald… I want Taylor Swift at my nephew’s wedding? And please she comes dressed properly and act respectfully”
🍊🦅 Trump: “Done. Nobody says no to me. Except from the Feds, the Europeans, the Japanese, Canada and the penguins i taxed by accident. But that's ok, we make America Great again. I will send you the new Trump memorabilia collection, the best MAGA t-shirt for you my King. It's still made in China but it's soon to be made here at home, soon. ”
🌴👑 King: “Wait Donald! I just remembered.. Also... we want UFC in Riyadh, for ever! Big events. I want Dana White to agree and i want a podcast with Josh Rogans.”
🍊🦅 Trump: “I’ll talk to Joe Rogan, great guy Joe. I’ll call Dana. Maybe Khabib makes a comeback. I know fighters. Strong fighters. Big ratings. They love me. They love you too my King”
📉 And that’s how oil found balance between memes, monarchs, and macro.
📊 Chart Insights – USOIL 12h
❌ $93 = clear rejection
🟦 Compromise Zone: $70–79
🟢 $88 = Saudi’s macro target
🔻 $70 = Trump’s inflation floor
🔄 Consolidation expected unless OPEC or Powell shift the game
💬 What do you think? Are we just memeing the macro?
Or is this really how the oil market works in 2025?
One Love,
The FXPROFESSOR 💙🧠
Disclaimer: This is a fictional satire written for entertainment and educational purposes.
Any resemblance to real negotiations is purely… coincidental.
The chart is real, though — and so is the technical compromise.
Special Salam and much love to my friends in Saudi Arabia 🇸🇦 — the most wonderful people I’ve met in the world.The image is not of the new King but that's ok, great image.It's great! ❤️
