Crude Oil Is Making Hard Work of Gains into ResistanceCride oil may have recovered back above $60, but it is making hard work of it. And with resistance looming and large specs increasing short bets, perhaps a pullback due. But does that mean a break below $60 is imminent?
Matt Simpson, Market Analyst at Forex.com and City Index
WTI

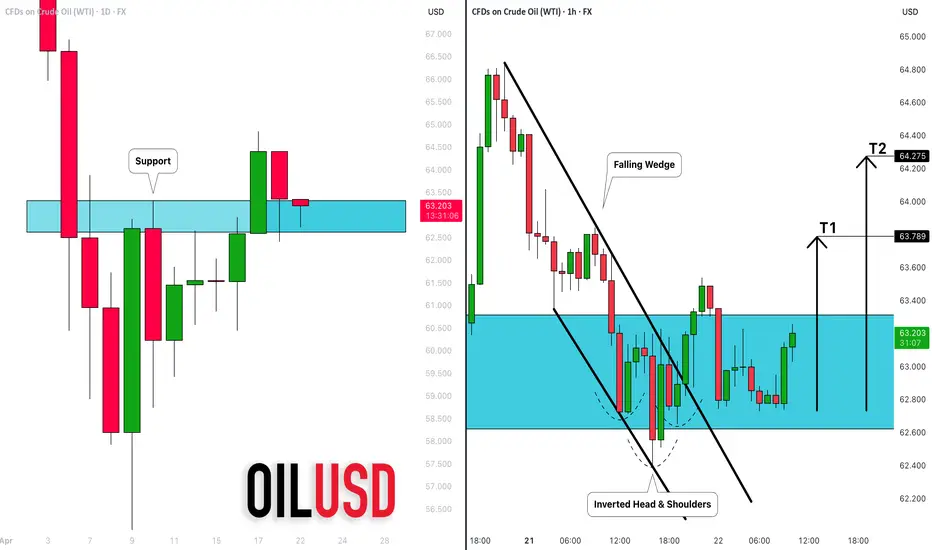
CRUDE OIL (WTI): Long From Support Explained
There is a high chance that WTI Crude Oil will go up
from the underlined key daily support.
As a confirmation, the price violated both a neckline of an inverted
head & shoulders pattern and a resistance line of a falling wedge
on an hourly time frame.
Goals: 63.780 / 64.275
❤️Please, support my work with like, thank you!❤️
Habibi, the Price is Right at 70-79$Habibi, the Price is Right
Post Content (with emojis version of title at the top):
🤝🛢️ Habibi, the Price is Right at 70–79$ 💸🎯
The Call That Never Happened (But Might Have)
📞 I was just updating my crude oil chart when suddenly… my phone rang.
No caller ID. I answered. And somehow— I was patched into a live call between:
🍊🦅 Trump and 🌴👑 the King of Saudi Arabia.
They mistook me for a translator.
So naturally, I stayed on the line.
Here’s how the oil market actually got settled...
🍊🦅 Trump: “Hello? Who is this? I have the best phone security. The Chinese can’t hack it. Nobody can.”
🌴👑 King: “Donald, ya’ani... it’s me!”
🍊🦅 Trump: “Me who? I know the most people, you sound like an immigrant, do you have a visa?”
🌴👑 King: “Your King of Saudi Arabia, habibi! Your favorite oil guy! I can afford all the Visas and Mastercards!”
🍊🦅 Trump: “My King! My favorite King, my guy, what a Tremendous timing. Oil prices are way too high. I need cheap oil to start my tariff wars again! ”
🌴👑 King: “Habibi, we said $88! We need to fund flying taxis and desert ski slopes. The Line isn’t building itself, ya’ani.”
🍊🦅 Trump: “But I gave you the PGA Tour! LIV Golf is huge ! You’re welcome.”
🌴👑 King: “ Mashallah , yes... but we paid this Tiger Woods $800 million just to say no. Wallah , that’s expensive rejection, Donald.”
🍊🦅 Trump: “That’s nothing my King. Peanuts. Melania’s token did better than that. Peanuts my King, peanuts for the camels. What about $76?”
🌴👑 King: “Cristiano Ronaldo costs $200M a year! And he wants an oasis with seven pools! And now we want Messi from Miami and Ronaldinho. Mashallah! ”
🍊🦅 Trump: “I need lower gas prices my King or I can’t revive the economy!
And you made Messi cry in the World Cup, my King — not my fault. You kicked his ass, not my fault..I need to check on his visa if he is legally in my great country (again) or i will send him to El Salvador and you can get him cheap from there”
🌴👑 King: “Inshallah. But we’re also building a ski slope in the desert. With real snow.
We need $88.88 oil Donald! 88$ minimum”
💙🧠 FXPROFESSOR: “Uh... sorry to interrupt... I don’t know how I got on this call... but I think I can help.
I understand charts.”
🍊🦅 Trump: “Who is that?!I know the voice, who is that?”
💙🧠 FXPROFESSOR: “I’m the FXPROFESSOR. And I might have a solution for you.
It’s called… The Compromise Zone. ”
🌴👑 King: “Ya’ani… go on.”
💙🧠 FXPROFESSOR: “$70–79. That’s where the technicals align.
Trump gets a few more months below that, help him with low oil for inflation until he can deal with Powell, then you two take it sideways in that range 70-79$ and you get stability for The Line, the AI and all the great things the Kingdom is working on.”
🍊🦅 Trump: “I know the Professor! I follow him on TradingView. Genius. Huge brain. One of the best brains. I bought Ethereum at 4400$ because of him and I'm down 60% but it's ok..peanuts, great guy the Professor, great guy”
🌴👑 King: “Inshallah. But we still have losses. Ya’ani... Donald, how do we cover them? And how did this guy get on our call habibi”
🍊🦅 Trump: “Easy King, it's easy! We launch a Great meme coin together, me and you, the greatest token in the world. We call it — $KINGOFARABIA —meme token, we Pump it on Solana. We'll pump it like you pump Oil. Gonna be Great, we will Cover the gap my King.”
🌴👑 King: “We tried blockchain before. Royal IT guy lost the wallet. Had to… correct the situation. Plus i also invested on Ethereum Donald, Solana is for the kids and the stuff”
🍊🦅 Trump: “Let's find a solution my King and i will do this for you: I’ll send Jerome Powell. A gift. Let him run your rates. Take him for free (please take him)”
🌴👑 King: “Jerome is good for my country, he is so cold he will make the temeratures drop 2 degrees, ok we take him but One more thing Donald… I want Taylor Swift at my nephew’s wedding? And please she comes dressed properly and act respectfully”
🍊🦅 Trump: “Done. Nobody says no to me. Except from the Feds, the Europeans, the Japanese, Canada and the penguins i taxed by accident. But that's ok, we make America Great again. I will send you the new Trump memorabilia collection, the best MAGA t-shirt for you my King. It's still made in China but it's soon to be made here at home, soon. ”
🌴👑 King: “Wait Donald! I just remembered.. Also... we want UFC in Riyadh, for ever! Big events. I want Dana White to agree and i want a podcast with Josh Rogans.”
🍊🦅 Trump: “I’ll talk to Joe Rogan, great guy Joe. I’ll call Dana. Maybe Khabib makes a comeback. I know fighters. Strong fighters. Big ratings. They love me. They love you too my King”
📉 And that’s how oil found balance between memes, monarchs, and macro.
📊 Chart Insights – USOIL 12h
❌ $93 = clear rejection
🟦 Compromise Zone: $70–79
🟢 $88 = Saudi’s macro target
🔻 $70 = Trump’s inflation floor
🔄 Consolidation expected unless OPEC or Powell shift the game
💬 What do you think? Are we just memeing the macro?
Or is this really how the oil market works in 2025?
One Love,
The FXPROFESSOR 💙🧠
Disclaimer: This is a fictional satire written for entertainment and educational purposes.
Any resemblance to real negotiations is purely… coincidental.
The chart is real, though — and so is the technical compromise.
Special Salam and much love to my friends in Saudi Arabia 🇸🇦 — the most wonderful people I’ve met in the world.The image is not of the new King but that's ok, great image.It's great! ❤️

WTI Oil H4 | Potential bullish bounceWTI oil (USOIL) is falling towards a pullback support and could potentially bounce off this level to climb higher.
Buy entry is at 62.01 which is a pullback support.
Stop loss is at 58.60 which is a level that lies underneath a swing-low support and the 61.8% Fibonacci retracement.
Take profit is at 65.63 which is a pullback resistance that aligns with the 61.8% Fibonacci retracement.
High Risk Investment Warning
Trading Forex/CFDs on margin carries a high level of risk and may not be suitable for all investors. Leverage can work against you.
Stratos Markets Limited (tradu.com):
CFDs are complex instruments and come with a high risk of losing money rapidly due to leverage. 63% of retail investor accounts lose money when trading CFDs with this provider. You should consider whether you understand how CFDs work and whether you can afford to take the high risk of losing your money.
Stratos Europe Ltd (tradu.com):
CFDs are complex instruments and come with a high risk of losing money rapidly due to leverage. 63% of retail investor accounts lose money when trading CFDs with this provider. You should consider whether you understand how CFDs work and whether you can afford to take the high risk of losing your money.
Stratos Global LLC (tradu.com):
Losses can exceed deposits.
Please be advised that the information presented on TradingView is provided to Tradu (‘Company’, ‘we’) by a third-party provider (‘TFA Global Pte Ltd’). Please be reminded that you are solely responsible for the trading decisions on your account. There is a very high degree of risk involved in trading. Any information and/or content is intended entirely for research, educational and informational purposes only and does not constitute investment or consultation advice or investment strategy. The information is not tailored to the investment needs of any specific person and therefore does not involve a consideration of any of the investment objectives, financial situation or needs of any viewer that may receive it. Kindly also note that past performance is not a reliable indicator of future results. Actual results may differ materially from those anticipated in forward-looking or past performance statements. We assume no liability as to the accuracy or completeness of any of the information and/or content provided herein and the Company cannot be held responsible for any omission, mistake nor for any loss or damage including without limitation to any loss of profit which may arise from reliance on any information supplied by TFA Global Pte Ltd.
The speaker(s) is neither an employee, agent nor representative of Tradu and is therefore acting independently. The opinions given are their own, constitute general market commentary, and do not constitute the opinion or advice of Tradu or any form of personal or investment advice. Tradu neither endorses nor guarantees offerings of third-party speakers, nor is Tradu responsible for the content, veracity or opinions of third-party speakers, presenters or participants.

RB - US Gasoline Futures to Decline due to Lower ConsumptionNYMEX: RBOB Gasoline Futures ( NYMEX:RB1! )
WTI crude oil futures declined 13.4% since the beginning of the year. It dropped as much as $20 from the mid-January peak of $80 a barrel, before recovering to $64 last week.
In my commentary on February 11th, “Reversal of US Energy Policy Could Push Crude Oil Lower”, I described the main reasons behind the oil market correction:
• US oil production will rise, benefiting from the new energy policy by President Trump as “Drill Baby Drill”
• OPEC+ to increase crude oil production, ending its voluntary production cuts
• Threats of Tariffs could curtail global oil demand
First, on March 31st, the U.S. Energy Information Administration (“EIA”) reported that U.S. field production of crude oil reached 13.146 million barrels per day (mb/pd), up 592 mb/pd or +4.7% from the year-ago level. This is the highest January production level since 1920!
Second, on April 3rd, the OPEC+ members met and decided to end the voluntary production cuts, gradually bringing back 2.2 mb/pd additional supply to the oil market.
Third, Reciprocal Tariff has brought the container shipping industry to its knees. MSC, Maersk, CMA CGM, and Hapag-Lloyd, which ferry goods for retail giants like Walmart, Target, and Home Depot, have seen sharp declines in booking. The tariff uncertainty caused many importers to cancel their orders. This could cause major consequences.
According to Statista, about 71% of the items sold on Amazon were sourced from China. The procurement for Christmas-season products has already begun. Without a US-China trade deal, US consumers could expect fewer gift options at higher prices. Inflation could rebound sooner, as merchants deplete their inventory and face a supply shortage.
This could hurt gasoline demand. On the one hand, higher shopping costs cut into consumer spending budget; on the other, fewer deals at retailers discourage shoppers from taking a trip.
On April 18th, American Automotive Association (“AAA”) reported that national average price for regular gas was $3.182 per gallon, down 14% from the year-ago level.
On April 19th, RBOB gasoline futures quoted $2.0839 per gallon, up 1.8% year-to-date. This contrasts sharply with the down trends in the spot market and the oil futures market.
The April EIA Short-Term Energy Outlook (“STEO”) report states that U.S. retail price for regular gasoline averages $3.10 per gallon in its forecast for this summer (April–September), about 20 cents less than the previous forecast in March. The lower price forecast mostly reflects the expectation of lower crude oil prices. If realized, the forecast gasoline price would be the lowest inflation adjusted summer average price since 2020.
In my opinion, gasoline prices could stay relatively high during the peak summer driving season. After that, Gas prices could turn significantly lower through the end of the year.
Commitment of Traders shows bearish sentiment
The CFTC Commitments of Traders report shows that on April 15th, total Open Interest (OI) for NYMEX RBOB Futures is 418,277 contracts. “Managed Money” (i.e., hedge funds) own 52,114 in Long, 36,615 in Short and 47,628 in Spreading positions.
• While they maintain a long-short ratio of 1.4:1, hedge funds have reduced long positions by 5,198 (-9%) while increasing short positions by 6,021 (+14%).
• This indicates that “Smart Money” is becoming less bullish on gasoline.
Trade Setup with RBOB Futures
If a trader shares a similar view, he could express his opinion by shorting the NYMEX RBOB Gasoline Futures ( CSE:RB ).
RB contracts have a notional value of 42,000 gallons of gasoline oil. With Friday settlement price of $2.0149, each September contract (RBU5) has a notional value of $84,626. Buying or selling one contract requires an initial margin of $5,840.
Hypothetically, a trader shorts September RB contract and RBOB prices drop to $1.90. A short futures position would gain $4,826 (= (2.0149 – 1.90) x $42000). Using the initial margin as a cost base, a theoretical return would be +82.6% (= 4826 / 5840).
The risk of shorting gasoline futures is rising oil and gas prices. Investors could lose part of or all their initial margin. A trader could set a stop loss while establishing his short position. In the above example, the trader could set stop-loss at $2.10 when entering the short order at $2.0149. If gasoline price continues to rise, the maximum loss would be $3,574 ( = (2.10 – 2.0149) *42000).
Happy Trading.
Disclaimers
*Trade ideas cited above are for illustration only, as an integral part of a case study to demonstrate the fundamental concepts in risk management under the market scenarios being discussed. They shall not be construed as investment recommendations or advice. Nor are they used to promote any specific products, or services.
CME Real-time Market Data help identify trading set-ups and express my market views. If you have futures in your trading portfolio, you can check out on CME Group data plans available that suit your trading needs www.tradingview.com

BRIEFING Week #16 : ObservationHere's your weekly update ! Brought to you each weekend with years of track-record history..
Don't forget to hit the like/follow button if you feel like this post deserves it ;)
That's the best way to support me and help pushing this content to other users.
Kindly,
Phil

Crude rallies on Trump China trade optimism, WTI test key levelCrude oil prices were already on the ascendency but have just hit fresh highs on the day after the latest Trump remarks:
WILL MAKE GOOD DEAL WITH CHINA
WE WILL HAVE A DEAL WITH CHINA
But...
*TRUMP SAYS HE'S IN 'NO RUSH' TO CLOSE DEALS
Anyway WTI has risen to session highs, now testing a major resistance area around $65 give or take $1. The area is shaded on the chart. If we go above this zone then bullish, else the bears remain in control.
By Fawad Razaqzada, market analyst with FOREX.com
Oil - Looking To Sell Pullbacks In The Short TermH4 - Strong bearish move.
No opposite signs.
Currently it looks like a pullback is happening.
Expecting bearish continuation until the two Fibonacci resistance zones hold.
If you enjoy this idea, don’t forget to LIKE 👍, FOLLOW ✅, SHARE 🙌, and COMMENT ✍! Drop your thoughts and charts below to keep the discussion going. Your support helps keep this content free and reach more people! 🚀
--------------------------------------------------------------------------------------------------------------------
Disclosure: I am part of Trade Nation's Influencer program and receive a monthly fee for using their TradingView charts in my analysis.

April 17, 2025 - Powell, Japan & TrumpHello everyone, it’s April 17, 2025. Yesterday’s U.S. trading was pure market carnage. Semiconductors ( NASDAQ:NVDA , NASDAQ:AMD , NASDAQ:ASML ) were steamrolled as AI chip bans to China kicked in and Trump dropped another tariff bomb, hiking duties to 245%. That wiped $200 billion off Nvidia alone.
In Chicago, Powell stoked the flames, warning tariffs will fuel inflation and choke growth, and insisted he’s in no rush to cut rates. The CME_MINI:NQ1! tumbled 3%, the CME_MINI:SOX1! lost 4.1%, and bond futures plunged.
This morning, U.S. futures are up about 0.75% on headlines that Trump’s talks with Japanese negotiators are “going very well,” sparking rallies across Asia: Nikkei +1%, Hong Kong +2.7%, Shanghai +1%. It seems even a whiff of détente with Japan sends everyone scrambling back into risk assets.
On commodities, BLACKBULL:WTI jumps to $63.35 amid fresh U.S. sanctions on Iran and OPEC output cuts; OANDA:XAUUSD rockets to $3,352 /oz; INDEX:BTCUSD hovers near $83,500.
Today watch the ECB’s rate cut, Powell’s next speech, Philly Fed and jobless claims before the Good Friday shutdown. With Trump’s erratic tariff theatrics and Powell’s warning of higher inflation and slower growth, volatility is set to reign supreme. Buckle up.

Analysis of the BRENT chart with expectations for 2025-2026◽️Technically, all conditions for the completion of the second wave correction have been met, and now quotes can be safely reversed up. However, current events in the global economy do not yet provide grounds for confidently asserting this. Locally, the price may still be driven down to $50 per barrel and even slightly lower. One way or another, it is important to understand a simple thing: everything below $70 per barrel should be seen as an opportunity to buy oil and everything related to it cheaply.
◽️According to my estimates, there is probably still time for deliberation on purchases until the end of spring. But further, from the beginning of summer, I expect a sharp rise in prices amid the escalation in the Middle East. From above, in the $100-150 range, growth will likely be contained for some time, which will be interpreted as the formation of sub-waves (i)-(ii), where after sharp rise in the first sub-wave from approximately $50-60 to $120-130, a local correction will follow within the second sub-wave.
◽️The growth period may take 3-6 months, and the correction to it another 2-4 quarters, and then a breakout of the $120-150 resistance zone and further "to the moon" in the third waves is expected.
🙏 Thank you for your attention and 🚀 for the idea.
☘️ Good luck, take care!
📟 See you later.

#BRENT Gold/Oil Ratio, Stocks/Oil RatioOn chart I tried to fit three instruments at once:
1️⃣ Bottom (white) chart: Gold to Oil Ratio.
2️⃣ Middle (red) chart: BRENT crude oil price.
3️⃣ Top (blue) chart: Dow Jones Industrial Average to Oil Price Ratio.
1️⃣ The first thing to pay attention to is the white chart: GOLD/OIL Ratio , specifically where this ratio is today. Over the last 75 years of observation, the ratio has reached unprecedented levels. The spread is once again testing the record values of the COVID-19 hysteria of 2020, when panic caused oil prices to plummet sharply. At the current moment, the ⚖️Gold to Oil Ratio is around the 50 mark, meaning that one ounce of gold can buy as much as 50 barrels of oil. Over the last century, when the spread exceeded 25 barrels per ounce, it was interpreted as a moment of cheap oil relative to gold. Today, against the backdrop of the chaos reigning in the world, the GOLD/OIL Ratio is entering what can be called the " MAGA Mega Cheap Oil Zone" if it is again valued in gold, and not in fiat green piece of paper. Further, we should expect at least a return to its average values, and here three scenarios are possible:
1. First Scenario. Let's assume that today's price of $60-70 per barrel of oil is "fair" and this is where it belongs. In this case, gold is currently strongly overvalued, and it's time for a correction from $3300 to the $2500-2800 range.
2. Second Scenario. Everything is fine with gold, and it will continue to rise without correction. In this case, oil is severely undervalued relative to gold, and it's time for it to catch up so that the spread of 50 returns to its average values in the 10-25 range.
3. Third Scenario suggests that both oil is significantly undervalued and gold has risen too sharply, and now it's time for a correction in gold and a rise in oil prices.
In any of the three scenarios described above, the GOLD/OIL Ratio will sooner or later return to its normal values of the last century, that is, to the range of 10-25 barrels per ounce of gold. And most likely, we will see the third scenario unfold this year, where against the backdrop of a stock market crash, problems with liquidity in the global financial system, the entry of Western economies into recession, as well as the start of a full-scale war in the Middle East this summer, all of this together will provoke a correction in gold and an explosive growth in oil prices, and consequently, a return of the gold to oil ratio to its historical averages.
2️⃣ On the second (red) linear chart of BRENT crude oil prices , everything looks quite ordinary. If we briefly describe the chart for the last twenty years in simple terms, it's worth saying the following: since 2008, they have been trying in every possible way to keep the oil price below $130 per barrel, and as soon as the price approaches the $120-150 zone, some "invisible hand of the market" throws it down. The first test of this resistance zone occurred during the GFC global financial crisis of 2008, the second test with prolonged trading took place during the Eurozone debt crisis of 2011-2014 (culminating in the Greek default), and the third test was in 2022, as a consequence of the monetary madness of 2020 (global lockdown, unlimited QE, and as a result: a wave of monetary + structural inflation worldwide). One way or another, from the fourth or fifth time, the $120-150 per barrel boundary will be finally broken. And then the price above, like a samurai, "has no destination, only the path," and this path is upwards, "to the moon"🚀
3️⃣ Now it remains to consider the last (blue) chart at the top, the ⚖️Dow Jones Industrial Average to Oil Price Ratio . This chart should be understood as a long-term trend indicator of cycle changes in financial markets. When it rises, it implies a 10 or even 20-year growth cycle in the stock market, and accordingly, corrections in the commodity market. And when it falls, then vice versa, the cycle changes to growth in the commodities market and a correction in the risky stock market, which also lasts one or even two decades. Today, it can be said with certainty that since 2020, the cyclicality has changed, and we are just entering a ten or even twenty-year growth trend in the commodity sector, which portends a change from the "eternally" growing trend in the American stock market to a fall or at least a multi-year sideways movement a la the 1970s.
🙏 Thank you for your attention and 🚀 for the idea.
☘️ Good luck, take care!
📟 See you later.

WTI Oil H4 | Approaching a multi-swing-high resistanceWTI oil (USOIL) is rising towards a multi-swing-high resistance and could potentially reverse off this level to drop lower.
Sell entry is at 62.71 which is a multi-swing-high resistance.
Stop loss is at 65.90 which is a level that sits above the 61.8% Fibonacci retracement and a pullback resistance.
Take profit is at 57.01 which is a swing-low support.
High Risk Investment Warning
Trading Forex/CFDs on margin carries a high level of risk and may not be suitable for all investors. Leverage can work against you.
Stratos Markets Limited (tradu.com):
CFDs are complex instruments and come with a high risk of losing money rapidly due to leverage. 63% of retail investor accounts lose money when trading CFDs with this provider. You should consider whether you understand how CFDs work and whether you can afford to take the high risk of losing your money.
Stratos Europe Ltd (tradu.com):
CFDs are complex instruments and come with a high risk of losing money rapidly due to leverage. 63% of retail investor accounts lose money when trading CFDs with this provider. You should consider whether you understand how CFDs work and whether you can afford to take the high risk of losing your money.
Stratos Global LLC (tradu.com):
Losses can exceed deposits.
Please be advised that the information presented on TradingView is provided to Tradu (‘Company’, ‘we’) by a third-party provider (‘TFA Global Pte Ltd’). Please be reminded that you are solely responsible for the trading decisions on your account. There is a very high degree of risk involved in trading. Any information and/or content is intended entirely for research, educational and informational purposes only and does not constitute investment or consultation advice or investment strategy. The information is not tailored to the investment needs of any specific person and therefore does not involve a consideration of any of the investment objectives, financial situation or needs of any viewer that may receive it. Kindly also note that past performance is not a reliable indicator of future results. Actual results may differ materially from those anticipated in forward-looking or past performance statements. We assume no liability as to the accuracy or completeness of any of the information and/or content provided herein and the Company cannot be held responsible for any omission, mistake nor for any loss or damage including without limitation to any loss of profit which may arise from reliance on any information supplied by TFA Global Pte Ltd.
The speaker(s) is neither an employee, agent nor representative of Tradu and is therefore acting independently. The opinions given are their own, constitute general market commentary, and do not constitute the opinion or advice of Tradu or any form of personal or investment advice. Tradu neither endorses nor guarantees offerings of third-party speakers, nor is Tradu responsible for the content, veracity or opinions of third-party speakers, presenters or participants.

WTI Oil Inverse Head & Shoulders looking for a 4H MA50 break-outWTI Oil (USOIL) has formed an Inverse Head and Shoulders (IH&S) pattern, which is a technical bottom formation that signals the trend change to bullish.
So far the move is limited by the 4H MA50 (blue trend-line) which has 2 rejections already and is keeping the bullish break-out from happening.
If the market closes a candle above the 4H MA50, we will have a bullish confirmation signal. Our Target will be the 1.618 Fibonacci extension at $69.00 and not higher, because the long-term trend is limited by the wider Lower Highs trend-line of January.
-------------------------------------------------------------------------------
** Please LIKE 👍, FOLLOW ✅, SHARE 🙌 and COMMENT ✍ if you enjoy this idea! Also share your ideas and charts in the comments section below! This is best way to keep it relevant, support us, keep the content here free and allow the idea to reach as many people as possible. **
-------------------------------------------------------------------------------
Disclosure: I am part of Trade Nation's Influencer program and receive a monthly fee for using their TradingView charts in my analysis.
💸💸💸💸💸💸
👇 👇 👇 👇 👇 👇

WTI CRUDE OIL: Channel Down bottomed. Buy opportunity.WTI Crude Oil is heavily bearish on its 1D technical outlook (RSI = 38.039, MACD = -2.310, ADX = 38.046) as it is trading inside a Channel Down for more than 1 year. Last week's low has made a technical LL at the bottom of the pattern and the current consolidation indicates that this may be an attempt to initiate the new bullish wave. The 1D RSI recovered from being oversold previously and this potentially hints to a rebound over the 1D MA200. The last bullish wave crossed above the 0.618 Fibonacci marginally. Trade: long, TP = 71.00.
## If you like our free content follow our profile to get more daily ideas. ##
## Comments and likes are greatly appreciated. ##

OPEC Cuts Oil Demand Forecast While Increasing SupplyOil prices are feeling bearish pressure. OPEC was unable to increase production significantly last year to stabilize prices. High interest rates have kept global economies cool enough. However, starting in May, OPEC will begin unwinding its voluntary production cuts. The timing of this decision is questionable. Tariffs are expected to hit global economies hard, while the Fed is likely to hold rates steady for a few more months. Recession risks in the world’s two largest economies, the U.S. and China are rising.
OPEC has acknowledged this trend by lowering its oil demand forecast for 2025 and 2026 by nearly 10%.
If summarized:
Oil demand is expected to fall 10%, possibly more if the U.S. and/or China enter recession.
Trump is expected to boost U.S. drilling, increasing supply.
OPEC will start to unwind supply cuts, increasing supply.
Brent is likely to remain under bearish pressure throughout the year because of rising supply and falling demand. As long as the current fundamental outlook remains unchanged, upward moves should be viewed as selling opportunities. A downtrend channel has formed since mid-2023, with the lower boundary recently tested. There is now an upward reaction. If this continues toward the 68.25–70.70 zone—previously a demand zone, now a potential supply zone—traders may look for short entry setups, provided this zone holds, with nearby stop-loss levels.

WTI Oil D1 | Approaching a swing-high resistanceWTI oil (USOIL) could rise towards a swing-high resistance and potentially reverse off this level to drop lower.
Sell entry is at 62.71 which is a swing-high resistance.
Stop loss is at 66.00 which is a level that sits above the 61.8% Fibonacci retracement and a pullback resistance.
Take profit is at 58.18 which is a swing-low support.
High Risk Investment Warning
Trading Forex/CFDs on margin carries a high level of risk and may not be suitable for all investors. Leverage can work against you.
Stratos Markets Limited (tradu.com):
CFDs are complex instruments and come with a high risk of losing money rapidly due to leverage. 63% of retail investor accounts lose money when trading CFDs with this provider. You should consider whether you understand how CFDs work and whether you can afford to take the high risk of losing your money.
Stratos Europe Ltd (tradu.com):
CFDs are complex instruments and come with a high risk of losing money rapidly due to leverage. 63% of retail investor accounts lose money when trading CFDs with this provider. You should consider whether you understand how CFDs work and whether you can afford to take the high risk of losing your money.
Stratos Global LLC (tradu.com):
Losses can exceed deposits.
Please be advised that the information presented on TradingView is provided to Tradu (‘Company’, ‘we’) by a third-party provider (‘TFA Global Pte Ltd’). Please be reminded that you are solely responsible for the trading decisions on your account. There is a very high degree of risk involved in trading. Any information and/or content is intended entirely for research, educational and informational purposes only and does not constitute investment or consultation advice or investment strategy. The information is not tailored to the investment needs of any specific person and therefore does not involve a consideration of any of the investment objectives, financial situation or needs of any viewer that may receive it. Kindly also note that past performance is not a reliable indicator of future results. Actual results may differ materially from those anticipated in forward-looking or past performance statements. We assume no liability as to the accuracy or completeness of any of the information and/or content provided herein and the Company cannot be held responsible for any omission, mistake nor for any loss or damage including without limitation to any loss of profit which may arise from reliance on any information supplied by TFA Global Pte Ltd.
The speaker(s) is neither an employee, agent nor representative of Tradu and is therefore acting independently. The opinions given are their own, constitute general market commentary, and do not constitute the opinion or advice of Tradu or any form of personal or investment advice. Tradu neither endorses nor guarantees offerings of third-party speakers, nor is Tradu responsible for the content, veracity or opinions of third-party speakers, presenters or participants.

BRIEFING Week #15 : Arbitrages on the lookoutHere's your weekly update ! Brought to you each weekend with years of track-record history..
Don't forget to hit the like/follow button if you feel like this post deserves it ;)
That's the best way to support me and help pushing this content to other users.
Kindly,
Phil

WTI Oil H4 | Approaching a swing-high resistanceWTI oil (USOIL) is rising towards a swing-high resistance and could potentially reverse off this level to drop lower.
Sell entry is at 62.71 which is a swing-high resistance.
Stop loss is at 66.00 which is a level that sits above the 61.8% Fibonacci retracement and a pullback resistance.
Take profit is at 57.01 which is a swing-low support.
High Risk Investment Warning
Trading Forex/CFDs on margin carries a high level of risk and may not be suitable for all investors. Leverage can work against you.
Stratos Markets Limited (tradu.com):
CFDs are complex instruments and come with a high risk of losing money rapidly due to leverage. 63% of retail investor accounts lose money when trading CFDs with this provider. You should consider whether you understand how CFDs work and whether you can afford to take the high risk of losing your money.
Stratos Europe Ltd (tradu.com):
CFDs are complex instruments and come with a high risk of losing money rapidly due to leverage. 63% of retail investor accounts lose money when trading CFDs with this provider. You should consider whether you understand how CFDs work and whether you can afford to take the high risk of losing your money.
Stratos Global LLC (tradu.com):
Losses can exceed deposits.
Please be advised that the information presented on TradingView is provided to Tradu (‘Company’, ‘we’) by a third-party provider (‘TFA Global Pte Ltd’). Please be reminded that you are solely responsible for the trading decisions on your account. There is a very high degree of risk involved in trading. Any information and/or content is intended entirely for research, educational and informational purposes only and does not constitute investment or consultation advice or investment strategy. The information is not tailored to the investment needs of any specific person and therefore does not involve a consideration of any of the investment objectives, financial situation or needs of any viewer that may receive it. Kindly also note that past performance is not a reliable indicator of future results. Actual results may differ materially from those anticipated in forward-looking or past performance statements. We assume no liability as to the accuracy or completeness of any of the information and/or content provided herein and the Company cannot be held responsible for any omission, mistake nor for any loss or damage including without limitation to any loss of profit which may arise from reliance on any information supplied by TFA Global Pte Ltd.
The speaker(s) is neither an employee, agent nor representative of Tradu and is therefore acting independently. The opinions given are their own, constitute general market commentary, and do not constitute the opinion or advice of Tradu or any form of personal or investment advice. Tradu neither endorses nor guarantees offerings of third-party speakers, nor is Tradu responsible for the content, veracity or opinions of third-party speakers, presenters or participants.

WTI - Will Iran return to the group of oil producers?!WTI oil is below the EMA200 and EMA50 on the 4-hour timeframe and is moving in its medium-term descending channel. If the correction towards the supply zone continues, the next oil selling opportunity with a suitable reward for risk will be provided for us. In this direction, with confirmation, we can look for oil buying transactions.
The U.S. Energy Information Administration (EIA), in its latest report, has downgraded its forecasts for oil and natural gas production, consumption, and prices for 2025 and 2026, while warning about the uncertain outlook of the energy market amidst economic volatility and escalating trade tensions.
According to the updated estimates, U.S. crude oil production in 2025 is expected to reach 13.51 million barrels per day, down from the previous forecast of 13.61 million barrels. For 2026, the figure has been revised to 13.56 million barrels per day, a reduction from the earlier 13.76 million forecast. Monthly data shows average U.S. oil output stood at 13.44 million barrels per day in April and 13.55 million in March, with similar levels expected in May.
Globally, EIA projects oil production in 2025 to be around 104.1 million barrels per day, slightly down from the earlier estimate of 104.2 million. For 2026, the revised figure stands at 105.3 million barrels per day compared to the previous 105.8 million.
On the demand side, global oil consumption forecasts have also been reduced. In 2025, demand is now estimated at 103.6 million barrels per day instead of 104.1 million, and for 2026 it is projected at 104.7 million barrels per day, down from the prior estimate of 105.3 million.
Regarding natural gas, the EIA reports that average U.S. gas production in April will be around 115 billion cubic feet per day, slightly lower than the 115.3 billion cubic feet reported in March. May’s forecast stands at 115.4 billion cubic feet. Demand has also dipped, with estimates for 2025 now at 91.2 billion cubic feet per day (down from 92), and for 2026 at 90.5 billion (previously 91.1).
In terms of pricing, EIA has made significant downward revisions. The average price of West Texas Intermediate (WTI) crude oil is now forecast to be $63.88 per barrel in 2025, compared to the earlier $70.68. For 2026, this drops further to $57.48. Brent crude is now estimated at $67.87 for 2025 and $61.48 for 2026, both notably lower than prior projections.
One key highlight from the report is EIA’s warning about high volatility in major commodity prices, especially crude oil. The agency underlined that reciprocal tariffs between China and the U.S. could heavily impact markets, particularly the propane sector.
EIA noted that U.S. liquefied natural gas (LNG) exports are likely to remain resilient despite trade disputes. This is attributed to strong global demand and the flexible nature of U.S. export contracts, which allow unrestricted shipments to multiple destinations.
However, when it comes to oil and petroleum products, the agency maintained a more cautious tone, emphasizing that recent shifts in global trade policies and oil production patterns may slow the growth of demand for petroleum-based products through 2026.
Altogether, the downward revisions by the EIA carry a clear message: the energy market outlook over the coming years is fraught with uncertainty. From supply and demand to pricing, political and economic forces such as trade wars and potential global recessions are expected to play decisive roles.
Meanwhile, according to Reuters, after U.S. President Donald Trump once again threatened military action if Tehran refuses to agree to a nuclear deal, a senior Iranian official responded by warning that Iran may halt its cooperation with the U.N.’s nuclear watchdog.
Reports indicate that American and Iranian diplomats will meet in Oman on Saturday to begin talks on Tehran’s nuclear program. Trump stated that he would have the final say on whether the negotiations are failing, which could place Iran in a highly dangerous position.
Ali Shamkhani, a senior adviser to Iran’s Supreme Leader, posted on X (formerly Twitter) that ongoing foreign threats and the looming threat of military confrontation could lead to deterrent actions such as expelling International Atomic Energy Agency (IAEA) inspectors and cutting ties with the agency.He also mentioned that relocating enriched uranium to secure, undisclosed locations within Iran may be under consideration

WTI gets a boost, but is this really enough?We saw yesterday the positive reaction due to the pausing of tariffs. However, because of the economic uncertainties and OPEC+ production increases, the price of TVC:USOIL may see more downside.
Let's dig in.
MARKETSCOM:OIL
Let us know what you think in the comments below.
Thank you.
77.3% of retail investor accounts lose money when trading CFDs with this provider. You should consider whether you understand how CFDs work and whether you can afford to take the high risk of losing your money. Past performance is not necessarily indicative of future results. The value of investments may fall as well as rise and the investor may not get back the amount initially invested. This content is not intended for nor applicable to residents of the UK. Cryptocurrency CFDs and spread bets are restricted in the UK for all retail clients.

Another tariff u-turn: Oil overbought on news? President Trump announced a 90-day pause on reciprocal tariffs for countries that have not retaliated, sparking a sharp rally in U.S. markets. The Nasdaq 100 led gains with a 12.2% surge. The U.S. dollar also strengthened against safe-haven currencies such as the Japanese yen and Swiss franc.
Crude oil prices rebounded alongside equities, with oil futures rising more than 4% to trade above $62 per barrel.
However, the strength of the oil rally may be overstated. China, one of the world’s largest oil consumers, was among the first to retaliate against U.S. tariffs. Tensions between Washington and Beijing have worsened, prompting the U.S. to raise tariffs on Chinese goods to 125%.
Adding to the caution, analysts at Goldman Sachs revised down their 2026 average price forecasts for Brent and WTI, citing rising recession risks. The bank now expects Brent to average $58 per barrel and WTI to average $55.

CRUDE OIL (WTI): Important Support Clusters to Watch
On a today's live stream, we discussed potentially significant
historic supports on WTI Crude Oil to watch.
Support 1: 57.0 - 59.0 area
Support 2: 52.5 - 54.6 area
Support 3: 48.8 - 50.4 area
Support 4: 40.6 - 43.7 area
The price is currently testing a lower boundary of Support 1.
It perfectly matches with a completion point of a harmonic ABCD pattern.
It looks like we may see some pullback soon.
❤️Please, support my work with like, thank you!❤️

WTI Oil H4 | Heading into a pullback resistanceWTI oil (USOIL) is rising towards a pullback resistance and could potentially reverse off this level to drop lower.
Sell entry is at 59.51 which is a pullback resistance that aligns with the 38.2% Fibonacci retracement.
Stop loss is at 61.95 which is a level that sits above the 61.8% Fibonacci retracement and an overlap resistance.
Take profit is at 53.41 which is a support level that aligns with the 78.6% Fibonacci projection.
High Risk Investment Warning
Trading Forex/CFDs on margin carries a high level of risk and may not be suitable for all investors. Leverage can work against you.
Stratos Markets Limited (tradu.com):
CFDs are complex instruments and come with a high risk of losing money rapidly due to leverage. 63% of retail investor accounts lose money when trading CFDs with this provider. You should consider whether you understand how CFDs work and whether you can afford to take the high risk of losing your money.
Stratos Europe Ltd (tradu.com):
CFDs are complex instruments and come with a high risk of losing money rapidly due to leverage. 63% of retail investor accounts lose money when trading CFDs with this provider. You should consider whether you understand how CFDs work and whether you can afford to take the high risk of losing your money.
Stratos Global LLC (tradu.com):
Losses can exceed deposits.
Please be advised that the information presented on TradingView is provided to Tradu (‘Company’, ‘we’) by a third-party provider (‘TFA Global Pte Ltd’). Please be reminded that you are solely responsible for the trading decisions on your account. There is a very high degree of risk involved in trading. Any information and/or content is intended entirely for research, educational and informational purposes only and does not constitute investment or consultation advice or investment strategy. The information is not tailored to the investment needs of any specific person and therefore does not involve a consideration of any of the investment objectives, financial situation or needs of any viewer that may receive it. Kindly also note that past performance is not a reliable indicator of future results. Actual results may differ materially from those anticipated in forward-looking or past performance statements. We assume no liability as to the accuracy or completeness of any of the information and/or content provided herein and the Company cannot be held responsible for any omission, mistake nor for any loss or damage including without limitation to any loss of profit which may arise from reliance on any information supplied by TFA Global Pte Ltd.
The speaker(s) is neither an employee, agent nor representative of Tradu and is therefore acting independently. The opinions given are their own, constitute general market commentary, and do not constitute the opinion or advice of Tradu or any form of personal or investment advice. Tradu neither endorses nor guarantees offerings of third-party speakers, nor is Tradu responsible for the content, veracity or opinions of third-party speakers, presenters or participants.
