WTI OIL Near the top of the 4 month Channel Down.The WTI Oil (USOIL) rebounded on its 4H MA200 (orange trend-line) yesterday and is once again near the top (Lower Highs trend-line) of the long-term Channel Down pattern that started at the end of June.
On the short-term, it has been trading within a Channel Up (dashed lines) since the October 18 Low. Naturally, the Higher Lows on the 4H RSI draw comparisons with the August 30 - September 20 fractal, which formed a Channel Down and eventually bottomed around the 1W MA100 (yellow trend-line).
Our trading plan involves break-outs. A 1D closing above the top (Lower Highs trend-line) of the Channel Down, targets the 1D MA100 (red trend-line) on the short-term, also inside the August Resistance Zone. On the longer term, the upper Fibonacci retracement levels can be targeted once the previous breaks.
If the price breaks below the 4H MA200, a short-term Channel Down similar to that of mid September (blue) can be materialized and target the 1W MA100 again.
-------------------------------------------------------------------------------
** Please LIKE 👍, SUBSCRIBE ✅, SHARE 🙌 and COMMENT ✍ if you enjoy this idea! Also share your ideas and charts in the comments section below! This is best way to keep it relevant, support me, keep the content here free and allow the idea to reach as many people as possible. **
-------------------------------------------------------------------------------
You may also TELL ME 🙋♀️🙋♂️ in the comments section which symbol you want me to analyze next and on which time-frame. The one with the most posts will be published tomorrow! 👏🎁
-------------------------------------------------------------------------------
👇 👇 👇 👇 👇 👇
💸💸💸💸💸💸
👇 👇 👇 👇 👇 👇
Wtisignals

WTI SHORT TERM RECOVERYWTI recovered some of its loses yesterday after expectations of supply slow-down due to the hurricane in the Gulf of Mexico. But the continuous straightening of the US dollar and the expectations of continuing slow-down of Chinese economy might decrease the demand of crude oil. This will probably put further pressure on the crude oil price. Bearish traders might take advantage of this scenario by waiting a bit for WTI to reach more favorable levels and enter into positions.
Although technical indicators on the 1H graph show "Buy" signals, on the 4H and the daily graph the indicators are still bearish, with MACD histogram below 0 line and RSI below 50 neutral line. This might indicate that the recovery is temporary and the bearish move has not finished, but just slowed down.
If bearish trend continues the price might test levels of 72 USD, but if the trend makes a more permanent reverse, it might test its previous high at 86 USD.
Risk Disclosure: Trading Foreign Exchange (Forex) and Contracts of Difference (CFD's) carries a high level of risk. By registering and signing up, any client affirms their understanding of their own personal accountability for all transactions performed within their account and recognizes the risks associated with trading on such markets and on such sites. Furthermore, one understands that the company carries zero influence over transactions, markets, and trading signals, therefore, cannot be held liable nor guarantee any profits or losses.

USOIL is in possible sell zone!!USOIL 4h Has broken down after creating a head & shoulder on the lower timeframe. Upon new opening, the price has formed a new bearish structure and again has broken down after a liquidity grab as soon as the market opens. Currently, price retesting the previous support as resistance on the local structure and rejecting that can give us another opportunity to sell WTI after our first successful trade as soon as the market opens.
Press the like button if you enjoy this content :)

WTI DWINDLES BETWEEN HIGH RATES AND THIGHT SUPPLYWTI remains indecisive. On one hand traders are suspecting continuous increase of the interest rates, after Fed decision in Wednesday. On the other hand, the further escalation by Russia of the war in Ukraine and the thread by the Nigerian oil minister Timipre Marlin Sylva that OPEC+ will decrease production if prices keep falling, are creating fear of tightened supply.
All technical indicators are suggesting downtrend for WTI price, with MACD histogram being below the 0 line and RSI being below the neutral 50 line.
If price keeps falling, it might test its most recent low at 80.9, but if the trend reverses, it might test its resistance at 89.7 or even the one at 97.2
Risk Disclosure: Trading Foreign Exchange (Forex) and Contracts of Difference (CFD's) carries a high level of risk. By registering and signing up, any client affirms their understanding of their own personal accountability for all transactions performed within their account and recognizes the risks associated with trading on such markets and on such sites. Furthermore, one understands that the company carries zero influence over transactions, markets, and trading signals, therefore, cannot be held liable nor guarantee any profits or losses.

Will WTI Oil drop under 70?Since the double top marked by March and June's highs above 120, the price of Oil has started to fall and found support under 90 and under the neckline of the pattern.
Last week we have a false break above this neckline reversed with a strong bearish engulfing and Oil is trading again near 88 support (also an old resistance from Oct and Nov 2021)
The pressure seems to be on the downside and a clear break of support would confirm this outlook.
In such an instance we can have a continuation to the downside and a drop to 70 important horizontal support and also the measured target for the double top.

WTI Cude (OIL) WAITE TO BUY CONFARMANATION...
Hello Traders, here is the full analysis for this pair,
let me know in the comment section below if you have any questions,
the entry will be taken only if all rules of the strategies will be
satisfied. I suggest you keep this pair on your watch list and see if
the rules of your strategy are satisfied.
Dear Traders,
If you like this idea, do not forget to support with a like and follow.
PLZ! LIKE COMMAND AND SUBSCRIBE.

Remain Bullish?Remain bullish on oil with Friday's bullish candle bouncing from a short term bullish trendline. Entry buy stop 108.95 and target is previous swing high. R multiple is 2.6

WTI Crude Oil Hold above 21-EMAWTI on track for further downside. Bears eye cloud support at 109.23.
WTI remains on the back foot for the third consecutive session, OPEC meeting in focus

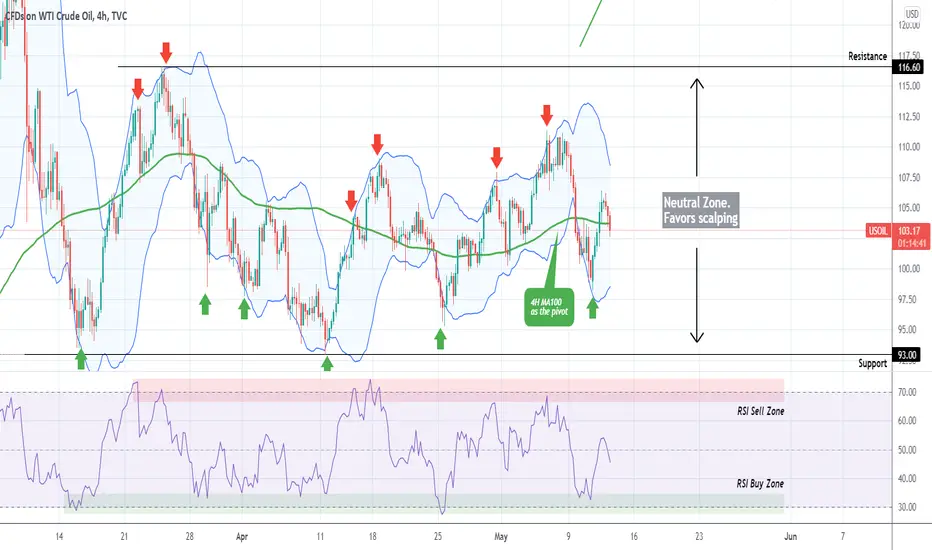
WTI OIL 1 month of scalping with 12 successful tradesAs mentioned on my last two ideas (April 19 and May 02), WTI Oil has been neutral on the medium-term where scalping was favored:
Today's analysis is on the 4H time-frame where you can see the range more clearly (Resistance at 116.60 and Support at 93.00). On this post I present the golden combination that offered 100% profitable results during this 1 month of scalping. The 4H MA100 (green trend-line) can be used as the Pivot Line. I've also plotted the Bollinger Bands (blue range).
As you see, every time the 4H RSI touched either its Resistance (sell signal) or Support Zone (buy signal), it bounced towards at least the 4H MA100 and in most cases even the top/ bottom of the Bollinger Bands before the next signal emerged.
So far this approach has given 100% success rate with 12/12 correct signals. We will continue scalping this until either the Resistance or Support level breaks.
--------------------------------------------------------------------------------------------------------
** Please support this idea with your likes and comments, it is the best way to keep it relevant and support me. **
--------------------------------------------------------------------------------------------------------
MEDIUM TERM WTI CRUDE OIL ANALYSISHEY ZEYAN HERE
Hello, zeyan. I was previously fairly bullish on oil, but as I can see now, oil prices will be settling back to below 100, with 82.50 being the next best probable position.
this is an idea a plan in a uncertain chaotic environment out of multiple plans to be certain
IF anything happens that changes the fundamentals of this idea, i will update.
please note that this is not financial advice. do your own research and use this information as conformational biase on top of your own analysis.
like for support!!!!

usoil short position h1hi
usoil can give a short position for 1:2.5 RR
but dont forget i publieshed another post for long position
check the post
carefull: this is countertrend position so just 0.5% risk involving is logical

CRUDE OIL Breakout Long !!CRUDE OIL was trading in a downtrend
But then broke the falling resistance
After is retested a support level at 95.30
I think that we will see a move up
To retest the target above at 115.18


WTI OIL The important 1D MA50 testWell I've been tracking and trading the pattern you see on this chart for over a month and the very last formations have played out particularly well:
Right now WTI is ahead of the first important test of this uptrend, the 1D MA50 (blue trend-line) which is currently posing as a Resistance. If that breaks, we have a strong case of a bullish continuation. However, this the current wave is repeating that of August - September quite closely, the (yellow) Lower Highs trend-line will be critical as well, and what I am particularly looking as confirmation is a rejection there, hold on the 1D MA50 and the red Ichimoku area and then a strong bullish break-out. The RSI is so far on course for its Symmetrical Resistance of those Lower Highs. If that breaks, our next target will be $85.00.
--------------------------------------------------------------------------------------------------------
** Please support this idea with your likes and comments, it is the best way to keep it relevant and support me. **
--------------------------------------------------------------------------------------------------------

WTIUSD Pattern on H1Here's my idea for WTTIUSD. It should be going bullish. When reaching Order Block, it's your area to look out for. You can take 10R. Safe Trade!


WTI OIL can go much lower based on this patternIt was exactly one month ago (October 19) when I reversed my bullish thesis on WTI Crude Oil, calling for a top and a reversal:
As you see, the top got priced exactly on the March Higher Highs trend-line and the rejection successfully took place. Even early into November, the Lower Highs peak formation was clear:
Back to today. In my firm's outlook, since the 1D MA50 (blue trend-line) broke, the only level that may support Oil is the 1D MA100 (green trend-line) and that only temporarily. Why? Because this is what happened last time on July 20, a short-term hold there followed by a dead-cat bounce above the 1D MA50 again only to serve as a new rejection towards the 1D MA200 (orange trend-line) where the price eventually made the bottom.
As you see, the major pattern since March is a Bullish Megaphone which besides the Higher Highs, has also a Higher Lows trend-line that Supports. A new contact with that trend-line would be on the 0.786 Fibonacci retracement level, which was where the bottom was formed last time on the Higher Lows trend-line in August 20. Corrections of -15% are common within this Megaphone pattern and another such correction would make a low right above the 1D MA200, which I believe will be the bottom and will prevail over a deeper contact on the Higher Lows trend-line.
--------------------------------------------------------------------------------------------------------
** Please support this idea with your likes and comments, it is the best way to keep it relevant and support me. **
--------------------------------------------------------------------------------------------------------

WTI starting to recover from inflation driven plungeHello everyone, as we all know the market action discounts everything :)
_________________________________Make sure to Like and Follow if you like the idea_________________________________
Oil prices surged above $83 per barrel in volatile trading on Thursday, recovering from significant drops caused by concerns about rising US inflation, as OPEC reduced its 2021 oil demand prediction owing to high energy prices.
In a monthly report, the Organization of Petroleum Exporting Countries (OPEC) stated that it expected oil consumption to average 99.49 million barrels per day (bpd) in the fourth quarter of 2021, a 330,000 bpd decrease from last month's prediction.
Possible Scenario for the market :
The market is currently trading at $81.26 and looks like it going to the support line located at $80.17 where a battle will happen between the Bears and the Bulls over control, the outcome will probably be in favor of the bulls which will cause the market to increase in value reaching the first resistance at $84.08.
in case the demand for oil increases even more then we will most likely see a further push that could reach the $88.00 level by the end of the week.
Technical Analysis show :
1) The market is below the 5 10 20 MA and EMA indicating a Bearish Short-term movement, but still above the 50 100 and 200 MA and EMA indicating a Bullish Long-term trend
2) The RSI is at 51.61 showing good strength in the market with a small Bullish divergence that could be a sign of a Bearish short-term trend.
3) The MACD is above the 0 line still indicating a Bullish market, but it has a Negative crossover between the MACD line and the Signal line indicating a small Bearish movement.
Support & Resistance points :
support Resistance
1) 80.17 1) 84.08
2) 78.63 2) 86.45
3) 76.26 3) 87.99
Fundamental point of view :
OPEC expects global consumption to hit 100 million bpd in the third quarter of 2022, three months later than predicted last month.
On Wednesday, data indicated that inflation in the United States surged by 6.2 percent, the quickest rate in 30 years, owing primarily to increasing energy prices, which pushed the dollar higher while sending Brent and WTI oil down by 2.5 % and 3.3 %, respectively.
A surge in US oil supplies following the government's release of some critical reserves pushed up prices even further.
In reaction to rising inflation, US President Joe Biden stated he directed the National Economic Council to concentrate on lowering energy costs and the Federal Trade Commission to crack down on market manipulation in the energy industry in order to reverse inflation.
This is my personal opinion done with technical analysis of the market price and research online from Fundamental Analysts and News for The Fundamental point of view, not financial advice.
If you have any questions please ask and have a great day !!
Thank you for reading.

WTI: Down, Down! 🥰Within the current setup, we are expecting WTI to fall a bit further. The goal of the current movement lays around $78.59. After hitting this area, the price should massively increase again.
Happy Trading!

WTI OIL is about to top soon. Reversal imminent.On my most recent WTI Oil idea I laid out the reason why I expected it to tun parabolic towards $82.50:
That target has now been reached and on the 1D time-frame, WTI is approaching a very strong Support cluster both on price and RSI terms.
As you see the price is close to the internal Higher Highs trend-line that connects the March 08 and July 06 Highs. Also it is approaching the 2.0 Fibonacci extension of the Fibonacci Channel that is trading on since March. This extension is key because as you see the previous Higher Highs have been rising on a +0.5 Fib interval (1.0 and 1.5). The next in line is arithmetically 2.0.
At the same time, the 1D RSI is testing the 76.30 Resistance. The July 06 High came on a RSI Triple Top. We already have a Double Top. Watch this sequence closely as a potential Triple Top may be the signal for the correction. The 1D MA50 and 1D MA200 are there to offer Support.
--------------------------------------------------------------------------------------------------------
** Please support this idea with your likes and comments, it is the best way to keep it relevant and support me. **
--------------------------------------------------------------------------------------------------------

USOIL told you exactly how the market is going to moveHello everyone, as we all know the market action discounts everything :)
_________________________________Make sure to Like and Follow if you like the idea_________________________________
On September 13 I posted an idea explaining how the USOIL was close to a breakout and that you should keep your eyes on the market for the next few days, and posted 2 Scenarios of how the market is most likely to move.
Looking at the market today we can see that the first Scenario has happened exactly as I predicted.
Over the past few weeks, oil prices have continued to proceed along an upward trajectory as commodity shortages remain a key concern for global economies. noticed that the market has brokeout the main resistance zone located between 70.40 - 70.63 and started to gain momentum that drove the price up hitting the 76.43 level yesterday, That is almost a 9% increase in 2 weeks alone
Possible Scenarios for the market :
Scenario 1 :
The market seems to be nearing the first support line located at 73.76, if the price was able to drop below and close then we could be seeing a small Bearish movement that could lead the market down to the second support at 72.89 or even below back to the main support zone at 70.40 - 70.63, where a bounce back in price will probably happen leading the price back up again to its current level.
Scenario 2 :
The Bulls are trying to gain control over the market today in hope of staying away from the support level and going back up near the first resistance level at 76.18 where a battle over control will happen and the winner will determine the outcome movement of the market, If the Bears were to win then we might see a drop to the first support at 73.76 where a bounce most likely will happen.
If the Bulls were to win then we will see an increase in price that could lead the market to the 77.73 or even the 80.74 level in the next period of time.
Technical indicators show :
1) The market is above the 10 20 50 100 and 200 MA and EMA (Strong Bullish sign)
2) The RSI is at 61.31 showing Great strength in the market, With no divergence found between the market and the indicator
3) The MACD is above the 0 line indicating that the market is in a Bullish state, With a positive crossover between the MACD line and the Signal line
Daily Support and Resistance :
support Resistance
1) 73.76 1) 76.18
2) 72.89 2) 77.73
3) 71.34 3) 78.60
Weekly Support and Resistance :
support Resistance
1) 71.06 1) 75.90
2) 67.93 2) 77.61
3) 66.22 3) 80.74
Fundamental point of view :
The price of Brent crude oil continues to soar, touching highs last seen three years ago as demand outstrips supply. The continued rollback of covid-19 restrictions in economies around the globe is driving demand ever higher with supply struggling to keep up. OPEC+ will meet next – October 4 – and they may need to increase production further to help alleviate the market shortage. Brent crude touched $80/bbl. earlier and may now set its sights on the October 2018 high at $86.65/bbl. if the OPEC+ leaves production at its levels. The Organization of the Petroleum Exporting Countries will also release its World Oil Outlook next week and this now takes on increased significance as prices rally hard. According to Dailyfx
This is my personal opinion done with technical analysis of the market price and research online from Fundamental Analysts and News for The Fundamental point of view, not financial advice.
If you have any questions please ask and have a great day !!
Thank you for reading.

WTI Oil can correct to 70 zoneYesterday, after a short-lived spike above 76, WTI reversed strongly confirming this zone as strong resistance
A deeper correction can follow from this point and we can look to sell rallies under 76
A daily close above resistance would negate this scenario

WTI OIL Inverse Head and ShouldersLast time I made a post on WTI Oil the price was still struggling to get past both a very strong Lower Highs trend-line and the 1D MA50 (blue trend-line on the left chart):
Well the price managed to break and close above both and rallied. The rejection though near the 74.15 Resistance has formed an Inverse Head and Shoulders (IH&S). Look how the Pivot Zone mentioned on the previous analysis is almost perfectly matched as the Shoulder line. Naturally, we should be expecting an initial pull-back and since the IH&S is a bullish reversal pattern, break above the 74.15 afterwards.
However we need to consider an earlier potential Support and that's the 1D MA50 which, as mentioned, was previously the Resistance since August 03. That fits well the pattern on the right side (which is on the 4H time-frame) which is a Channel Up whose Higher Lows trend-line limit is currently roughly where the 1D MA50 is.
Short-term target if the Pivot Zone holds is the 74.15 Resistance (1). Long-term target is the 77.00 Resistance (2). A candle close below the Pivot Zone temporarily sets this back to the 1D MA200 (orange trend-line on the left chart).
** Please support this idea with your likes and comments, it is the best way to keep it relevant and support me. **
--------------------------------------------------------------------------------------------------------
!! Donations via TradingView coins also help me a great deal at posting more free trading content and signals here !!
🎉 👍 Shout-out to TradingShot's 💰 top TradingView Coin donor 💰 this week ==> Vergnes
--------------------------------------------------------------------------------------------------------
