Gold Ideas - XAUUSD Weekly Outlook | April 28, 2025🧠 Quick Outlook:
Gold remains locked in a corrective range after its aggressive rally to new all-time highs.
Price is currently consolidating between major liquidity zones, preparing for its next big move.
However, growing geopolitical risks — including rising Middle East tensions and potential currency interventions out of Japan — could trigger safe-haven flows, especially during Asia session volatility.
While the high timeframe structure remains bullish above the 3220–3235 pivot,
the immediate tactical focus is on the 3340–3365 zone, where key liquidity battles are unfolding.
🔥 Major Zones to Watch:
Resistance 3380–3395 Major supply and flip zone — strong liquidity cluster
Resistance 3350–3360 Minor local resistance — potential bull trap area
Support 3260–3280 Critical intraday support and liquidity pocket
Support 3220–3235 Last pivot standing to maintain bullish structure
⭐Tactical Focus This Week:
🎯 Will Gold reject or conquer the 3380–3395 stronghold?
🎯 Will 3350–3360 act as a stepping stone or a snare for early buyers?
🎯 Are buyers prepared to defend the 3260–3280 liquidity pocket with real force?
🎯 What happens if 3220 collapses?
Patience and sniper discipline will make the difference this week, as Gold approaches critical decision points and major news.
📌 Important Notice!!!
The above analysis is for educational purposes only and does not constitute financial advice. Always compare with your plan and wait for confirmation before taking action.
🖊️ If these insights help you refine your trading plans, give us a boost and follow GoldMindsFX on TradingView. Let's grow together! 🛡️
Xauusdanalysis

#xauusdLow risk gold signal placed until reward 5. Of course you can stay in the trade until reward 3.

XAU/USD 29 April 2025 Intraday AnalysisH4 Analysis:
-> Swing: Bullish.
-> Internal: Bullish.
Analysis and bias remains the same as analysis dated 23 April 2025
Price has now printed a bearish CHoCH according to my analysis yesterday.
Price is now trading within an established internal range.
Intraday Expectation:
Price to trade down to either discount of internal 50% EQ, or H4 demand zone before targeting weak internal high priced at 3,500.200.
Note:
With the Federal Reserve's dovish stance and persisting geopolitical uncertainties, heightened volatility in Gold is expected to continue. Traders should proceed with caution and adjust risk management strategies in this high-volatility environment.
Price could also be driven by President Trump's policies, geopolitical moves and economic decisions which are sparking uncertainty.
H4 Chart:
M15 Analysis:
-> Swing: Bullish.
-> Internal: Bearish.
Analysis and Bias remains the same as analysis dated 24 April 2025.
Price printed as per my note yesterday whereby I mentioned that we should be surprised if price printed a bearish iBOS as all HTF's require a pullback.
Price subsequently printed a bearish iBOS which confirms internal structure.
Intraday Expectation:
Price has traded up to just short of premium of internal 50% EQ where we are seeing a reaction. Price could potentially trade further into premium of 50%, or H4/M15 nested supply zone before targeting weak internal low priced at 3,260.190.
Note:
With the Federal Reserve maintaining a dovish stance and ongoing geopolitical tensions, volatility in Gold prices is expected to remain elevated. Traders should exercise caution, adjust risk management strategies, and stay prepared for potential price whipsaws in this high-volatility environment.
Trump's tariff announcement will most likely cause considerably increased volatility and whipsaws.
M15 Chart:

Gold is stuck in the 3300 area, when can it break through?
📊Comment Analysis
Gold prices need economic news to break through the sideways price range around 3300. Today, we will continue to wait and see around 3300, waiting for the right time to enter the market.
💰Strategy Package
Long positions:
💲Actively participate in gold around 3300-3310 points, with a profit target around 3330 points
Short positions:
💲Actively participate in gold around 3330-3340 points, with a profit target around 3310 points
💢Precise sniping, follow the trading strategy = lying down and making money

Gold plunged $36 during Asian trading hours. What's the reason?Spot gold suddenly fell sharply during the Asian session, and the current price of gold is around $3,310/ounce, a plunge of $36 during the day.
In the optimistic market sentiment, the recovery of US dollar demand seems to put downward pressure on gold prices.
Quaid believes that optimism about the possible progress in trade negotiations between the United States and its major trading partners supports risk appetite, boosts the performance of the US dollar against major currency competitors, and gold sellers are trying to regain control.
The Wall Street Journal said that weakening the impact of auto tariffs is the latest concession of Trump's trade policy after market turmoil and fierce lobbying by companies and other countries.
Looking ahead to this trading day, trade headlines and the re-adjustment of positions at the end of the month will play a key role in driving gold prices.
Trading analysis:
From a technical point of view, gold prices are currently trying to break down again after failing to confirm a break below the three-week rising channel on Monday. However, as the 14-day relative strength index is still above the midline, any decline in gold prices may be quickly bought.
During Asian trading hours, gold must close at the rising trend line support of $3,300/oz to confirm a break below the rising channel. Long-term important support for gold prices is in the $3,260/oz area.
If gold prices continue to fall below the above level, a new downward trend towards the $2,975 area will begin.
If buyers defend the above channel support of $3,300/oz, a rebound to the static resistance of $3,370/oz will be inevitable. If gold prices continue to recover, the target will be $3,400/oz, followed by the historical high of $3,500/oz.
The market is currently in a state of sideways fluctuations. I hope Quaid's analysis can help all traders understand the trend of gold in depth.

XAUUSD Gold analysis from a medium- to long-term perspectiveHello everyone. Today, we are here to determine the long-term direction of the XAUUSD pair. Regardless of any revisions, even if there are rollbacks in Trump-era policies or unexpected developments that are currently not even on the agenda, the ultimate objective remains unchanged: to strategically counterbalance China. The core target is clearly China, and the strategy is to shift both production and the trade balance in favor of the United States.
The factors driving gold prices upward are still strongly tied to global uncertainties, supported by ongoing diplomatic and geopolitical tensions. In a period where the U.S. dollar's role as the world’s reserve currency is being questioned, gold diversification has accelerated—particularly through central bank purchases.
From a psychological perspective, especially when viewed through the eyes of retail investors, I always emphasize this: when gold reaches historical highs, the underlying momentum seen in technical analysis continues to support a bullish direction. Therefore, I believe the upward trend is likely to persist.

XAUUSD:Reference for today's trading strategyYesterday, gold opened at $3,331 and trended downward unidirectionally until it rebounded strongly after hitting the key support around $3,260. The upward momentum continued at night, surging to $3,353 and then pulling back slightly, closing at $3,343. This morning, it opened flat at $3,343, quickly came under pressure, and entered a deep correction. Now it's fluctuating narrowly around $3,310 with bulls and bears in a stalemate.
From a comprehensive analysis of technicals and market sentiment, though bulls are active and have the momentum to challenge the $3,370 resistance, due to the upcoming NFP data, market wait-and-see sentiment is strong and volatility has increased notably. Historical data shows gold prices often fluctuate sharply before major economic data releases to digest risks in advance.
Considering the current K-line pattern and volume changes, it's likely that gold will experience a deep correction and retest the $3,260 support before breaking through the $3,370 resistance. This "accumulating strength through correction" can relieve profit-taking pressure and build up momentum for a future breakout.
Given the increased market uncertainties, today's trading strategy suggests being cautiously bullish and strictly controlling risks. Investors should set stop-losses rigorously to guard against sudden sharp fluctuations before the NFP release. Also, avoid aggressive bottom-fishing, closely monitor the market, and wait for price stabilization or clear technical signals before entering the market.
XAUUSD
buy@3280-3260
tp:3330-3350
In the future, we will continue to monitor the market changes and update the trading strategies in real time.
I am committed to sharing trading signals every day. Among them, real-time signals will be flexibly pushed according to market dynamics. All the signals sent out last week accurately matched the market trends, helping numerous traders achieve substantial profits. Regardless of your previous investment performance, I believe that with the support of my professional strategies and timely signals, I will surely be able to assist you in breaking through investment bottlenecks and achieving new breakthroughs in the trading field.

Gold's counterattack? Today's market analysisGold has repeatedly tested the 3260-3270 area to gain support. Gold has formed multiple bottom structures in the short term, so the short-term adjustment of gold may end.
Gold has formed multiple bottom structures in the 1-hour, and the 1-hour moving average has also begun to gradually turn. If it can turn upward and form a golden cross, then the 1-hour bulls of gold will exert their strength again. Stimulated by risk aversion, gold in the U.S. market once again broke through and rose, and finally broke through Monday's high. Then the first-line suppression of gold near 3335 did not form effective resistance. When gold fell back in the Asian market, we first followed the trend and went long. Gold quickly bottomed out at 3320 first-line support in early trading and then rebounded quickly. Then gold should only be operated in the short term or go long on dips.
Operation ideas:
Short-term long: 3310-3315 long, stop loss 3300, target 3350-3370;
Short-term short: 3350-3360 short, stop loss 3365, target, 3315-3310;
Friends, don’t be afraid of missing the market, wait patiently for your own opportunity, the market will never neglect those who are prepared.

XAUUSD Analysis: Gold Awaits a Breakout From Downtrend (H4)Currently, gold ( OANDA:XAUUSD XAUUSD) is trading around 2331. On the H4 timeframe, gold remains in a high-efficiency downtrend. However, the market is awaiting a catalyst to trigger a breakout and escape the current stagnation.
A critical support area to watch is around 3310 - 3312, where we see a clear battle between buyers and sellers, as reflected on the H4 candles. This zone could determine the next move for gold.
XAUUSD Intraday Trading Strategy
SELL XAUUSD Entry: 3368 - 3370
Stoploss: 3378
Take Profit 1: 3360
Take Profit 2: 3355
Take Profit 3: 3350
BUY XAUUSD Entry: 3310 - 3312
Stoploss: 3306
Take Profit 1: 3316
Take Profit 2: 3320
Take Profit 3: 3330
Important Notes
-Always set a Stoploss to protect your capital in all trading situations.
-Prioritize trading upon confirmed signals within the analyzed price zones.

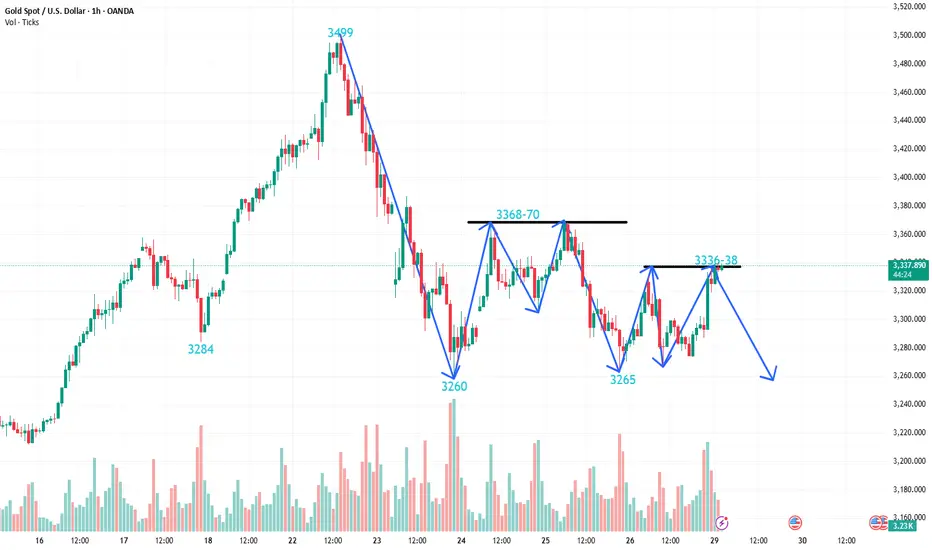
XAUUSD: Massive Volatility, Weak Support at 3270!Last week was extremely volatile for Gold, with incredible swings that caught many traders off-guard. After reaching a new all-time high at 3500, the price dropped by more than 2000 pips in less than 24 hours!
After this crash, the market settled somewhat, and towards the end of the week, Gold established a strong ceiling around 3370 – exactly as we discussed in last week's analysis.
The key question now: Is the correction over or is there more downside coming?
At the same time, we can clearly observe a floor around 3270, a level that Gold is testing again at the time of writing.
Here’s why I believe the correction is not over yet:
- Price action remains vulnerable below 3370 resistance.
- The support at 3270 looks fragile, with pressure building for a break.
- Market volatility is still extremely high, favoring continuation moves.
Trading Plan:
I am looking to sell rallies above 3300, aiming for a target around 3200.
Due to the recent wild volatility, I will adjust my stop losses accordingly, allowing enough room for noise without exposing the position to unnecessary risk.
Disclosure: I am part of Trade Nation's Influencer program and receive a monthly fee for using their TradingView charts in my analyses and educational articles.

XAU/USD Elliott Wave Count: Preparing for Final ImpulseXAU/USD appears to be in a textbook 5-wave impulsive structure on the 4H chart, with the market now completing Wave 4 as a classic ABC corrective flat/pennant.
The impulsive move from the Wave 2 low has formed clear internal substructures, with Wave 3 exhibiting extended price action, consistent with Elliott Wave guidelines.
Currently, price is consolidating in a contracting pattern labeled Wave 4 (A-B-C), which looks to be near completion. Based on wave symmetry and Fibonacci projections, a strong upside move is anticipated once Wave 4 concludes, leading into the final Wave 5 rally.
Entry Zone: 3286.875
Target: 3367.440– 3410.210
Stop Loss: Below 3260.190.

Gold fluctuates and the trend is bearish!The rise and fall of gold is not based on technical aspects, but more on fundamentals and big data, as well as the impact of tariffs. Without these influences, we are bearish this week. If the decline of the big C wave continues, the target will be 3230. 3165 is the Fibonacci 61.8 position of the callback and also the previous high point, which is easy to form a rebound. Gold focuses on two major suppressions, one is the hourly suppression around 3300, and the other is 3315 and 3328, both of which are opportunities for air forces. In terms of the short-term operation of gold, it is recommended to short on rebounds and long on callbacks. The short-term focus on the upper side is 3298-3300 resistance, and the short-term focus on the lower side is 3265-3260 support.

Gold technical and fundamental aspects resonate!At present, gold maintains an upward trend of shocks. The short-term support below is the middle track of 3270-3290 and the 30-day moving average. If it pulls back to this range, you can arrange long orders accordingly. The key resistance above is the double top pressure of 3370 and the psychological barrier of 3400. The technical side shows that the right shoulder top pattern is formed near 3370. If it breaks through effectively, it may accelerate the upward exploration. Otherwise, it will face the risk of correction if it encounters resistance. In the near future, we need to be vigilant against the repeated short-term shock pattern of market sentiment. The operation is mainly high-altitude, supplemented by low-long, and avoid chasing up and selling down.

Gold 3260-3370 life and death tug of war!Spot gold prices remained weak during the European trading session, with prices approaching the key support area of $3,265-3,260. Signs of easing global trade relations and a small rebound in the US dollar have put pressure on gold prices. In addition, the decline in gold consumption in some economies in the first quarter of 2025 has also become another factor suppressing precious metals. Current market sentiment is in a cautious wait-and-see state. On the one hand, signs of easing global trade relations have triggered the withdrawal of some safe-haven funds; on the other hand, the persistence of geopolitical risks and expectations of interest rate cuts by the Federal Reserve are still supporting the bullish position of gold. The market is highly sensitive to the upcoming US economic data, especially GDP and non-farm payrolls, which may become a key trigger for gold price movements in the short term.

GOLD bulls ready to break higherHere we are looking at the 240/4hr chart. I am seeing price make a push higher from a previously well respected support zone and a possible triangle pattern forming after pushing down from previous highs.
Currently we're waiting for bears to push the price down either to the bottom of the triangle pattern, or breaking out to the highs for entries higher.
Plan for bears is to sell back into the triangle and in current resistance.
Plan here for bulls is to look for entries at a better price breaking this pattern, or into the highs.

Be bold and short goldFundamentals:
1. Still need to pay attention to Trump's attitude towards tariffs;
2. Pay attention to whether the situation between India and Pakistan escalates;
3. At the same time, pay attention to the dynamics of the Federal Reserve, US-Iran negotiations, etc.
Trading situation:
Our last short position near 3297 happened to hit TP: 3287 during the decline of gold, and easily made a profit of 100pips in short-term trading;
After gold fell below 3287, it rose sharply in the short term to around 3335. Although gold rose sharply in the short term, it still did not break away from the wide range of fluctuations. There are still many resistances above. First, it faces the short-term resistance area of 3340-3345, and secondly, it faces the resistance area of 3355-3365. Therefore, it is difficult for bulls to perform well before conquering this resistance area. There is still a possibility of testing the 3305-3295 zone again;
Trading strategy:
Short-term trading can still short gold in batches again in the 3325-3335 zone; TP: 3310-3300

Gold prices bottomed out and rebounded, market trend analysis.Analysis of gold trend: From the perspective of market sentiment, interest-free gold as a safe-haven asset has performed strongly this year, with prices soaring by nearly $700 and hitting record highs several times. However, the recent optimistic expectations of easing global economic and trade relations have boosted market risk appetite, and the equity market has generally performed positively. Some funds have flowed out of safe-haven assets such as gold and turned to risky assets, which is also the main psychological factor under pressure on gold prices. If market risk appetite continues to improve, global economic and trade relations further ease, and the US dollar strengthens, gold prices may face greater downward pressure. From a technical point of view, the gold price needs to effectively fall below the $3,265-3,260 range in the short term before a larger correction downward may be confirmed. Once confirmed to fall below, the gold price may quickly fall to the 50% retracement level near $3,225, further pointing to the $3,200 mark. If $3,200 is lost, it will suggest that gold may have peaked in the short term.
Gold opened higher in the Asian session on Monday and continued to fall last week after hitting 3336. The idea of the Asian session was to directly bearish at the analysis point of 3277. After hitting the lowest point of 3268, it fluctuated upward. The European session also fell to 3273 and then rebounded. The highest point in the US session just reached 3336 again, a standard bottoming and rebounding trend. Since it is an adjustment structure, let's re-analyze the idea. The gold price fell at 3500 and rebounded at 3260 last Wednesday. The rhythm was volatile. It rebounded above 3260 many times below and did not cross the first rebound high of 3367 above.
Today, we mainly focus on the closing price. If it stands firmly at the 3313 line, we will adjust our thinking on Tuesday. On the contrary, it will fall back after encountering resistance at 3336, today's opening high, and go to 3278. On Tuesday, we will continue to look at the idea of swinging and falling. Now it is the end of the market, and the market is also falling from a high.

Gold is trying to break through the upward channelGold started the new week on a bad note, hitting a low of 3260 in the morning, followed by a small shock adjustment; then it began to rise sharply. As of press time, it has risen to around 3350 and tried to break through the upward resistance.
Although some of gold's safe-haven appeal has weakened, its overall forecast and price trend remain optimistic. Until we see clear lower highs, lower lows, and a solid trade agreement rather than more political bragging from the Trump administration, the possibility of gold setting new highs cannot be underestimated.
Surface calm hides potential risks
Although last week's market movements and today's early trading performance show that the market is calming down, any sense of security is fragile. Under the surface, key risks remain: trade tensions, recession concerns, and uncertainty about monetary policy are real. Ongoing trade negotiations remain a key factor. If the United States sticks to its position on tariffs or the negotiations break down, risk aversion may quickly pick up, boosting demand for gold again.
Quaid's analysis:
Based on last week's market situation, Quaid conducted an analysis of gold's trend this week over the weekend. As I predicted, gold is trying to break through and try a new high.
Gold has risen to around 3350, and 3365 is a key resistance level in the upward trend. If the gold price breaks through this position and can maintain horizontal development, it will continue to rise in a stable situation.
From the upside, the initial resistance level is $3365, followed by $3430. If the bullish momentum is restored, it may soon hit the historical high of $3500 again.
On the contrary, if the price fails to break through the 3365 resistance level, Quaid believes that it is necessary to pay attention to the key support at the 3285 position.

Gold trend picks directionGold fell by 230 USD in a row on the daily line. Currently, 3500 is under short-term pressure. Today, we will focus on the continuity of the decline. It directly rushed from 3288 to 3310 in 5 minutes after opening. Yesterday, it hit the lowest point of 3258 above the 0.5 division of 2956-3500. This position is temporarily supported and rebounded, but whether the adjustment is over is still uncertain. It depends on the intraday closing pattern. If today's closing can stand above the MA5 daily moving average resistance of 3358 again, then there will be signs of the end of the downward adjustment, and the next day must be accompanied by a positive line. Pull up; on the contrary, if it closes below the 5-day MA, then there is a high probability that the 10-day moving average position will continue to decline, and then the 50-division position 3228 is further down, which happens to be the starting point of the big positive on April 16. This is likely to be the end point of this round of adjustment, or there will not be much room to go down, because from the standard wave pattern, it cannot fall below the first wave high, which is 3167, which is also the current middle track; therefore, either 3228 will stabilize on dips, or somewhere in the 3228-3167 area will stabilize, and then finally return to the bullish trend and pull up
The short-term 4-hour middle track 3380 has been lost and has become a key counter-pressure point. As long as it does not stand above it again, it will maintain a downward correction. After breaking 3292 below, the 66-day moving average of 3260 will be the loser or loser; the 1-hour K-line is under pressure from ma10 and ma5 and continues to fall. After yesterday's consolidation and pull-up, the K-line has now re-run above ma10, and the macd has formed a golden cross below the zero axis. This wave of 200 US dollars of rapid decline has almost corrected most of it. If it continues downward for another wave, or with the help of bottom divergence, it will slowly brew a short-term bottom; today's gold rebound focuses on the resistance below 3367, below the extreme middle track of 3380, and it is still bearish if it cannot withstand the pressure. If the strong support of 3260 or 3245-28 is stable, we will start to consider bottom-fishing.

Gold 100% Profit SignalFrom the current 4-hour analysis, the short-term pressure on gold is 3343-50, and the important pressure on 3360-66. The operation is still mainly short-selling if the rebound does not break. Below, we first pay attention to the short-term support of 3310-15, and the important support of 3260-68.
Gold rebounds to 3343-50 line short, rebound to 3360-66 line to cover short, stop loss 3372, target 3310-3315 line, continue to hold if it breaks

3360 neckline is being tested!
📊Comment Analysis
Short-term short positions need to rebound further and confirm the signal before following. After the US market breaks through the 3360 defense point, it is temporarily not possible to continue to be bearish. The US market will first look at the rebound, and then make further arrangements after approaching the 3360 line.
💰Strategy Package
Long positions:
The US market temporarily enters the market to go long when gold falls back to around 3297-3310 US dollars. Target 3340, stop loss 3345.

GOLD OUTLOOKThis chart is a technical analysis setup for Gold Spot (XAU/USD) on the 1-hour timeframe, showing a potential sell (short) trade idea. Here's a breakdown of the chart elements:
🔍 Key Zones Identified
Entry Zone:
Around 3380$-3394$
This is the suggested area where the trader plans to enter a short position (sell), expecting price to reverse downward from here.
Stop-Loss Area:
Ends near 3,415.80 USD
This zone is above the entry area and marks the risk level — if the price reaches here, the setup becomes invalid and the trade would be exited at a loss.
Target / Reversal Zone:
This is the take-profit area where the trader expects the price to potentially reverse or where they will close the short trade with profit.
📉 Trade Idea Visualization
Price is expected to move up slightly into the entry zone.
Then reverse downwards, hitting the target near the reversal zone.
✅ Summary of the Setup
Bias: Bearish
Strategy: Wait for price to hit entry zone (~3,380.00), then sell
Stop-Loss: Above 3,415.80
Take-Profit: Near 3,246.35
Risk-Reward Ratio: Favorable (large potential reward vs. smaller risk)....

Gold market analysis referenceThe recent gold fluctuations are really violent and fast. If you hesitate for a moment, you will basically miss the market. If you are too impatient, you will easily hit the stop loss. Now the fluctuations in a few hours are equivalent to the fluctuations in the past month. The stop loss of 3-5 US dollars can be easily swept. The market is changing, and the corresponding stop loss should also be enlarged.
Gold opened higher and hit 3336 in the morning on Monday, continuing the decline of last week. The idea in the morning was to be bearish directly at the analysis point of 3332. After hitting the lowest point of 3268, it fluctuated upward. The European session also fell to 3273 and then rebounded. The highest point in the US session just reached 3336 again, a standard bottoming and rebounding trend. Since it is an adjustment structure, let's re-analyze the idea. The gold price fell at 3500 and rebounded at 3260 last Wednesday. The rhythm was volatile. It rebounded above 3260 many times below, and did not cross the first rebound high of 3367 above. From a technical point of view, the gold price needs to effectively fall below the 3265-3260 US dollar range in the short term before it can confirm a larger correction downward. Once it is confirmed to fall below, the gold price may quickly fall to the 50% retracement level near 3225 US dollars, further pointing to the 3200 US dollar mark. If it loses 3200 US dollars, it will suggest that gold may have peaked in the short term.
For the current gold, the 4-hour chart is stuck in a wide range of oscillations between 3260-3338, and is currently at the edge of the lower track. Gold has formed a multi-round back-test support area at the 3270 price level. Although the price has touched this level several times, it has not effectively broken down. The bulls have launched a phased counter-attack. In terms of technical form, the double pressure characteristics have appeared near the previous rebound high of 3370. This area has the dual attributes of the second wave rebound target and the right shoulder pressure level of the head and shoulders top pattern. Today, we mainly focus on the closing price. If it stands firmly at the 3336 line, then we will adjust our thinking tomorrow. On the contrary, it encounters resistance at the high point of today's morning session at 3336 and then falls back, and goes to the 3278 line. Tomorrow we will continue to look at the idea of swinging and falling. On the whole, today's short-term operation strategy for gold is recommended to be mainly short-selling on rebounds, supplemented by long-selling on pullbacks. The short-term focus on the upper side is the 3338-3340 line of resistance, and the short-term focus on the lower side is the 3265-3260 line of support.
Strategy 1: When gold rebounds to around 3338-3340, short sell (buy short) in batches, 20% of the position, stop loss 6 points, target around 3300-3280, break to 3270
Strategy 2: When gold falls back to around 3265-3270, buy (buy up) 20% of the position in batches, stop loss 6 points, target around 3300-3320, break the position and look at 3330