Be bold and short goldFundamentals:
1. Still need to pay attention to Trump's attitude towards tariffs;
2. Pay attention to whether the situation between India and Pakistan escalates;
3. At the same time, pay attention to the dynamics of the Federal Reserve, US-Iran negotiations, etc.
Trading situation:
Our last short position near 3297 happened to hit TP: 3287 during the decline of gold, and easily made a profit of 100pips in short-term trading;
After gold fell below 3287, it rose sharply in the short term to around 3335. Although gold rose sharply in the short term, it still did not break away from the wide range of fluctuations. There are still many resistances above. First, it faces the short-term resistance area of 3340-3345, and secondly, it faces the resistance area of 3355-3365. Therefore, it is difficult for bulls to perform well before conquering this resistance area. There is still a possibility of testing the 3305-3295 zone again;
Trading strategy:
Short-term trading can still short gold in batches again in the 3325-3335 zone; TP: 3310-3300
Xauusdanalysis

Gold prices bottomed out and rebounded, market trend analysis.Analysis of gold trend: From the perspective of market sentiment, interest-free gold as a safe-haven asset has performed strongly this year, with prices soaring by nearly $700 and hitting record highs several times. However, the recent optimistic expectations of easing global economic and trade relations have boosted market risk appetite, and the equity market has generally performed positively. Some funds have flowed out of safe-haven assets such as gold and turned to risky assets, which is also the main psychological factor under pressure on gold prices. If market risk appetite continues to improve, global economic and trade relations further ease, and the US dollar strengthens, gold prices may face greater downward pressure. From a technical point of view, the gold price needs to effectively fall below the $3,265-3,260 range in the short term before a larger correction downward may be confirmed. Once confirmed to fall below, the gold price may quickly fall to the 50% retracement level near $3,225, further pointing to the $3,200 mark. If $3,200 is lost, it will suggest that gold may have peaked in the short term.
Gold opened higher in the Asian session on Monday and continued to fall last week after hitting 3336. The idea of the Asian session was to directly bearish at the analysis point of 3277. After hitting the lowest point of 3268, it fluctuated upward. The European session also fell to 3273 and then rebounded. The highest point in the US session just reached 3336 again, a standard bottoming and rebounding trend. Since it is an adjustment structure, let's re-analyze the idea. The gold price fell at 3500 and rebounded at 3260 last Wednesday. The rhythm was volatile. It rebounded above 3260 many times below and did not cross the first rebound high of 3367 above.
Today, we mainly focus on the closing price. If it stands firmly at the 3313 line, we will adjust our thinking on Tuesday. On the contrary, it will fall back after encountering resistance at 3336, today's opening high, and go to 3278. On Tuesday, we will continue to look at the idea of swinging and falling. Now it is the end of the market, and the market is also falling from a high.

Gold is trying to break through the upward channelGold started the new week on a bad note, hitting a low of 3260 in the morning, followed by a small shock adjustment; then it began to rise sharply. As of press time, it has risen to around 3350 and tried to break through the upward resistance.
Although some of gold's safe-haven appeal has weakened, its overall forecast and price trend remain optimistic. Until we see clear lower highs, lower lows, and a solid trade agreement rather than more political bragging from the Trump administration, the possibility of gold setting new highs cannot be underestimated.
Surface calm hides potential risks
Although last week's market movements and today's early trading performance show that the market is calming down, any sense of security is fragile. Under the surface, key risks remain: trade tensions, recession concerns, and uncertainty about monetary policy are real. Ongoing trade negotiations remain a key factor. If the United States sticks to its position on tariffs or the negotiations break down, risk aversion may quickly pick up, boosting demand for gold again.
Quaid's analysis:
Based on last week's market situation, Quaid conducted an analysis of gold's trend this week over the weekend. As I predicted, gold is trying to break through and try a new high.
Gold has risen to around 3350, and 3365 is a key resistance level in the upward trend. If the gold price breaks through this position and can maintain horizontal development, it will continue to rise in a stable situation.
From the upside, the initial resistance level is $3365, followed by $3430. If the bullish momentum is restored, it may soon hit the historical high of $3500 again.
On the contrary, if the price fails to break through the 3365 resistance level, Quaid believes that it is necessary to pay attention to the key support at the 3285 position.

Gold trend picks directionGold fell by 230 USD in a row on the daily line. Currently, 3500 is under short-term pressure. Today, we will focus on the continuity of the decline. It directly rushed from 3288 to 3310 in 5 minutes after opening. Yesterday, it hit the lowest point of 3258 above the 0.5 division of 2956-3500. This position is temporarily supported and rebounded, but whether the adjustment is over is still uncertain. It depends on the intraday closing pattern. If today's closing can stand above the MA5 daily moving average resistance of 3358 again, then there will be signs of the end of the downward adjustment, and the next day must be accompanied by a positive line. Pull up; on the contrary, if it closes below the 5-day MA, then there is a high probability that the 10-day moving average position will continue to decline, and then the 50-division position 3228 is further down, which happens to be the starting point of the big positive on April 16. This is likely to be the end point of this round of adjustment, or there will not be much room to go down, because from the standard wave pattern, it cannot fall below the first wave high, which is 3167, which is also the current middle track; therefore, either 3228 will stabilize on dips, or somewhere in the 3228-3167 area will stabilize, and then finally return to the bullish trend and pull up
The short-term 4-hour middle track 3380 has been lost and has become a key counter-pressure point. As long as it does not stand above it again, it will maintain a downward correction. After breaking 3292 below, the 66-day moving average of 3260 will be the loser or loser; the 1-hour K-line is under pressure from ma10 and ma5 and continues to fall. After yesterday's consolidation and pull-up, the K-line has now re-run above ma10, and the macd has formed a golden cross below the zero axis. This wave of 200 US dollars of rapid decline has almost corrected most of it. If it continues downward for another wave, or with the help of bottom divergence, it will slowly brew a short-term bottom; today's gold rebound focuses on the resistance below 3367, below the extreme middle track of 3380, and it is still bearish if it cannot withstand the pressure. If the strong support of 3260 or 3245-28 is stable, we will start to consider bottom-fishing.

Gold 100% Profit SignalFrom the current 4-hour analysis, the short-term pressure on gold is 3343-50, and the important pressure on 3360-66. The operation is still mainly short-selling if the rebound does not break. Below, we first pay attention to the short-term support of 3310-15, and the important support of 3260-68.
Gold rebounds to 3343-50 line short, rebound to 3360-66 line to cover short, stop loss 3372, target 3310-3315 line, continue to hold if it breaks

3360 neckline is being tested!
📊Comment Analysis
Short-term short positions need to rebound further and confirm the signal before following. After the US market breaks through the 3360 defense point, it is temporarily not possible to continue to be bearish. The US market will first look at the rebound, and then make further arrangements after approaching the 3360 line.
💰Strategy Package
Long positions:
The US market temporarily enters the market to go long when gold falls back to around 3297-3310 US dollars. Target 3340, stop loss 3345.

GOLD OUTLOOKThis chart is a technical analysis setup for Gold Spot (XAU/USD) on the 1-hour timeframe, showing a potential sell (short) trade idea. Here's a breakdown of the chart elements:
🔍 Key Zones Identified
Entry Zone:
Around 3380$-3394$
This is the suggested area where the trader plans to enter a short position (sell), expecting price to reverse downward from here.
Stop-Loss Area:
Ends near 3,415.80 USD
This zone is above the entry area and marks the risk level — if the price reaches here, the setup becomes invalid and the trade would be exited at a loss.
Target / Reversal Zone:
This is the take-profit area where the trader expects the price to potentially reverse or where they will close the short trade with profit.
📉 Trade Idea Visualization
Price is expected to move up slightly into the entry zone.
Then reverse downwards, hitting the target near the reversal zone.
✅ Summary of the Setup
Bias: Bearish
Strategy: Wait for price to hit entry zone (~3,380.00), then sell
Stop-Loss: Above 3,415.80
Take-Profit: Near 3,246.35
Risk-Reward Ratio: Favorable (large potential reward vs. smaller risk)....

Gold market analysis referenceThe recent gold fluctuations are really violent and fast. If you hesitate for a moment, you will basically miss the market. If you are too impatient, you will easily hit the stop loss. Now the fluctuations in a few hours are equivalent to the fluctuations in the past month. The stop loss of 3-5 US dollars can be easily swept. The market is changing, and the corresponding stop loss should also be enlarged.
Gold opened higher and hit 3336 in the morning on Monday, continuing the decline of last week. The idea in the morning was to be bearish directly at the analysis point of 3332. After hitting the lowest point of 3268, it fluctuated upward. The European session also fell to 3273 and then rebounded. The highest point in the US session just reached 3336 again, a standard bottoming and rebounding trend. Since it is an adjustment structure, let's re-analyze the idea. The gold price fell at 3500 and rebounded at 3260 last Wednesday. The rhythm was volatile. It rebounded above 3260 many times below, and did not cross the first rebound high of 3367 above. From a technical point of view, the gold price needs to effectively fall below the 3265-3260 US dollar range in the short term before it can confirm a larger correction downward. Once it is confirmed to fall below, the gold price may quickly fall to the 50% retracement level near 3225 US dollars, further pointing to the 3200 US dollar mark. If it loses 3200 US dollars, it will suggest that gold may have peaked in the short term.
For the current gold, the 4-hour chart is stuck in a wide range of oscillations between 3260-3338, and is currently at the edge of the lower track. Gold has formed a multi-round back-test support area at the 3270 price level. Although the price has touched this level several times, it has not effectively broken down. The bulls have launched a phased counter-attack. In terms of technical form, the double pressure characteristics have appeared near the previous rebound high of 3370. This area has the dual attributes of the second wave rebound target and the right shoulder pressure level of the head and shoulders top pattern. Today, we mainly focus on the closing price. If it stands firmly at the 3336 line, then we will adjust our thinking tomorrow. On the contrary, it encounters resistance at the high point of today's morning session at 3336 and then falls back, and goes to the 3278 line. Tomorrow we will continue to look at the idea of swinging and falling. On the whole, today's short-term operation strategy for gold is recommended to be mainly short-selling on rebounds, supplemented by long-selling on pullbacks. The short-term focus on the upper side is the 3338-3340 line of resistance, and the short-term focus on the lower side is the 3265-3260 line of support.
Strategy 1: When gold rebounds to around 3338-3340, short sell (buy short) in batches, 20% of the position, stop loss 6 points, target around 3300-3280, break to 3270
Strategy 2: When gold falls back to around 3265-3270, buy (buy up) 20% of the position in batches, stop loss 6 points, target around 3300-3320, break the position and look at 3330
Gold price moves up and down, hard to tell whether it is long orThe 4-hour chart is stuck in a wide range of oscillations between 3260-3338, and is currently at the edge of the lower track. Gold has formed a multi-round back-test support area at the 3270 price level. Although the price has touched this level several times, it has not effectively broken down. The bulls have launched a phased counter-attack. In terms of technical form, double pressure characteristics have appeared near the previous rebound high of 3370. This area has the dual attributes of the second wave rebound target and the right shoulder pressure level of the head and shoulders top pattern. Pay attention to the closing price. If it stands firmly at the 3336 line, then we adjust our thinking to treat it. On the contrary, if it encounters resistance at the early high of 3336 and then falls back, and moves closer to the 3278 line, we continue to look at the idea of swinging and falling. On the whole, today's short-term operation strategy for gold is recommended to be mainly short-selling on rebounds, supplemented by long-selling on pullbacks. The short-term focus on the upper side is the 3338-3340 line of resistance, and the short-term focus on the lower side is the 3265-3260 line of support.

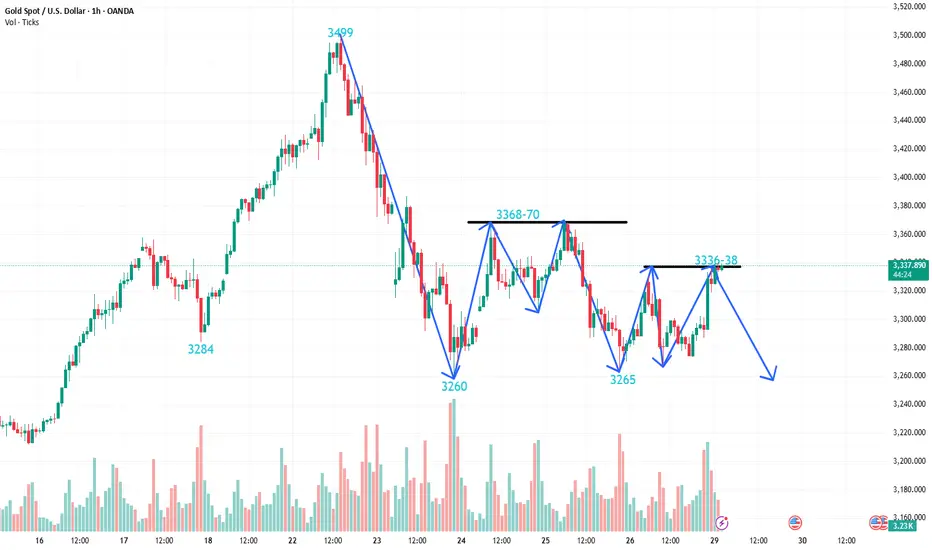
#XAUUSDTwo resistances are shown, which can be used to trade short. One signal is higher risk because it has a higher stop, and the other is lower risk.

Gold bull and bear tug-of-warGold fluctuated widely last Friday, with the range exceeding 100. This week, we need to pay special attention to the release of ADP employment data. Currently, the upper resistance is 3336-3340 and the lower support is 3260-3265. It is recommended to go long on the pullback.

Gold 100% Trading StrategyGold prices continued to fluctuate this week. Last Thursday, gold prices stabilized and rebounded near $3,284, and remained strong after breaking through $3,300. During today's Asian session, gold prices repeatedly hit the 3,385 pressure level but failed. After retreating to around 3,369 and gaining support, they rebounded again to around 3,396. The current price faces technical repair needs, but the overall upward trend has not changed, and the probability of breaking through the $3,400 mark is still high. The support level of the retracement is focused on the Asian session low of 3369 US dollars and the 4-hour MA5 moving average of 3360 US dollars. You can arrange long orders on dips; the upper pressure focuses on the 3396-3400 line. After breaking through, you need to be alert to the pressure of the daily error band indicator of 3425-3430 US dollars. At present, you can go short at the rebound of 3395 in the short term. The general trend is still dominated by low and long.
Gold recommendation: Go short near the rebound of 3395-3400, stop loss 3405, target 3370, strict stop loss for large fluctuations
Gold operation: Go long near the retracement of 3370-3375, stop loss 3362, target 3400, strict stop loss for large fluctuations

Gold 100% Profit SignalGold has retreated from $3,500, is the price near a top? Possibly. But I wouldn't sound the alarm bells just yet. This is most likely due to some regular profit-taking. The high indicators are more of a warning than a call to arms. Rather than "get out of here," it's more of a "stay alert."
At present, the initial support below is in the 3405-3400 area. Further down are the two key support levels of 3380 and 3357. 3380 is the support level near the middle track of the 4-hour level, and 3357 is an important top and bottom conversion position in the previous period. These two positions still provide strong support for the future market rise. At present, the 4-hour level high has closed in a bearish pattern of Yin engulfing Yang engulfing, and the K-line is negative. The short-term is expected to improve and fall back. Short-term operations will mainly rebound from high altitudes. Pay attention to the resistance near 3435 and 3450 on the top and do not break the air. Pay attention to the support near 3408-3400 on the bottom. If it breaks, adjust the position and continue to look at 3380.

#XAUUSDYou can enter in two steps and you can only enter in low risk, in this case the profit is less but the stop is also lower. Don't forget the risk-free option.

Gold short-term profit is more fun
🌐 Driving factors
Geopolitical situation: US President Trump's special envoy Witkov held a three-hour meeting with Russian President Putin in Moscow last Friday to discuss the US plan to end the war in Ukraine. The Kremlin said that the positions of the two sides have become closer.
India accused Pakistan of sheltering terrorist organizations, and Pakistan denied it and accused India of instigating separatist activities in Pakistan (such as Balochistan). The situation is difficult to control.
Latest news: Russian President Putin announced on the 28th that a ceasefire will be implemented from 0:00 on May 8 to 0:00 on May 11.
Market bullish sentiment cools down
📊 Commentary analysis
According to the trend of gold in the Asian and European sessions, the trading signals derived from technical analysis have helped many people achieve short-term victories.
🔷 Technical side: For the current gold, the 1-hour chart card fluctuates widely between 3330-3292, and is currently around $3324.
✔Operational suggestions, short-term trading:
US gold operation strategy:
Short strategy: If gold falls back to the range of 3330-3350, you can enter the market to short, target 3270, stop loss 3355
💥Risk warning
Liquidity risk: The market may be bearish in early May, and price fluctuations may be amplified.
Policy black swan: Trump may suddenly change tariff policies or personnel changes at the Federal Reserve, causing violent market fluctuations.
Technical false breakthrough: There are a large number of stop-loss orders near $3350, and you need to be wary of reversals after inducing more.
Summary:
This week, the gold market will be affected by geopolitics, Federal Reserve policies and the trend of the US dollar, and the fluctuation range is expected to be between $3260 and $3350. Investors need to pay close attention to key support and resistance levels and adjust strategies flexibly.

Gold 3260-3370 life and death tug of war!This week, whether gold is extremely strong or volatile, we first look at whether 3370 breaks. If 3370 is not broken, it will be in a low-level oscillation range. If 3370 breaks, we will see a unilateral upward trend. In the morning, gold was affected by the geopolitical situation over the weekend and opened higher at 3337, but it opened high and closed low, so it is still in a low-level oscillation range. Today, gold fell and did not continue to break the bottom, so we should not be overly bearish. We should pay attention to the bottoming out and rebound at any time. The support moved up to around 3285. We will rely on 3285 to buy more when we fall back, and then go short when it rises to 3340-3345. It is still volatile at present. Don't chase the rise and sell the fall before it breaks.Although the bullish trend remains unchanged, we must admit that after last week's adjustment, gold is not currently in a very strong bullish trend, but is fluctuating at a low level under the bullish trend.

XAUUSD FLAT BOTTOM PATTERNI Created This XAUUSD Chart Analysis In 1-H Tf
Entry Point : BUY Limit 3265
Support zone : 3260
Target Will Be : 3320
NOTE : THIS CHART IS BASED ON PERSONAL ANALYSIS FOR LEARNING PURPOSES. PLEASE USE PROPER RISK MANAGEMENT

XAUUSD BULLISH CHART MAPPING IN 15-M TFI Created This XAUUSD Chart Analysis In 15-M Tf
Entry: BUY from 3387
Support zone : 3386
Target Will Be : 3405
NOTE : THIS SIGNAL IS BASED ON PERSONAL ANALYSIS FOR LEARNING PURPOSES. PLEASE USE PROPER RISK MANAGEMENT

#XAUUSD:From Our Last Analysis 534+ Pips What Next?We published our analysis on gold on April 24th, highlighting the bullish market presence. The price indeed reversed from our zone, enabling us to make a significant move of over 234 pips. We anticipate a continuous price increase from our entry zone, potentially reaching 3500$. There are several reasons behind this belief. Firstly, the escalating war-like tension between India and Pakistan could lead to a surge in gold prices, potentially surpassing the previous high. Secondly, the heightened tensions among global investors are expected to result in an extreme bullish movement in gold prices.
Given the volatility of gold, we recommend trading cautiously and taking extra precautions while trading gold.
Wishing you good luck and safe trading!
Thank you for your support! 😊
If you’d like to contribute, here are a few ways you can help us:
- Like our ideas
- Comment on our ideas
- Share our ideas
Team Setupsfx_
❤️🚀

Gold is expected to continue to retrace the 3235-3225 region.Fundamentals:
1. The tariff issue has been relatively eased, and Trump's repeated attitude towards tariffs has made the market bullish energy not firm;
2. A small-scale conflict broke out between India and Pakistan, which has not had a great impact on gold for the time being. It is necessary to pay attention to whether the situation will escalate;
3. At the same time, it is necessary to pay attention to the dynamics of the Federal Reserve, the Russia-Ukraine negotiations, the US-Iran negotiations, etc.
Technical aspects:
At present, gold is in a state of shock correction as a whole, but from the current structure, the rebound momentum of gold is insufficient, and the rebound high is gradually decreasing. The short-term support below is in the 3265-3260 zone; the short-term resistance above is at 3310-3320; if gold cannot stand above 3300 in the short term, gold may fall further and break through the 3265-3260 zone, and continue to the 3235-3225 zone.
Trading strategy:
Short-term trading is still mainly shorting gold after the rebound. You can use the 3300-3320 area as resistance and short gold in batches
Trading target:
Profit target this week: ≥$30K;
OANDA:XAUUSD CAPITALCOM:GOLD FOREXCOM:XAUUSD FOREXCOM:XAUUSD

Gold market, further decline is likelyOANDA:XAUUSD Continue to test the support level of 3270 points, looking for a breakthrough. Any easing of the Sino-US conflict may trigger a price drop. But things are not so simple.
The Chinese Ministry of Foreign Affairs issued a statement: China and the United States have not discussed or negotiated on the issue of tariffs.
Gold prices are under pressure before the tariff war and the release of US data.
International situation: Russia issued a statement on a truce; and Ukraine issued a statement: If Russia really wants to achieve peace, it must immediately cease fire. If the two sides formally sign a truce agreement, the safe-haven demand for gold may also be greatly reduced.
In the morning, gold prices tested last week's low of $3260, and the strengthening of the US dollar and the possible easing of Sino-US trade risks put gold prices under pressure.
Traders are waiting for the release of key US GDP and labor market data, which may affect the Fed's interest rate expectations. In this context, if macro statistics are weak and geopolitical risks remain, the correction in gold prices may be replaced by growth.
Another test of the support level may trigger a breakthrough. It is necessary to pay attention to the situation between China and the United States. Any easing of the situation will trigger a decline in gold.
Upward resistance: 3300, 3325
Downward support: 3265, 3245, 3230
The possibility of further decline in gold prices has been exhausted since the opening. Gold prices may strengthen to the above resistance levels. A false breakout of 3300/3325 may trigger a decline, which may bring gold prices closer to the support level of 3270.

Gold's Trend and Trading Strategy for Next WeekLast week, the price of gold sharply declined after hitting the resistance level of $3,500, dropping to around $3,260 at its lowest point. The weekly chart closed with a bearish inverted hammer candlestick pattern, suggesting a sharp short-term downward momentum. However, on Friday evening, the gold price rebounded near the support level of $3,260 and regained the $3,300 mark. Combining the current fundamental and news-driven analysis, gold remains in an overall upward trend:
Technical Analysis
Although the weekly inverted hammer pattern indicates selling pressure at higher levels, the rapid rebound from the bottom to reclaim the key $3,300 level signals the persistence of bullish momentum. If the short-term decline fails to effectively break below the strong support at $3,250, the gold price has the potential for a rebound.
Trading Strategy
Next week, it is recommended to adopt a bullish bias and focus on long positions. Consider entering near $3,283, with a stop-loss set below $3,260. The upper resistance levels are sequentially $3,331 (short-term resistance) and $3,370 (target after breakthrough).
Risk Warning
Be vigilant against shocks to gold prices from sudden geopolitical news or changes in Federal Reserve policy expectations, and strictly control position sizing and stop-loss levels.
I hope this strategy will be helpful to you.
When you find yourself in a difficult situation and at a loss in trading, don't face it alone. Please get in touch with me. I'm always ready to fight side by side with you, avoid risks, and embark on a new journey towards stable profits.

Pay attention to the direction of the breakoutIn the early trading session, gold declined after touching $3330 and rebounded after hitting bottom near $3260. The price movement is highly consistent with the strategic analysis we pushed over the weekend.
It is recommended to trade within the range of $3260 - $3331. Closely monitor the direction of price breakouts.
-$3331 (short - term resistance level)
-$3260 (short - term support level)
I am committed to sharing trading signals every day. Among them, real-time signals will be flexibly pushed according to market dynamics. All the signals sent out last week accurately matched the market trends, helping numerous traders achieve substantial profits. Regardless of your previous investment performance, I believe that with the support of my professional strategies and timely signals, I will surely be able to assist you in breaking through investment bottlenecks and achieving new breakthroughs in the trading field.
