Gold's retracement is an opportunity to go longStay long and don't relax. Continue to buy gold when it falls back!
The gold market has fluctuated violently recently, with a rise of $100 and a fall of $90, which has brought great obstacles to our trading. Long and short positions with bad entry positions will be washed out, so we need to wait patiently for opportunities in operation. The strong market remains unchanged. Continue to buy when it falls back. Find the watershed position to participate in the transaction. It is better to miss it than to be too aggressive. In the Asian session, I will share with you the support of the 3405/3410 watershed of gold. I will rely on this position to buy when it falls back. Gold hit a high of 3499 during the day, which is one step away from 3500. The European and American sessions fell back by $90, which just happened to fall back to the watershed position shared with you in the Asian session. The long orders have also been realized at the target position. Friends who have participated should pay attention to protecting profits, and friends who are short should wait patiently for opportunities and not be too aggressive!
Xauusdanalysis

Gold bulls are not strong enoughGold has begun to form an inverted V reversal pattern in the 1-hour moving average. If the 1-hour moving average of gold begins to turn, then gold may have a deep adjustment. If there is no strong risk-averse news for gold, then adjustments are inevitable. Gold is at least volatile in the short term. Don’t chase too much easily. Pay attention to the pressure near 3450.
Trading idea: short gold near 3446, stop loss 3456, target 3426

GOLD Choose The Easy Scenario , Is It Will Continue ?Here is my 2 entries n Gold ( Scalping Entry and swing entry ) if you checked my last analysis post on gold you will see that we had 2 scenarios and the price choose the easy one , now i`m in 400 pips profits for both entries , and looking to sell it again if the price close below my entry and back again to retest it , it will be a great chance to enter again with 500 pips target at least !

(XAU/USD) Bullish Setup: Demand Zone Bounce with 5.89% Trgt Ptnl🔵 Current Price: $3,451.03
🟡 EMA (9): $3,457.20
🔻 Price is just below EMA — short-term pressure.
Zones & Key Levels:
🟦 Demand Zone:
🔽 Price bounced here before — strong buyer interest!
📍 Zone Range:
* Top: $3,442.38
* Bottom (Stop Loss): $3,395.87
* 🔴 Stop Loss set here to limit risk.
🟨 Entry Point:
* Entry suggested at $3,457.20
* Just above the current price and EMA — needs confirmation
* ⚠️ Wait for bullish candle or price action signal above EMA
🟩 Target Point:
🎯 Target: $3,645
* 📈 Potential gain: +202.78 pts (5.89% upside)
* 🚀 Aiming to break previous ATH (All-Time High)
Visual Trade Plan Summary:
* ✅ Buy Entry: $3,457.20
* ❌ Stop Loss: $3,395.87
* 🎯 Target: $3,645.00
* ⚖️ Risk-to-Reward: Solid, over 3:1
Sentiment:
* If price respects demand zone and reclaims EMA — bullish setup
* 🕵️♂️ Watch for volume or confirmation candle near entry

The pullback and adjustment encounter resistance.Today, gold opened with a direct rebound and rally. As of now, after gold reached a high of around 3,500 at its peak, it started to pull back and adjust. This also confirms what we said earlier that gold was aiming for the level around 3,500. I have repeatedly emphasized that one should not chase long positions at high levels. Taking long positions near 3,450 after a pullback is a more stable and secure approach. Moreover, today I also assisted many friends who contacted me in successfully unwinding their long positions at high levels. Right after the positions were unwound, gold began its pullback journey, reaching a low of around 3,443. In our actual trading, we entered long positions at around 3,448-3,450. We perfectly made a profit of ten US dollars and exited the positions. We will continue to focus on taking long positions after pullbacks. Try to avoid contrarian operations and chasing long positions at high levels as much as possible. Otherwise, the market will teach those who are not convinced a lesson.
If your current gold trading performance is not satisfactory and you hope to avoid detours in your investment, you are welcome to communicate and exchange ideas with us!

GOLD trade setup looking for long.This chart is a technical analysis of the Gold Spot price (XAU/USD) on the 15-minute time frame. The analysis outlines a potential bullish trading setup, aiming for a price recovery toward the all-time high (ATH) and a final target of 3,500 USD.
Market Phase: The price has recently pulled back from a high and is currently showing signs of consolidation or minor retracement.
2. Chart Highlights:
Final Target (Take Profit):
Level: 3,500 USD
This is marked at the top of the chart and labeled as Final Target and also tagged as ATH (All-Time High).
The analyst anticipates that after a short-term retracement, the price will rise again and potentially reach this level.
Support Zone (Buy Area):
approximately between $3,443.840 and $3,442.
This is considered a demand zone or support level where buying interest might emerge.
The analyst expects the price to drop into this area and then reverse upward.
Entry Strategy:
The chart suggests waiting for the price to touch the support zone (blue area), and once signs of bullish reversal appear, enter a buy position.
Stop Loss (SL):
Clearly marked just below the support zone at $3,427.438.
Placing the SL here minimizes loss in case the market breaks the support and continues downward.
A minor drop into the support area.
A reversal and bullish continuation.
Targeting the all-time high near $3,500.
5. Risk-Reward Setup:
This trade appears to be structured with a favorable risk-to-reward ratio, aiming for a high return (from around $3,443 to $3,500) compared to the risk (down to $3,427).

GOLD - at his current support? whats next ???#GOLD. market perfectly placed his current supporting region that is around 3448-49 to 3452-53
keep close that region because only that region can create agian buying volume.
NOTE: we will cut n reverse below 3449 on confirmation.
good luck
trade wisely

The bull market is extremely strong! Keep the rhythm right!Analysis of gold trend:
On Tuesday (April 22) in the Asian session, spot gold continued to rise. Fundamentally, on Monday, as Trump's comments on Powell damaged investors' confidence in US assets, the US dollar index plummeted to its lowest level since March 2022. The United States plans to impose new tariffs on solar products imported from four Southeast Asian countries. Trump's approval rating has dropped to the lowest level since returning to the White House. The market's risk aversion has increased, and gold prices have strengthened significantly. At present, global trade tensions will continue, and concerns about economic growth and inflation expectations will continue to support gold prices.
After rising to around $3,430 at the beginning of the week, the price of gold retreated slightly to around $3,406. Before the close, it was more of a shock operation at the high of the day. Including the idea given before the break at the beginning of the week, the price of gold will continue to break new highs on Tuesday. But it was not expected that the price of gold would rise to around $3,500 during the Asian session, which was indeed a bit unexpected. At the end of the Asian session, the price of gold retreated, retreating to around $3,461. This retracement came relatively late, breaking the normal operation system. Today, it is recommended to refer to the suppression range near 3490 US dollars and 3500 US dollars for shorting. If it breaks above, refer to the daily error band indicator near 3510 US dollars for shorting. If it breaks below, refer to the support near 3455 US dollars and 3444 US dollars for longing. If it breaks below, look at the 3437-3390 US dollars range for high selling and low selling.

The ultimate safe-haven gold price will not fall! Keep bullish!Remember that gold is currently the ultimate safe-haven asset. Any pullback is actually an opportunity for you to get on board. Before the current trade war eases, gold is still the most favored asset in the market. A year ago, people thought that it was not outrageous for gold to rise to $5,000 by 2030; now, this prediction has become "conservative".
Fundamentally, this is because the current rise in gold is a performance as a "monetary asset" rather than a "commodity asset". This redefinition of gold's "identity" - especially under the catalysis of major events in the past few weeks - has also triggered people's deep thinking about the future role of gold in the international monetary system. It may be moving towards a new positioning: the ultimate safe-haven asset.
The current retracement of gold has given you an opportunity, so don’t hesitate to enter the market directly at 3440-3450 for long orders, and buy directly at 3455-60 radically, and continue to watch the upward break to new historical highs!

Gold hits a new high. Will it have no ceiling?Analysis of gold trend:
Spot gold continued to rise in early Asian trading on Tuesday.
Fundamentals:
On Monday, the US dollar index plunged to its lowest level in three years as Trump's remarks on Powell undermined investor confidence in US assets. The United States plans to impose new tariffs on solar products imported from Southeast Asia, and Trump's approval rating has dropped to the lowest since returning to the White House. Risk aversion has increased, and gold prices have strengthened significantly. The current global trade tensions will continue, and concerns about economic growth, inflation expectations, etc. will continue to support gold prices.
Technically:
From a technical perspective, it is difficult to see such a large upside, and in this uptrend, there is basically no room for adjustment. Therefore, it is difficult to keep up with the rise of this bullish trend. Gold does not guess the top in the bullish cycle, as long as it can give a decline, it is an opportunity to go long. From the daily chart, the big positive line in the daily K-line is pulled up, and the trend is mainly broken; the shape is bullish; the golden cross of the stochastic indicator suggests that the bulls have not ended; the MACD double lines are upward, which is the main bullish signal; the short-term 4-hour level, the current 5-day moving average support has moved up to the 3438 line, which is also the bullish support level after the normal adjustment of the market. It should be difficult to give a very strong trend, so you should be flexible in operation. Don't look at the serious divergence of MACD and the serious overbought of RSI for the time being, and you can't help but short it.
Quide's analysis: The current market rise is all due to tariffs, and the technical aspect has no great reference significance. As long as the tariffs are not relaxed, gold will be difficult to pull back. Today's gold rise is expected to rush to 3,500 US dollars. Further look at 3,520-3,550.
I am Quide. Seeing my analysis strategy, no matter the past gains and losses, I hope that you can achieve investment breakthroughs with my help and turn every tide of the gold market into our wealth wave.

Gold is rising step by step, and the 3500 mark is in danger
📌 Driving events
Geopolitical conflicts are escalating (such as the deterioration of the situation in the Middle East)
US CPI data is lower than expected (85% year-on-year)
📊 Comments and analysis
Although gold has experienced a correction, the price of gold has quickly risen strongly, and the positive fundamentals have pushed the market to set new historical highs. As of the end of the Asian market, today's gold trend is almost a replica of yesterday (the gold price continued to rise from the Asian market to the US market on Monday).
What is a bull market? It is to break the cognition of most people, and the rise makes people doubt their lives. Not seeing it does not mean that it does not exist. Empiricists are destined to be eliminated. The underlying logic of the rise in gold during the financial crisis in 2008 and the rise in gold this year has long changed.
💰Strategy Package
Long position:
Actively participate at 3470 points, profit target is above 3500 points
⭐️ Note: Labaron hopes that traders can properly manage their funds
- Choose the number of lots that matches your funds
- Profit is 4-7% of the fund account
- Stop loss is 1-3% of the fund account

GOLD New 2 Scenarios Available , Which One You Prefer ? Here is my opinion on Gold right now , after my last 2 posts on It , now i see the price need to go down a little to make any correction and i think this will happen tomorrow , so if we have a 4h Closure below my Support , we can sell it at least for 300 pips , and if we have not , then we can buy it but i prefer to sell it before buy it again , just follow the price action and then you can take you decision .
This Is An Educational + Analytic Content That Will Teach Why And How To Enter A Trade
Make Sure You Watch The Price Action Closely In Each Analysis As This Is A Very Important Part Of Our Method
Disclaimer : This Analysis Can Change At Anytime Without Notice And It Is Only For The Purpose Of Assisting Traders To Make Independent Investments Decisions.

Gold Quarterly Shift Analysis - April 2025This post is based on my learnings from #ICT Quarterly Shift Analysis teachings.
----------------------------------------------
Previous Analysis:
In September 2024, I published my quarterly shift analysis for #Gold. Back then, I estimated a shift in the market structure for Gold on or around the US Presidential Election date. It happened exactly as outlined. I estimated Gold would make a bearish move or create a large range; it indeed created a large range and has been moving within the range since then. The top of the range is 2790.10, and the bottom of the range is 2536.60.
Then I posted a new Quarterly Shift Analysis on 13 Jan 2025. I specified the time window for a shift in the market structure to happen, and price indeed delivered as outlined. I said that between the 20th and 31st of January, Gold would determine its new direction. On 30 Jan 2025, Gold created a new all-time high and closed a strong daily candle above the range described before. Gold hit and exceeded all the targets outlined in my analysis.
-------------------------------------------------------
New Quarterly Shift Analysis:
As we get closer to the end of April, Gold seems to be in a rush to make new highs and hit new targets. I believe that from the end of April to the 2nd of May 2025, Gold can hit $3411 and possibly $3498 or $3500. If it's too aggressive, $3582 can also be reached.
Between 30 April and 02 May (NFP Announcement Date), Gold should make a new quarterly shift. The possible scenarios are as follows:
1. Continuation: Gold could make a retracement and then continue the current uptrend for the next 3–4 months. The retracement could go as deep as 3180, 3068 and 2982. The uptrend targets will be the targets mentioned above plus 3618 and 3738.
2. Enter a long-term range (My guess is this is the most likely scenario): Gold could enter a new long-term range for the next 3–4 months. The bottom of the range will be 2958, and the top of the range will be the highest high created by Gold by or before 30 April to 2nd of May. If this scenario happens, it is a good chance to look for sell opportunities near or within the top 25% level of the range and look for buy opportunities near or within the bottom 25% level of the range.
3. Bearish Move: If Gold closes a strong daily candle below 2958, then for the next 3–4 months, it could go lower towards 2832, 2790, 2728, and 2662. This scenario might not be highly likely, but in the event if it happens, it's a wonderful opportunity for long-term Gold investors to buy and hold Gold.
-----------------------------------------------------------
Disclaimer: This is not a signal, just an analysis for your consideration and benefit. Please combine it with your own analysis.

Gold trading ideas for todayHello everyone. Let's discuss the trend of gold this week. It can be seen that gold has retreated to around 3452, and 3452 is also the support position of the AM10 moving average.
The next operation is actually very simple. If gold stabilizes at 3445-3430, it should continue to buy.
If it falls below 3430, then you need to wait for around 3400 to buy.
There is no need to look too far for the upper target price. Continue to look at the high point of 3500, or even the new high of 3520.

Gold bulls are unstoppableGold is now too strong, and the rise is not going to end. It continues to rise. Before the gold daily line reverses at a high level, the decline is just an adjustment, not a reversal. However, everyone should also pay attention to the reversal of the high level of the market at any time. Once the situation is not right, you must withdraw in time. With such a violent rise, if the market reverses next, it will also be very rapid.
Go long gold 3460-70, target 3495-3500.

Gold's short squeeze continues, and the rally is unstoppable!On Monday, the dollar index plunged to its lowest level since March 2022 as Trump's blast of Powell hurt investor confidence in U.S. assets.
Thanks to the weakening dollar and the inflow of safe-haven funds, spot gold opened higher and rose, breaking through the $3,430/ounce mark during the session, setting a new record high and rising by more than $100 during the day.
Today, Tuesday, gold continued to rise, and so far the highest has reached near the 3,500 mark.
From the hourly chart here: it can be seen that gold has just retreated to around 3,460, and 3,460 is also the support position of the am10 moving average.
If the 3,460 moving average cannot be broken here, then gold will continue to test 3,500, or even continue to set new highs.
On the contrary, if it falls below the ma10 moving average at 3,460, it may further touch the ma20 moving average support position near 3,440.
So, the next operation is actually very simple. If gold stabilizes at 3460-70, you should continue to go long.
If it falls below 3460, you need to wait for 3440 to go long.
There is no need to look too far for the upper target. Continue to look at the high point of 3500, or even the new high of 3520.

The Gold Will Make a new All Time HighHello Traders
In This Chart GOLD HOURLY Forex Forecast By FOREX PLANET
today Gold analysis 👆
🟢This Chart includes_ (GOLD market update)
🟢What is The Next Opportunity on GOLD Market
🟢how to Enter to the Valid Entry With Assurance Profit
This CHART is For Trader's that Want to Improve Their Technical Analysis Skills and Their Trading By Understanding How To Analyze The Market Using Multiple Timeframes and Understanding The Bigger Picture on the Charts

Risk aversion drives gold surging wildlyGold opened at $3,332 and closed at $3,424 yesterday, surging $92 throughout the day. The daily K-line formed a large bullish candle with minor upper and lower shadows, marking a nearly 3% gain and demonstrating a strong upward momentum.
Trump criticized Federal Reserve Chair Powell via social media, calling him a "big failure" and demanding immediate rate cuts, which intensified market uncertainty about the Fed's monetary policy and pushed the DXY lower.
The U.S. plan to impose new tariffs on solar products imported from Cambodia, Malaysia and other countries, combined with the long-term uncertainty of its comprehensive tariff policies, has fueled global risk aversion. Investors are withdrawing from U.S. dollar assets and turning to gold for hedging, serving as the core driver behind the sharp gold rally.
Overall, gold maintains a bullish trend in the long, medium and short terms, but short-term overbought correction risks need to be watched out for in technicals. It is recommended to focus on buying on dips, paying close attention to the retracement confirmation opportunity at the short-term support level of $3,440. Meanwhile, set reasonable take-profit and stop-loss levels to avoid volatility risks from chasing highs.
XAUUSD
buy@3440-3450-3460
tp:3480-3490-3500
I hope this strategy will be helpful to you.
When you find yourself in a difficult situation and at a loss in trading, don't face it alone. Please get in touch with me. I'm always ready to fight side by side with you, avoid risks, and embark on a new journey towards stable profits.

Gold Weekly Outlook: Strong Upward Trend, Continue to Go LongThere is no analysis to be made on gold at present, basically all longs are made, this bull market has to be said to be too crazy.
Since gold started to rise from the low point of 2956, except for two normal adjustments in the middle, the price of gold has maintained a strong upward trend relying on the MA5 moving average for most of the time. This trend characteristic shows that in a shorter period, the MA5 moving average has become an important support line for the rise in gold prices. As long as the price runs above the MA5 moving average, the bulls will dominate.
At present, 3500 is about to arrive in a flash, it is just a matter of time. The current market depends on everyone's courage. If you go in with a long order, you will definitely make a profit, and it is very easy, with basically no callback.
And any callback is an opportunity. In terms of operation, you can continue to go long relying on the short-term moving average MA5.
Just like the analysis in Quaid's previous article, you can boldly believe that it can reach the new height you think. Believe in Quaid, believe in yourself, brother, you can do it.
I am Quaid. After seeing my analysis strategy, no matter your past gains and losses, I hope that you can achieve an investment breakthrough with my help and turn every tide in the gold market into our wealth wave.

New peak of $3,520! Waiting for gold price to reach.
New peak of $3,520! Six major events this week detonated gold prices, waiting for gold prices to hit
📌 Driving events
1. Geopolitical black swans fly frequently
The tariff war between China, the United States and Europe has escalated comprehensively. The United States has imposed a 104% tariff on China (involving rare earths, semiconductors and other fields), and the European Union has implemented a 21 billion euro retaliatory tariff. The World Bank predicts that global GDP growth may fall by 1.8%. The situation in the Middle East continues to deteriorate. After the breakdown of the US-Iran nuclear negotiations, Israel launched an air strike on Iran's nuclear facilities, pushing gold to rise by more than 3% in a single day. Historical data shows that the average increase in gold during geopolitical crises can reach more than 20%.
2. The Federal Reserve may change its coach
US President Donald Trump once again criticized Federal Reserve Chairman Jerome Powell, exacerbating concerns about the independence of the central bank, which has exacerbated uncertainty. Reports that the US government is exploring legal means to remove Powell will only deepen market uneasiness and enhance the attractiveness of gold as a tool to hedge policy and economic instability risks.
3. Global central bank gold purchases hit a record high
In 2024, global central bank gold reserves reached 4,974 tons, and China increased its holdings to 73.7 million ounces for 20 consecutive months (accounting for 4.9%). From January to April 2025, the central bank's net gold purchases exceeded 420 tons, accounting for more than 25% of the annual demand. After China's insurance funds enter the market, it is expected that 255 tons of new demand will be added each year.
4. Gold ETF funds are pouring in
In the first quarter, global gold ETF funds inflow exceeded US$5 billion, and SPDR's daily inflow reached 226.5 tons (a three-year high). The asset management scale of domestic gold ETFs exceeded 101 billion yuan, and the holdings increased to 138 tons. The holdings of post-00 investors surged by 300%.
5. Inflation and stagflation expectations are rising
The US CPI rose 3.5% year-on-year in March, and the core PCE price index hit a 32-year high. The risk of economic "stagflation" strengthened the anti-inflation properties of gold. Citigroup's model shows that if inflation is higher than 3% for a long time, the probability of gold price breaking through $3,500 is over 60%.
6. Technical breakthrough triggers resonance
After spot gold broke through the key resistance level of $3,250, it triggered programmatic buying, and speculative long positions accounted for 67%. COMEX gold futures open interest surged 18%, and the premium of the main Shanghai gold contract expanded to 5 yuan/gram, reflecting the strong bullish sentiment in the market.
📊Comment Analysis
Geopolitical tensions, rising prices, trade tensions, gold prices benefit
💰Strategy Package
Long positions:
Actively participate at 3480-90 points, profit target above 3510-20 points
Short positions:
Actively participate at 3510-00 points, profit target below 3475-65 points
⭐️ Note: Labaron hopes that traders can properly manage their funds
- Choose the number of lots that matches your funds
- Profit is 4-7% of the fund account
- Stop loss is 1-3% of the fund account

Gold is now far away from the moving averageGold's 1-hour moving average continues to cross upward bullish divergence, and the gold bullish volume is still there. After breaking through 3400, gold has basically stabilized at 3400. Gold has also tested the support near 3405 several times in the US market. Gold continues to stabilize and rise. However, gold is now far away from the moving average, and we must always pay attention to the adjustment of the high position. Gold is watching the pressure around 3461

Gold at PRZ Again – Correction to $3,227 Possible!!!Gold ( OANDA:XAUUSD ) started to rise as I expected in the previous idea and created a new All-Time High(ATH) as usual . How long do you think the upward trend of Gold will continue!? ( Please give your reasons for the rise, I would appreciate it. )
Gold is trading near the Potential Reversal Zone(PRZ) and trying to break the Uptrend line .
In terms of Elliott Wave theory , it appears that Gold has completed another 5-wave impulsive .
Signs of the completion of the main wave 5 can be the presence of Regular Divergence(RD-) between Consecutive Peaks, and the break of the Uptrend line (validly) .
I expect Gold to fall to $3,227 in the coming hours.
Note: If Gold can move above $3,420, we can expect more pumps.
Gold Analyze ( XAUUSD ), 1-hour time frame.
Be sure to follow the updated ideas.
Do not forget to put a Stop loss for your positions (For every position you want to open).
Please follow your strategy; this is just my idea, and I will gladly see your ideas in this post.
Please do not forget the ✅' like '✅ button 🙏😊 & Share it with your friends; thanks, and Trade safe.

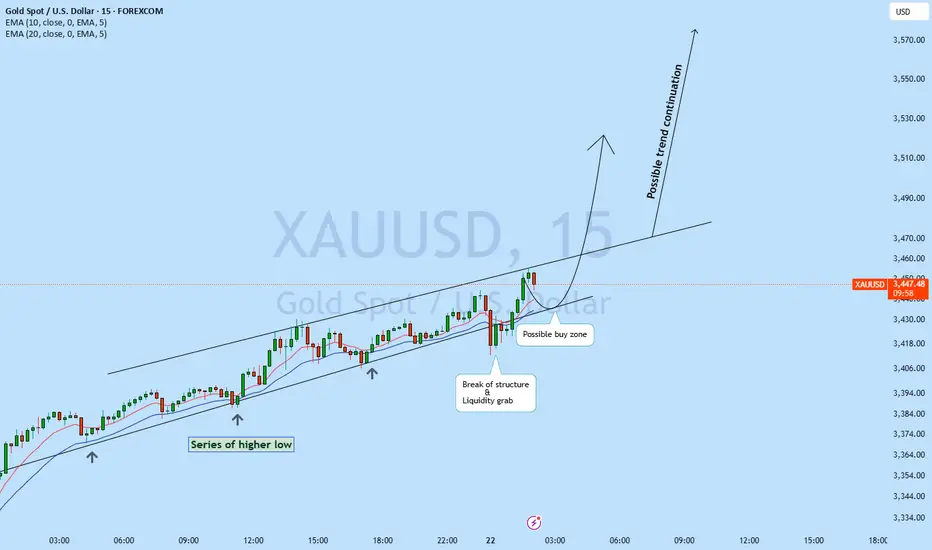
XAUUSD possible buy zone!XAUUSD is moving in the major direction of the rend with series of higher high and higher low
with multiple liquidity grab. Currently upon daily close, there has been a break of structure with strong liquidity grab giving this instrument a strong probability to move back to the upside with new moment. Upon pullback to the trend line is an area looking to buy upon price action confirmation.