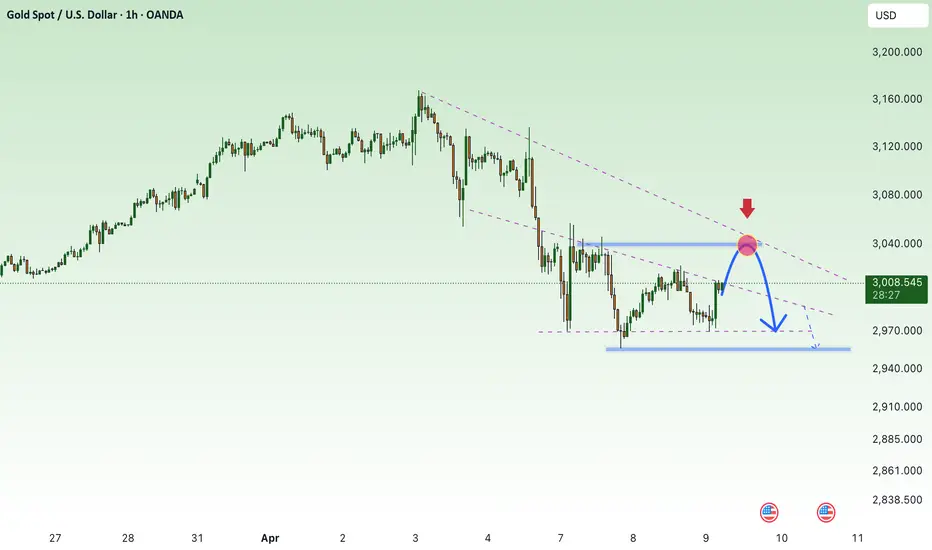
GOLD At Interesting Res Area , Should We Sell Now Or Wait ?Here is my GOLD Chart and this si 1H Time Frame , i`m looking to sell it if i have a bearish price action to confirm that the price will go down , i think the price will go up a little to make some wicks and take all stop losses before going down again maybe tomorrow, so i think we will see some stop hunts before the price going going down for 500 pips and then move again to upside very hard .
Xauusdanalysis

Gold is strong, wait for a pullback to go longThe 1-hour moving average of gold has formed a bullish arrangement with a golden cross upward, and gold is now supported near 3100. If gold can stand firm at 3100 after the data, then we can continue to go long on dips.
Trading ideas: Buy gold near 3100, stop loss 2990, target 3130

It is hard not to make a profit by trading CPI like thisI have to say that gold is indeed in a bullish pattern at present. After all, gold did not even fall below 3110 during the correction process. However, the current fluctuations are relatively cautious, and we are waiting for the guidance of CPI data, which may exacerbate short-term fluctuations!
To be honest, although gold is in a bullish pattern, the resistance above cannot be ignored, especially the 3150-3155 area and the previous high of 3167. It is not ruled out that gold will form a secondary high during the rise and form a double-top structure with the previous high of 3167, so I will not be a radical in the short term and set the target at 3200.
In addition, during the CPI data period, it is not ruled out that gold will rise and then fall back, so I do not advocate blindly chasing gold. On the contrary, I will definitely try to short gold in the 3050-3060 area. However, the market's long sentiment is high, and it is not advisable to have too high expectations for the magnitude of the correction in short-term trading. The first retracement target area is: 3105-3095, followed by 3080!

Will gold fall after a strong rise Goldmarket analysis referenceAnalysis of gold market trend: Today's gold is still fluctuating greatly under the influence of tariffs. Today, we have analyzed that gold has the risk of callback, and long positions are also falling back to lows! Trend realization analysis and ideas! From the surge on Wednesday, it can be seen that the risk aversion sentiment of gold has heated up again. The current highest is 3132, which is the first target point for the rise. If it continues to rise, it can see 3150 above, so there is still a lot of room above. Everyone should pay attention to trading with the trend as much as possible. In addition, there is another uncertain factor today. The US market will release CPI data, which will also bring abnormal fluctuations in gold. Therefore, the market will also fluctuate greatly today. Everyone should pay attention to controlling risks and managing positions well.
From a technical point of view, a positive line on the daily line directly changed the extremely weak adjustment state in the previous period. Now the positive line breaks the middle track of Bollinger and pulls up the moving average. Then, gold has entered an extremely strong state of bullish trend. In this state, it will continue to rise to the previous high of 3150. Therefore, the main direction today is definitely bullish. It is normal for the small cycle to adjust under the pressure of 3100. Now the Bollinger of the 4-hour cycle has just opened, and the unilateral trend has just taken the first wave of strength. There is no problem in the next wave to rise to the high point of the daily cycle. Therefore, as long as the 4-hour cycle falls back to the support of the unilateral moving average, it is an opportunity to do more. The support below is around 3070, and the rise of the hourly cycle is around 3060. Therefore, today's gold bullishness is expected to consider 3080 or 3070. The rise in the Asian and European sessions is still at 3130. If the US session breaks through 3136, consider seeing the high point of 3150. On the whole, today's short-term operation strategy for gold is to short on rebounds and to buy on pullbacks. The upper short-term focus is on the 3136-3155 resistance line, and the lower short-term focus is on the 3080-3078 support line. Friends must keep up with the rhythm. You must control your positions and stop losses, set stop losses strictly, and do not resist single operations. The specific points are mainly based on real-time intraday trading. Welcome to experience and exchange real-time market conditions.
Gold operation strategy reference: Short order strategy: Strategy 1: Short gold rebounds near 3133-3136, with a target of 3100-3090, and a break to look at the 3080 line.
Long order strategy: Strategy 2: Go long near the 3078-3080 pullback of gold, with a target of 3105-3125, and a break to look at the 3135 line.

Gold: CPI Data Trading ViewsToday's signals for XAUUSD / BTCUSD / GBPUSD all hit their targets!
Congrats to everyone who followed—great profits all around!
🕒 Reminder: CPI data will be released in 1.5 hours.
Before that, we may see:
A quiet, ranging market, or
A pre-release pricing-in scenario that leads to sharp volatility ⚠️
Trading Suggestions:
✅ If you want to avoid unnecessary risk, it’s better to pause trading and wait for the data release
✅ If you're holding positions, please:
Manage your risk carefully
For large positions, consider partial closing or adding SL
Post-CPI Strategy Outlook:
Price has reached key resistance zones
If the data is bullish, further upside may be limited due to:
Proximity to recent highs
Remaining selling pressure in the market
Therefore, focus on:
High-level short entries or low-level long entries
Avoid blindly chasing the market—don’t go long at the top or short at the bottom
To sum it up:
Control your emotions, manage your positions wisely.
The 30 minutes after the CPI release will separate winners from losers!

Gold's strong rise continues and may hit a high today!The previous decline from 3167 to 2957 was mainly caused by a liquidity crisis, in addition to the factors of buying expectations and selling facts of tariff policies. At present, the news has reversed at two levels, and the liquidity problem has been solved by this wave of sharp declines, so gold has returned to a strong bull market and stood above 3100 again. There is a high probability that it will hit the high of 3167 today. It depends on whether it can set a new high.
The current gold is mainly affected by the news, and the daily market fluctuates greatly. No one knows where the top is. The focus should be on the news, and the technical aspect can only be used as a supplement. Today, it directly rose and is currently trading sideways at 3130. Pay attention to the pressure at 3135-3136. There may be a small correction under pressure here, and the support below is 3110-3100.

Will the explosive gold rally continue?Today's international gold is still experiencing large fluctuations under the influence of tariffs. From the sharp rise on Wednesday, we can see that the risk aversion sentiment for gold has heated up again. The current highest is 3130, which is the first target point for the rise. If it continues to rise, it can reach 3150. Therefore, there is still a lot of room above. Everyone should pay attention to trading in line with the trend as much as possible.
From a technical perspective, a towering positive line on the daily line directly changed the extremely weak adjustment state in the previous period. Now the positive line breaks through the middle track of the Bollinger Bands, pulling up the moving average and increasing the volume. Then, gold has entered an extremely strong state of bullish trend. Under this state, it will continue to rise to the previous high of 3150. Therefore, the main direction today is definitely bullish.
The Bollinger Bands in the current 4-hour cycle have just opened, and the unilateral trend has just emerged from the first wave of strength. It is not a big problem for the next wave to rise to the high point of the daily cycle. Therefore, as long as the 4-hour cycle falls back to the support of the unilateral moving average, it is an opportunity to go long. The lower support is around 3070, and the rise of the hourly cycle is around 3060.
Investment strategy: Gold more than 3100, stop loss 3090, target 3150

XAUUSD Analysis TodayHello traders, this is a complete multiple timeframe analysis of this pair. We see could find significant trading opportunities as per analysis upon price action confirmation we may take this trade. Smash the like button if you find value in this analysis and drop a comment if you have any questions or let me know which pair to cover in my next analysis.

gold on buy till 3137#XAUUSD price have breakout 3100 once more now its will reach the ATH which will decline again on sell.
Firstly we buy at the rectangle 3100-3102 on multiple breakout first, target 3137 TP, SL 3085.
Above 3137 have bearish decline which will drop the price back but multiple breakout above 3137 will reach the ATH.

Gold Price Analysis April 10D1 candle confirms that the buyers have returned to the market with an increase of more than 100 prices. The retest points are considered buying opportunities to break ATH
3100 is a notable point for the Buy signal in this European trading session. Today's trading strategy is quite simple when a strong uptrend has just formed, we will wait for the retest points to 3100-3080-3056 for the BUY signal to break ATH. On the other hand, if gold does not test before, we can Sell Scalp around 3133 again, when it breaks, do not SELL anymore but wait for the retest of 3133 to buy up to 3162.
Have a nice day everyone

4/10 Gold Trading StrategiesGold maintained a bullish tone yesterday, with prices recovering steadily toward the 3100 level, offering smooth trade opportunities and favorable returns.
However, today presents a significantly more complex trading environment due to several high-impact events:
🇺🇸 US CPI (MoM + Core CPI)
📝 Initial Jobless Claims
🗣️ Fed speakers including Barkin and Schmid
Technically, gold is now at a crucial inflection point , where market interpretation diverges:
If this is merely a corrective rebound in a broader downtrend , the move may be near completion.
If instead it's a healthy retracement in an ongoing uptrend, we could be in the middle phase of a continued climb.
Given the mix of technical ambiguity and fundamental uncertainty, a neutral and reactive trading stance is essential today.
🎯【Recommended Strategy & Positioning】
Trade Against Emotional Swings
Avoid chasing price during high-volatility news. Look to sell after sharp rallies and buy after sharp dips , minimizing exposure to emotional trades.
Key Zone Analysis – Watch the Trapped Orders
3128–3158: Zone where many long positions may be trapped — watch for selling pressure.
3016–2978: Former short-entry zone — potential area for long-side reactivation if retested.
📌【Today's Key Trade Zones】
🔻 Sell Zone: 3143 – 3168
🔺 Buy Zone: 3013 – 2979
🔄 Flexible Zone 1: 3109 – 3058
🔄 Flexible Zone 2: 3045 – 3013
❗ Above 3170, focus only on short positions — avoid chasing long trades at elevated levels.

Gold trading zones: 10-APRIL-2025Good morning dear traders: Explore today's Gold trading zones and enhance your market knowledge.

Gold (XAU/USD) Breakout Setup – Bullish Reversal from RBR Zone!🔹 Trade Idea: Long (Buy) Setup
📈 Targeting a price rally from a demand zone!
---
🔵 .ENTRY ZONE (Buy Area)
🟦 Marked between 3,039.773 – 3,043.052
📍 Located in the RBS + RBR zone (Resistance becomes Support + Rally-Base-Rally)
💡 Price dipped here and bounced — showing bullish intent
🔻 .STOP LOSS
🚨 Placed at 3,014.537
🛡️ Protects you in case the price drops below the zone
✋ Risk is clearly defined here
🎯 .TARGET POINT (Take Profit)
🚀 Aiming for 3,115.910
💸 A high reward area if momentum continues
🔥 Great R:R ratio (~1:3) — solid risk/reward
📊 .Technical Confirmation
📌 Price has moved above the 9-period DEMA (3,043.052)
⚡ Signals bullish momentum
🕯️ Strong bullish candles forming after the bounce — confirming entry.
🔍 .Market Structure Notes
⬇️ Previous trend was down
🔄 Now forming a potential reversal
🧱 Support holding strong near 3,014–3,030
✅ Summary: 💥 Buy idea from demand zone
🔝 Targeting new highs
🛑 Stop loss tightly managed
⚖️ Clean setup with momentum on your side

GOLD - one n single resistance , holds or not??#GOLD.. perfect move as per our discussion and now we have one n single resistance area.
That is 3093-94
Keep close that area because that is our key level now and if market hold it in that case we can expect a drop below that..
Note: above 3093-94 we will go for CUT n reverse on confirmation.
Good luck
Trade wisely

Gold: Watch for Selling OpportunitiesGold remains under pressure around the 3100 level, where previous trapped buyers are creating significant selling pressure. The heavier resistance zone lies between 3127–3146, so if you’re holding long positions, don’t be greedy — this is a crucial area to watch!
Tomorrow during the U.S. session, we’re expecting major economic data and headlines. The market will likely see high volatility, and instead of a clear one-way trend, there’s a higher chance of a two-way sweep (both up and down).
Trading Advice for Tomorrow:
Avoid chasing price or getting caught in emotional trades.
Control your position size — even if you end up holding during turbulence, a small and managed position won’t hurt you. You might even come out profitable.
But if you enter with full margin and no risk control, the result could be heavy losses or even blowing your account. This is my honest advice!
During the Asian and European sessions, the technical outlook favors short positions. Consider selling around the 3103–3123 zone, with support levels at:
3078 / 3066 / 3051 / 3027 / 3011
I will release updated strategies for the U.S. session tomorrow based on key data releases. Stay tuned and feel free to reach out if you have any questions.
Good luck and trade safe!

XAUUSD:You need to refer to this strategyPresident Trump's sudden announcement of the suspension of tariffs has led to a significant shift in market sentiment.
As the tariff suspension policy has, to some extent, reduced market uncertainties, gold, which is frequently regarded as a safe-haven asset, has been subject to selling pressure.The substantial decline in price reflects the market's rapid reaction to this major policy change.
The market conditions are experiencing huge fluctuations. Fortunately, you've come across me. When you find yourself in a quandary and struggle to make a decision during trading, or when you're in a difficult situation and at a loss as to what to do, don't face it alone. Our professional team stands ready at all times, prepared to fight side by side with you and conduct an in-depth analysis of the market. Let's join hands and, while avoiding risks, embark on a new journey towards stable profitability.

Gold Hits Key Support – Reversal Ahead or More Fall?Gold ( OANDA:XAUUSD ) has entered a Correction phase after losing its ascending channel . Now, if you are in a Short position , this post will help you know where to take profit on your position or if you are looking for a Long position for gold , what area is suitable .
Gold is approaching an important Support zone($2,956-$2,917) that I don't think can be broken within a first attack . What do you think?
In terms of Elliott waves , Gold appears to be completing a bearish wave 5 , which appears to be able to complete at the Support zone($2,956-$2,917) .
I expect Gold to start rising again from the Support zone($2,956-$2,917) and to at least rise to $3,000 again and get close to the Resistance zone($3,058-$3,021) . It is likely to fall again after this move .
In your opinion, has Gold started a major correction, and to what price can this correction continue?
Note: If Gold can touch $2,890, we can expect further declines.
Note: Because the downward momentum is currently high, it is likely that wave 5 will also complete near $2,913, and we will see a fake break of the Support zone($2,956-$2,917).
Gold Analyze ( XAUUSD ), 4-hour time frame.
Be sure to follow the updated ideas.
Do not forget to put a Stop loss for your positions (For every position you want to open).
Please follow your strategy; this is just my idea, and I will gladly see your ideas in this post.
Please do not forget the ✅' like '✅ button 🙏😊 & Share it with your friends; thanks, and Trade safe.

Gold trading ideas April 9th ahead of FOMC MinutesAll entries demand confirmation on M5 or M15;
Snipers don't chase—they wait for the market to come to their scope;
You’re not “late,” you’re loading up for a legendary entry.
🔻 SELL ZONE
📍 3045–3055
🛑 SL: 3065
Why: M15–H1 OB + imbalance fill from previous BOS
Liquidity grab probability during London
🎯 TP1: 3015 | TP2: 2971 | TP3: 2943
🔻 SELL ZONE
📍 3094–3109
🛑 SL: 3122
Why: D1/H4 OB + unmitigated FVG + resting equal highs
Textbook supply raid + swing short
🎯 TP1: 3055 | TP2: 3015 | TP3: 2965
🟢 BUY ZONE
📍 2965–2950
🛑 SL: 2948
Why: H1 demand + FVG + trendline bounce
RSI recovery + bullish CHoCH M15
🎯 TP1: 2990 | TP2: 3022 | TP3: 3044
🟢 BUY ZONE
📍 2922–2904
🛑 SL: 2890
Why: Unmitigated Daily OB + final imbalance
Psychological trap zone if swept
🎯 TP1: 2943 | TP2: 2982 | TP3: 3022
🟢 BUY ZONE
📍 2885–2894
🛑 SL: 2870
Why: Breaker + extreme OB + fib 0.786
Liquidity grab scenario with high RR
🎯 TP1: 2950 | TP2: 3000 | TP3: 3050
📌 Bonus Notes
🔐 Watch 3060–3080 – strong base area.
📌 Important Notice!!!
The above analysis is for educational purposes only and does not constitute financial advice. Always compare with your plan and wait for confirmation before taking action.
📣 If this strategy sparked clarity, hit that like button and follow. 💛

4/9 Gold Trading Strategies
Gold opened with a mild bullish tone yesterday but faced resistance near 3018 , pulling back briefly before attempting a second push toward 3023 . However, the rally failed to sustain, and price returned near the opening level. Compared to recent sessions, yesterday marked a clear contraction in volatility, suggesting either a bottoming formation or a setup for a directional breakout.
From both candlestick structure and indicator alignment, the market appears primed for a potential bullish push today. If momentum builds as expected, a test of the 3037–3043 resistance zone is highly probable.
On the downside, 2976 remains the key initial support , followed by 2952 , which was the previous local low.
On the fundamental side, no major data releases are scheduled today. However, updates related to tariff policies will likely be the main market driver, and could trigger intraday volatility.
🎯 【Trade Setup for Today】
🔻Sell Zone: 3047–3066
🔺Buy Zone: 2968–2942
🔄Flexible/Scalping Zone: 2978–3023

Gold price accumulates below 3038, waiting for FOMC information⭐️GOLDEN INFORMATION:
Gold prices break a three-day losing streak but remain capped below the key $3,000 level, as rising US Treasury yields dampen the appeal of the non-interest-bearing metal. Despite optimism surrounding potential trade agreements among global partners, lingering tensions in the ongoing US–China trade conflict continue to keep investors on edge. At the time of writing, XAU/USD is trading flat around $2,980 per troy ounce.
⭐️Personal comments NOVA:
Gold price moves with large amplitude, in a downward correction phase. Continues to trade below 3040 waiting for the FED's move on interest rates and agreements on tariff levels of countries around the world.
⭐️SET UP GOLD PRICE:
🔥SELL GOLD zone : 3038 - 3040 SL 3045
TP1: $3028
TP2: $3015
TP3: $3000
🔥BUY GOLD zone: $2958 - $2960 SL $2953
TP1: $2975
TP2: $2990
TP3: $3010
⭐️Technical analysis:
Based on technical indicators EMA 34, EMA89 and support resistance areas to set up a reasonable SELL order.
⭐️NOTE:
Note: Nova wishes traders to manage their capital well
- take the number of lots that match your capital
- Takeprofit equal to 4-6% of capital account
- Stoplose equal to 2-3% of capital account
Gold Analysis April 9D1 frame is a Doji candle with unclear buying and selling power. but the market is still in the structure of a corrective downtrend.
H4 shows a strong increase from 2970 to 3050 due to data from fundamental analysis
Trading scenario: Gold is approaching the fionacci retracement zone. Pay attention to the two SELL zones today 3063-3065 and the zone 3089-3091.
For gold to move towards the upper SELL zone, gold needs to surpass 3047. If it does not break 3047 and close below 3039, wait for a retest to SELL to 3021 in the US session. If it does not break 3021, then BUY again in this zone. If it confirms closing below 3021, hold at 2990 today.

4/8 Gold Trading StrategyYesterday, gold dipped to the 2950 support zone, still under bearish pressure. However, the market did not enter into an extreme one-sided sell-off. Instead, an intraday rebound suggested that short-term buying interest is beginning to emerge.
Following last week's and yesterday’s sharp correction, the 1-hour technical structure has started to show early signs of a potential bottom. While a retest of the 2960–2950 area in the near term cannot be ruled out, the broader price action now supports the technical conditions for a medium- to short-term rebound.
Currently, gold is stabilizing around the 2980-2960 level. Even if additional bearish pressure emerges, the maximum downside support is expected in the 2919–2888 range. This suggests a likely transition into a low-level consolidation and base-building phase, rather than a continued steep decline.
From a technical perspective, the 3100 zone is a key corrective target for this pullback. The market may gradually move higher to complete a structure recovery, offering a limited-risk, clearly defined opportunity for the bulls.
📌 Key intraday resistance levels:
3018 → 3037 → 3058 → 3079
📌 Trading Strategy for Today:
🟢 Buy Zone: 2976 – 2948
🔴 Sell Zone: 3048 – 3062
🔁 Scalp/Range Zone: 3032 – 2998

Buy the Dips Towards 3080 – Gold Builds a Strong Base 🟡 What happened with Gold (XAUUSD) yesterday?
In yesterday's analysis, I mentioned that I was bullish on Gold, expecting a resumption of the upward move with targets extended to 3080 and interim resistance at 3050.
Although the price rose, it found strong resistance at the 3020 zone, which prompted me to close my buy trade with around 400 pips profit (although I was aiming for closer to 1k pips).
Afterward, the market started to drop and breached under 3000 again.
However, once the price reached the 2970 zone, bulls entered the market strongly and pushed the price back above 3000.
❓So now what? Is the correction over or will it continue?
Looking at the chart, we can clearly see two things:
✅ A solid support has formed around 2960-2970 zone
✅ A double bottom is in the making, with a well-defined neckline at 3020
________________________________________
📌 Why the bullish bias remains valid:
• 2960-2970 proved to be a strong demand zone
• Price reclaimed the 3000 level after the dip
• Double bottom structure is forming = possible breakout ahead
• 3020 is the key level to break for continuation
________________________________________
🎯 Trading Plan:
The preferred strategy remains:
➡️ Buy the dips
🎯 Main target: 3080
❌ Invalidation: daily close below 2960
Disclosure: I am part of Trade Nation's Influencer program and receive a monthly fee for using their TradingView charts in my analyses and educational articles.
