XAUUSD Daily Trading Plan for April 3, 2025🧠 Smart Money Concepts x Fundamental Flow
Despite negative USD news (ADP & ISM) and Trump’s hawkish blurbs, Gold didn’t pop aggressively — it wicked up into premium supply, then quickly retraced. That’s a liquidity game, not a trend change (yet). Still bullish bias overall, but intraday looks mixed.
🧭 Bigger Picture – D1/H4
Price rejected strongly from the premium supply zone near 3144–3147, leaving a clear wick with imbalance underneath.
Bullish structure remains valid, but we're seeing a potential distribution pattern short-term.
Trendline liquidity & HLs are stacking up below, ideal for a grab.
🟩 Demand zones of interest:
3107–3115 (discount zone, strong reaction in prior sessions)
3086–3092 (last known rally base)
📌 Key Zones
🔵 Premium supply: 3144–3147
🟡 Buyside liquidity: 3147–3155
🟦 Sellside liquidity grab zone: 3107–3115
🟢 Strong demand: 3086–3092
🔴 Major liquidity draw: 3180 zone (untouched weekly magnet)
🧩 SCENARIO 1 – 🐂 “Power of Discount” Buy Setup
“When in doubt, hunt the imbalance out.”
Price dips toward 3115–3107, taps imbalance + OB, shows M5/MS shift
Confirmation + sniper long
TP1: 3142 (last high), TP2: 3180 if momentum kicks in
🎯 Confluences:
Discount OB zone + unfilled imbalance
Trendline tap + BOS + liquidity grab
Weak DXY context
🧩 SCENARIO 2 – 🐂 Trap, Swipe & Rally Buy
Deep sweep to 3086 zone
Reversal signs after stop hunt / equal low grab
Entry on CHoCH or breaker retest (M15 or M5)
TP1: 3140, TP2: 3180
💡 This is the “maximum pain = maximum profit” play.
🧩 SCENARIO 3 – 🐻 Premium Rejection Intraday Sell
“Supply hits, market flips.”
Price tests 3144–3147 again in early session
No BOS on M5, shows weakness (M5/M15 LH + CHoCH)
Sell into imbalance zones
TP1: 3127, TP2: 3110
⚠️ Only take this if we don’t break above 3147. Watch liquidity wicks!
🧩 SCENARIO 4 – 🐻 Fake Pump & Dump
Price spikes through PDH, into 3155–3160
Quick rejection (news-induced spike or algo trap)
Sell setup on lower TF reversal after liquidity sweep
TP to 3115 zone
🎭 A classic “grab & go” trap. Great RR but needs discipline.
📰 Macro Watch – April 3, 2025
Fed speakers are lining up — watch for dollar volatility 👀
China PMI during Asia could boost metals
DXY might stay weak → keep gold supported
Gold is at ATH regions = more manipulation + fakeouts!
Xauusdanalysis

Gold Market and the Impact of Trump’s Tariff PolicyGold prices hit a new all-time high as investors seek safe haven assets amid growing uncertainty in the global economy. After several rounds of market turmoil, investors have recovered somewhat in Asian markets this week. In the coming week, the focus will be on the reciprocal tariff plan that Trump will announce on April 2. If Trump decides to take tough measures and implement high tariffs across the board, it may have a big impact on the market. However, if there is some relaxation of tariff policies, such as tax exemptions for specific countries, then the market may have a chance to rebound.
Trump was proud of Wall Street's record highs during his first term, but now seems to be less concerned about the stock market and more focused on the adjustment of overall economic policies. I think this may be the time to make structural changes to the US economy, although these adjustments may bring challenges in the short term, but the hope is that the economy will recover before the mid-term elections next year.
In addition, Asian stock markets have also been affected by volatility, especially the automotive industries in Japan and South Korea are under pressure. The automotive manufacturing industries in these countries face the challenge of change due to the upcoming 25% tariffs. Investors are full of doubts about Trump's tariff policy, and market sentiment is cautious, and all parties are waiting for the policy announcement on April 2.
In short, although the market has rebounded in the short term, future trends still need to focus on Trump’s tariff decisions and their potential impact on the global economy.

Gold fluctuates sideways at a high level and seesaws!The 1-hour moving average of gold has gradually begun to show signs of turning around. The 1-hour moving average of gold is also a head and shoulders top pattern. Even if it pulls back and forth again, gold will continue to fluctuate in a large range. There will be more data in the second half of this week, and there will also be important event news. Therefore, gold still needs to wait for news or data to let gold go out in a new round of direction. Gold did not break through the intraday high, so our US market will continue to be high and empty.
Today's gold short-term operation ideas suggest that rebounding is the main focus, and callbacks are supplemented by longs. The upper short-term focus is on the first-line resistance of 3138-3140, and the lower short-term focus is on the 3100-3110 first-line support.
Short position strategy:
Strategy 1: Short 20% of the position in batches when gold rebounds to around 3138-3140, stop loss 6 points, target around 3120-3110, break to see 3100 line;
Long position strategy:
Strategy 2: Long 20% of the position in batches when gold pulls back to around 3100-3103, stop loss 6 points, target around 3110-3120, break to see 3130 line;

Gold suppresses the fall and shorts make big profitsYesterday, gold fell under pressure at 3150 and then tested the 3100 mark again in the evening, breaking the previous trend line that had been rising for several days. The market gradually slowed down from strong bullish trend, and the daily line turned negative.
Don’t expect the market to turn to bearish and fall sharply at this point. The long-short conversion needs time to brew, and now it is still a bullish trend, so the probability of forming a volatile trend here is relatively high, with a range of 3138-3100. Only when it breaks below 3100 can we see the market turning to bearish.
If the daily line is just a single negative correction, it will not change the overall upward trend. It depends on whether it can continue to close negative today.
If the European session suppresses the decline and weakens, then the third test of 3100 may break.
If the European session continues to strengthen and break through 3138, it will also hit the high point of 3148-3149

What impact will the implementation of gold tariffs have?As expected, gold fell below yesterday's low of 3124 support and came all the way to 3100. I have been emphasizing that gold will have a large retracement, but the current decline is far from enough and gold will continue to decline. The 1-hour moving average of gold has begun to turn downward, and gold may open up room for decline. The 1-hour gold moving average has now formed a head and shoulders top structure. The rebound will continue to be short. The market has weakened. Gold has tested the 3100 mark for the first time and has not yet broken it, but the direction of the market has turned short. If it does not break the first time, I believe there will be a second test in the future. Then the bearish situation has been finalized, and long positions have to be put aside for now, because it is a bearish market now. Gold can continue to be short after the rebound. Pay attention to the upper pressure level of 3128, and you can go short directly after it rebounds!
Today's short-term operation strategy for gold is to short on rebounds and long on pullbacks. The short-term focus on the upper side is the 3138-3130 line of resistance, and the short-term focus on the lower side is the 3100-3083 line of support.
Short position strategy:
Strategy 1: Short 20% of the gold position in batches when it rebounds to around 3128-3130, stop loss 6 points, target around 3110-3100, break to see 3085 line;
Long position strategy:
Strategy 2: Long 20% of the gold position in batches when it pulls back to around 3083-3085, stop loss 6 points, target around 3100-3110, break to see 3120 line;

Regional shocks, friends holding positions should pay attention!Technical analysis of gold: Gold first rose and then fell, but the subsequent rebound was indeed quite strong, exceeding our expectations. Gold fell into a large range of fluctuations, which added a certain degree of difficulty to the operation. Although gold rebounded beyond expectations, it still did not break through today's high point, so it is still under pressure in the range of the head and shoulders top pattern. At most, it is still a shock, and there is no need to think about whether it will rise sharply.
The 1-hour moving average of gold has gradually begun to show signs of turning, and the 1-hour gold is also a head and shoulders top pattern. Even if it is pulled back and forth again, gold will continue to fluctuate in a large range. There are more data in the second half of this week, and there are also important events. So gold still needs to wait for news or data to let gold go out of a new round of direction. If gold does not break through the intraday high, we will continue to focus on high altitude. Retracement is supplemented by long positions.
Gold operation strategy: short gold when it rebounds to 3130-3035, stop loss at 3140, target 3120-3110; long gold when it falls back to 3110-3100, target 3120-3130.
Trading discipline: 1. Don't blindly follow the trend: Don't be swayed by market sentiment and other people's opinions, operate according to your own operation plan. Market information is complicated and blindly following the trend can easily lead to the dilemma of chasing ups and downs.
2. In gold trading, we will continue to pay attention to news and technical changes, inform us in time if there are any changes, strictly implement trading strategies and trading disciplines, move forward steadily in the volatile market, and achieve stable asset appreciation.

Online real-time guidance on gold trendsGold went up in the early trading, but the price fell again after rising to 3135. The fluctuation range of European trading narrowed. ADP employment data exceeded expectations. The market failed to break out of the trend. The current market is in the range of 3135-3109. The market is waiting for the details of the reciprocal tariffs and industry-specific tariffs to be announced at 3 am. The tariff policy announced by Trump is expected to have an adverse impact on the global economy, especially the United States. The current structure of gold is still bullish. After the correction, continue to go long at the key support level.
At the 4-hour level, the current market is shrinking and oscillating at a high level. The K-line is running above the middle track, and the oscillating and strong trend is maintained above the middle track. Focus on the 3100 support break. Only when it breaks below 3100 will the downward space be opened. There can be more at 3080-3060 below, and only when it stands above 3135 can it further hit a new high. Before the data, continue to see range oscillation, the small range is 3110-3135, and the large range is 3100-3150. In the short term, you can quickly enter and exit in the small range with high altitude and low long.

Navigating the Range Ahead of Tariffs Announcement📢 News 📢
President Trump is set to announce new tariffs today, April 2, 2025, at 4 p.m. Eastern Time. This initiative, dubbed "Liberation Day," aims to boost U.S. manufacturing by targeting imports like autos, steel, and pharmaceuticals. 📦💊 However, economists warn that these measures could lead to higher consumer costs and disrupt trade relations. 📉💹
This news might influence market sentiment and could have implications for gold trading. Keep an eye on how the market reacts! 📈💰
📊XAUUSD 1H Analysis (Current Situation)
Market Structure:
The market is in a clear bullish trend with strong momentum from the previous sessions.
Recent price action shows consolidation near 3,132, suggesting a potential liquidity build-up.
There is a higher high formation, but rejection from the supply zone around 3,139 - 3,150.
Key Technical Zones & Confluences:
Supply Zone / Potential Sell Area:
3,139 - 3,150: If price reacts with strong rejections here, a potential short opportunity may emerge.
3,165 - 3,182: If price breaks above 3,150, this is the next key resistance area.
Demand Zone / Potential Buy Areas:
3,110 - Strong Rejection Zone: If price pulls back here and finds bullish confirmations (e.g., bullish engulfing, liquidity grab), a long entry could be valid.
3,092 - 3,075 Potential Buy Zone: A deeper retracement into this level could provide a sniper entry opportunity.
🔴 Sell Setup
Entry Zone: $3,133 - $3,135
SL: Above $3,138 (tight protection)
TP1: $3,128 (first reaction)
TP2: $3,117 (liquidity zone)
TP3: $3,103 (full move)
📌 Reasoning:
Mid-range premium pricing (not at extreme highs but still valid)
Multiple rejections in this zone (potential shift in order flow)
Possible short-term retrace before continuation
🔴 Sell Idea
Entry Zone: $3,145 - $3,150
SL: Above $3,153 (small wick safety)
TP1: $3,132 (reaction level)
TP2: $3,128 (stronger demand)
TP3: $3,117 (full imbalance fill)
📌 Reasoning:
Liquidity grab potential above $3,145
Imbalance & order block confluence
Possible rejection from premium supply
🟢 Buy idea
Entry Zone: $3,094 - $3,089
Stop Loss (SL): Below $3,085
Take Profit (TP) Levels:
TP1: $3,117
TP2: $3,128
TP3: $3,150
📌 Reasoning:
Unmitigated demand zone
Imbalance around $3,094 suggests a reaction
Strong liquidity pockets nearby
📌 Important Notice!!!
The above analysis is for educational purposes only and does not constitute financial advice. Always compare with your own plan and wait for confirmation before taking action.
Gold's trend has too many friendsThere’s a well-known saying in trading: “The trend is your friend.”
I firmly believe in this principle. However, when price movements become too extreme—too fast and too far—it’s wise to exercise caution, even if you’re not ready to take the opposite side of the trade.
And right now, I believe that’s exactly the case with Gold.
________________________________________
Why a Major Gold Correction is Likely
As I’ve been repeating like a broken record since Monday, Gold’s price is severely deviated from the mean, signaling that a brutal correction is on the horizon.
After reaching a new all-time high of 3,150, Gold retraced yesterday, dropping to 3,100—a support level formed earlier in the week. A rebound followed, but as I’ve explained in an educational article, this price action looks more like a stepwise distribution rather than true buying strength.
The key point?
➡️ Support isn’t holding because buyers are stepping in—it’s holding because big sellers have paused selling.
________________________________________
Still Bullish, But a Drop is Coming
There’s no doubt that Gold is in a strong uptrend. But even if it drops 1,000 pips, the overall bullish trend would still be intact.
Key Technical Signs of Weakness
📉 Trendline Break – Yesterday, Gold broke below the rising trendline, marking the first sign of weakness.
📉 Failed Rebound – Despite a short-term bounce, the price is now more likely confirming the break rather than invalidating it.
📉 Lower High in Progress? – The next minor support sits at 3,120. If Gold breaks below this level, we’ll have confirmation of a lower high, which strengthens the bearish case.
________________________________________
Targeting the Correction
If Gold breaks below 3,120, I expect a move below 3,100, targeting:
🎯 Soft target: 3,080
🎯 Likely target: 3,030 – 3,040
I believe it’s only a matter of time before this brutal correction plays out.
Let’s see how it unfolds! 🚀
Disclosure: I am part of Trade Nation's Influencer program and receive a monthly fee for using their TradingView charts in my analyses and educational articles.

XAUUSD Head & Shoulders Breakdown – Bearish Target Ahead?This chart represents a detailed technical analysis of Gold Spot (XAU/USD) on the 1-hour timeframe with a structured trade setup based on a Head and Shoulders (H&S) reversal pattern. Below is an in-depth explanation of the chart components, price action, and trade strategy.
1️⃣ Key Chart Patterns and Analysis
A. Head and Shoulders Pattern (Bearish Reversal)
This is a well-known bearish reversal pattern that signals a potential trend change from bullish to bearish. It consists of three peaks:
Left Shoulder: A rise followed by a temporary pullback.
Head: The highest peak in the pattern, showing strong buying pressure before reversal.
Right Shoulder: A smaller rise compared to the head, indicating weakening bullish momentum.
B. Neckline (Support Level) and Breakdown Confirmation
The neckline (horizontal support level) is drawn across the lowest points between the shoulders.
A break below the neckline confirms the reversal, triggering a bearish move.
The chart suggests price is at the neckline zone, preparing for a breakdown.
2️⃣ Trendline and Support/Resistance Analysis
A. Uptrend Trendline Break
The price was following a strong ascending trendline (dotted black line).
A trendline breakout has occurred, indicating potential trend reversal.
This supports the bearish bias further.
B. Resistance and Support Levels
Resistance Level: Marked at the top of the Head region, which aligns with previous price rejection zones.
Support Levels:
First support (TP1 - 3,053.269): This is the first potential take profit level.
Second support (TP2 - 3,030.556): The next target if price continues downward.
3️⃣ Trade Setup & Risk Management
A. Entry Point (Short Position)
Sell (Short) after the neckline breakout, ensuring bearish momentum is confirmed.
B. Take Profit (TP) Targets
TP1: 3,053.269 (Initial support target).
TP2: 3,030.556 (Stronger support zone, deeper profit target).
C. Stop Loss Placement
Stop Loss: 3,150.726 (Above the resistance zone).
This is a logical stop-loss placement, allowing price fluctuations without prematurely stopping the trade.
4️⃣ Overall Market Sentiment & Trade Bias
Bearish Bias: Due to the formation of the Head and Shoulders pattern, trendline breakout, and weakening bullish momentum.
Confirmation Needed: A strong bearish close below the neckline increases probability of downward continuation.
5️⃣ Final Thought – A High-Probability Trade Setup
If neckline breaks, the trade is valid with potential for a 3%+ downside move.
If price holds above the neckline, the pattern may fail, leading to reconsidering trade execution.
This structured risk-managed approach ensures a strategic entry, controlled risk, and maximized profit potential. 📉🔥 Let me know if you need further refinements! 🚀

XAUUSD:Short at highs primarily, long on pullbacks secondarilyThe 4-hour chart shows that the short-term moving averages of gold are converging, and the lower shadows of the K-lines appear frequently. The downward momentum is weakening, which may indicate a technical correction after a period of sideways consolidation, and there is a possibility of a second upward pull.
The hourly chart shows that the price range is narrowing, and the technical pattern is gradually being adjusted into place. Currently, the upper resistance levels are between 3137 and 3142, and the lower support levels are between 3111 and 3107.
In terms of trading operations, I suggests mainly taking short positions near the end of the trading session, with going long on the pullback as a secondary strategy.
XAUUSD Trading Strategy:
sell@3130-3135
TP:3120-3110
buy@3110-3115
TP:3125-3130
Get daily trading signals that ensure continuous profits! With an astonishing 90% accuracy rate, I'm the record - holder of an 800% monthly return. Click the link below the article to obtain accurate signals now!

Gold fooling us again!!Very interesting structure in the gold dollar!
There is complete indecision in the market.
It's right in the middle of two high liquidity zones.
Here's a brief outline of what I'm expecting.
Don't forget that patience always pays off.
Keep it simple!
If you liked it, don't forget to follow me!

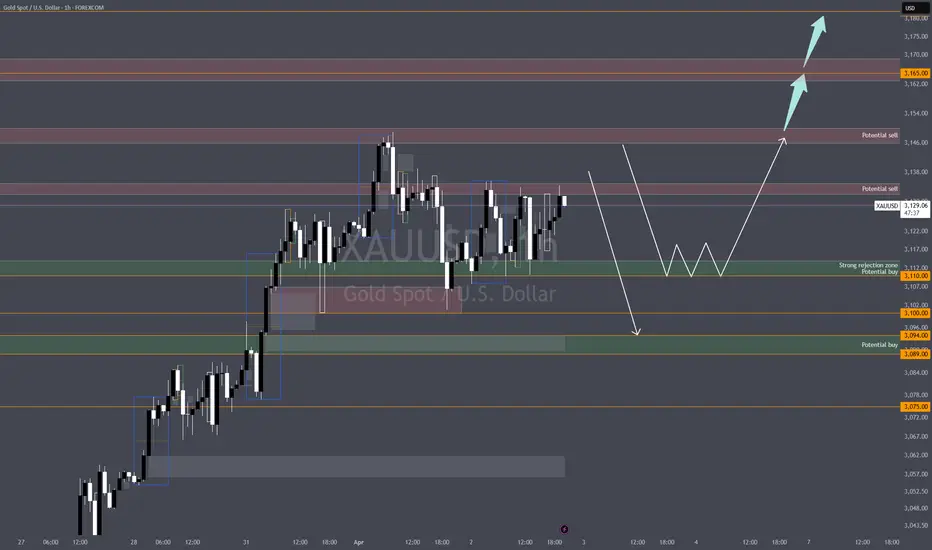
Gold (XAU/USD) Bullish Breakout: Next Target $3,181?"Key Observations:
Current Price: Gold is trading at $3,127.450 at the time of the chart.
Trend: The chart exhibits a strong uptrend, with higher highs and higher lows.
Support Levels: Several support levels are marked in the $3,010 - $2,999 range, extending down to around $2,906.
Resistance and Target:
The immediate price range is highlighted, suggesting possible consolidation.
A breakout above this range could lead to a target around $3,181.
Chart Annotations:
A retracement (red structure) indicates a short-term correction before continuation.
A breakout structure (black lines) suggests a previous significant upward movement.
The range and possible continuation are marked, indicating that the price may consolidate before attempting to reach the target.
Trading Perspective:
If price holds above the range, we may see bullish continuation towards $3,181.
A break below support levels could signal a deeper pullback towards $3,010 or lower.
This chart suggests a bullish outlook, with potential for more upside if momentum continues. Traders might look for confirmations before entering long positions.

Continue to short gold after the rebound!Although gold did not fall due to the negative impact of ADP data, this does not mean that the risk of gold falling has been eliminated. As long as gold does not break through the recent highs, and in the fluctuations in recent days, the resistance strength of the 3135-3145 zone has been strengthened, gold still has a considerable risk of falling before breaking through the resistance area, and once gold falls below the 3110-3100 zone, it is bound to retreat to the 3095-3085 zone!
The trading strategy verification accuracy rate is more than 90%; one step ahead, exclusive access to trading strategies and real-time trading settings

Gold market trend analysisGold risk aversion pushed up gold prices, but the bulls failed to continue, and gold prices fell after rising. From a technical perspective, the 4-hour gold price remained above the moving average, and the bullish trend remained unchanged. Structurally, the rise in gold prices was symmetrical in time and space, and the early decline was in line with expectations. The hourly chart showed a weak bearish signal and diverged. The upper resistance is currently at 3137-3141, and the lower support is at 3111-3106. In terms of operation, I suggest that the callback is mainly long, and the rebound is supplemented by high short.
Operation strategy 1: It is recommended to buy at 3105-3100, stop loss at 3092, and the target is 3130-3150.
Operation strategy 2: It is recommended to sell at 3139-3144, stop loss at 3150, and the target is 3120-3105.

Update XAUUSD Intraday Battle Plan"Gold never sleeps… but it might fake you out first!" 🤫
🟢 Buy Scenario 1 – “The Spring Trap” 💧
If price sweeps liquidity below 3107 zone (grab zone + FVG), be ready for a bounce.
Entry zone: 3100 – 3107
Confluences:
Valid FVG + Imbalance
Strong rejection already shown from this area
Trendline liquidity trap below
Buy-side OB forming (watch M15/M30 for confirmation)
SL: Below 3090
TP1: 3125
TP2: 3140
Note: A classic liquidity sweep to trap bears before a news-driven reversal? Don’t blink. 👀
🟢 Buy Scenario 2 – “The Bounce of Faith” 🧗
If price respects the trendline and discount zone without grabbing 3100.
Entry: 3112 – 3117
SL: 3106
TP1: 3135
TP2: 3147 – PDH
Confluences:
Equilibrium + strong bullish reaction from previous HL
CHoCH confirmed on LTF
Divergence on RSI (M15) might cook a sniper launch 🚀
🔴 Sell Scenario 1 – “The Fakeout Masterclass” 🎭
If price retests supply zone 3145–3150 and fails to break PDH (3148)
Entry zone: 3145 – 3150
SL: 3155
TP1: 3130
TP2: 3112
Confluences:
Weak high + premium zone
PDH liquidity magnet → sell-side grab potential
Bearish OB forming on M15
Reminder: Respect the zone—don’t marry the bias. 💍
🔴 Sell Scenario 2 – “The Trap Breaker” ⚔️
If ascending triangle fails & price nukes below 3110.
Entry: 3110–3105 (after CHoCH or BOS on LTF)
SL: 3117
TP1: 3096
TP2: 3086 (stronger OB zone)
Fuel: Momentum + stop hunt + potential shift from bullish to correctional structure
📢 News Watch – April 2, 2025
⚠️ ADP Non-Farm Employment Change (15:15 GMT+2)
Big mover, early warning before NFP. More jobs = bearish gold.
⚠️ ISM Services PMI (17:00 GMT+2)
High impact. Strong services = stronger USD → bearish for gold.
📌 Expect volatility spikes. Best entries = after liquidity grabs post-news.
🧨 Final Words
Be patient. Let price come to your zone. Set alerts. Don’t chase—trap it like a sniper. 🎯
💬 Drop a follow & smash that ❤️ if this plan made your day easier. Let’s ride the gold wave together 🌊⚡

What impact will the implementation of gold tariffs have?As expected, gold fell below yesterday's low of 3124 support and came all the way to 3100. I have been emphasizing that gold will have a large retracement, but the current decline is far from enough and gold will continue to decline. The 1-hour moving average of gold has begun to turn downward, and gold may open up room for decline. The 1-hour gold moving average has now formed a head and shoulders top structure. The rebound will continue to be short. The market has weakened. Gold has tested the 3100 mark for the first time and has not yet broken it, but the direction of the market has turned short. If it does not break the first time, I believe there will be a second test in the future. Then the bearish situation has been finalized, and long positions have to be put aside for now, because it is a bearish market now. Gold can continue to be short after the rebound. Pay attention to the upper pressure level of 3128, and you can go short directly after it rebounds!
Today's short-term operation strategy for gold is to short on rebounds and long on pullbacks. The short-term focus on the upper side is the 3138-3130 line of resistance, and the short-term focus on the lower side is the 3100-3083 line of support.
Short position strategy:
Strategy 1: Short 20% of the gold position in batches when it rebounds to around 3128-3130, stop loss 6 points, target around 3110-3100, break to see 3085 line;
Long position strategy:
Strategy 2: Long 20% of the gold position in batches when it pulls back to around 3083-3085, stop loss 6 points, target around 3100-3110, break to see 3120 line;

Gold is expected to strengthen further before non-farm payrollsIn today's short-term operation of gold, it is recommended to focus on longs on callbacks, supplemented by shorts on rebounds. The top short-term focus is on the first-line resistance of 3150-3160, and the bottom short-term focus is on the first-line support of 3110-3120. All friends must keep up with the rhythm.
Short position strategy:
Strategy 1: Short 20% of the gold position in batches when it rebounds to around 3150-3155, stop loss at 3162, target around 3135-3130, and look at the 3125 line if it breaks;
Long position strategy:
Strategy 2: Long 20% of the gold position in batches when it pulls back to around 3125-3128, stop loss at 3090, target around 3140-3150, and look at the 3155 line if it breaks;

Is gold accelerating towards its peak?Today, the European and American markets focus on the breakout of 3127-30. If the European market fails to break higher, then this point may become a short-term high point. It is best to go long when it falls back to around 3100-02. It is still possible to go short if it falls back to 3102 and then rebounds to 3125-27. Finally, I would like to advise retail investors that when the market fluctuates violently, if you cannot control yourself and go with the trend, then going short may be the best choice. It is better not to do it than to make a mistake! Watching more and doing less is also a suitable strategy.
In today's short-term operation of gold, it is recommended to focus on longs on callbacks, supplemented by shorts on rebounds. The top short-term focus is on the first-line resistance of 3128-3130, and the bottom short-term focus is on the first-line support of 3100-3097.

The bull's charge trumpet was successfully soundedFrom the 4-hour analysis, the support below is around 3100-06, with a focus on the support line of 3086-94 below, and the short-term pressure above is 3127-3130. Keep the main tone of participation in the idea of buying on pullbacks unchanged. In the middle position, watch more and do less, be cautious in chasing orders, and wait patiently for the shutdown point to enter the market.
Gold operation strategy:
1. Gold retreats to the 3100-3106 line for more, and retreats to the 3086-3094 line to cover more positions. The stop loss is 3079, and the target is the 3125-3130 line. If the position is broken, continue to hold;

Gold - Looking To Buy Dips In The Short TermH1 - Bullish trend pattern in the form of higher highs, higher lows structure
Strong bullish momentum
Expecting retraces and further continuation higher until the two Fibonacci support zones hold.
If you enjoy this idea, don’t forget to LIKE 👍, FOLLOW ✅, SHARE 🙌, and COMMENT ✍! Drop your thoughts and charts below to keep the discussion going. Your support helps keep this content free and reach more people! 🚀
--------------------------------------------------------------------------------------------------------------------
Disclosure: I am part of Trade Nation's Influencer program and receive a monthly fee for using their TradingView charts in my analysis.

Beware of gold tariff changes! Intraday Gold Trading Buckle UpGold news: In the early Asian session on Wednesday (April 2), spot gold fluctuated in a narrow range and is currently trading around $3114.90/ounce. Gold prices rose and fell on Tuesday. Spot gold rose to around the 3150 mark earlier, setting a new record high of $3148.85/ounce, but then fell back due to profit-taking, closing at $3114.03/ounce, down about 0.3%. US President Trump plans to announce comprehensive tariffs on countries with trade imbalances with the United States on April 2, which has spawned a large number of safe-haven buying, helping gold prices to continue to rise, but near the last moment, some bulls took profits in advance. Gold has always been seen as a hedge against geopolitical and economic uncertainties. On Monday, gold closed with its strongest quarterly performance since 1986 and broke through $3,100 per ounce, becoming one of the most significant gains in the history of precious metals.
Technical analysis of gold: Gold 4-hour chart retreated to the middle track and paused for a while. Today, the battle between the high point 3148 and the 4-hour middle track will be fought. Losing the middle track will further increase the adjustment space. On the contrary, holding the middle track to recover the high point will continue the slow rise. The market outlook will continue to cooperate with the slow rise method of one step back and one turn back. That is, the repeated high-exploration and fall method. From the 1-hour chart of gold, the rising volume at the end of the wave-shaped tail is usually not sustainable, accompanied by the one-step back and one-step wash-out method. After yesterday's retreat, today's early trading rose quickly, accompanied by a big negative line in the hourly chart to retrace and correct, and stepped back to the local high of 3150. The fluctuation base is large and the adjustment space can be large or small. It is not easy to chase high at the current position. Although shorting is against the trend, the implementation of overbought tariffs on the technical level will also be realized, and the room for adjustment cannot be underestimated. We should use ultra-short-term combined with medium and long-term short-term to respond to short-term adjustments. On the whole, today's short-term operation of gold recommends shorting mainly on rebounds, supplemented by longs on callbacks. The top short-term focus is on the first-line resistance of 3138-3140, and the bottom short-term focus is on the first-line support of 3100-3083. Friends, you must keep up with the rhythm. It is necessary to control the position and stop loss, set stop loss strictly, and do not resist the order operation. The specific points are mainly based on real-time intraday trading. Welcome to experience and exchange real-time market conditions. 🌐Follow real-time orders.
Gold operation strategy reference: Short order strategy: Strategy 1: Short stop loss of 6 points near 3136-3138 when gold rebounds, target around 3115-3100, break the position and look at 3085 line;
Long order strategy: Strategy 2: Go long when gold pulls back around 3105-3095, stop loss 6 points, target around 3120-3110, and look at the 3130 line if the position is broken;
Trading discipline: 1. Don’t follow the trend blindly: Don’t be swayed by market sentiment and other people’s opinions, and operate according to your own operation plan. The market information is complicated and complex, and blindly following the trend can easily lead to the dilemma of chasing ups and downs.
2. In gold trading, we will continue to pay attention to news and technical changes, notify you in time if there are any changes, strictly implement trading strategies and trading disciplines, move forward steadily in the volatile market, and achieve stable asset appreciation.

GOLD: May fall below 3100So far, gold has continued to fluctuate in the 3110-3136 range. Although the candle chart has many long lower shadows, the high point is moving down. If this trend is not broken, the probability of falling below 3100 today is very high, so when trading, everyone must be cautious. Personally, I suggest selling as the main method.
