XAUUSD Analysis todayHello traders, this is a complete multiple timeframe analysis of this pair. We see could find significant trading opportunities as per analysis upon price action confirmation we may take this trade. Smash the like button if you find value in this analysis and drop a comment if you have any questions or let me know which pair to cover in my next analysis.
Xauusdanalysis

XAUUSD:Sharing of the Trading Strategy for Next Week This week’s trading wrapped up successfully. Our exclusive VIP trading signals achieved a 90% accuracy rate!
On Friday during the U.S. trading session of the gold market, the Non-Farm Payrolls data was bearish for gold. We directly initiated a short position on gold at 3,260. Although gold rebounded subsequently, it was still prompted that as long as gold did not break through 3,280, a short position should be taken. Below this level remains the optimal price point for placing a short order. Next week, we will still mainly wait for a rebound to initiate short positions.
The signals in the Signature have brought about continuous profits, and accurate signals are shared every day. Hurry up and click to get them!
👇 👇 👇 Obtain signals👉👉👉

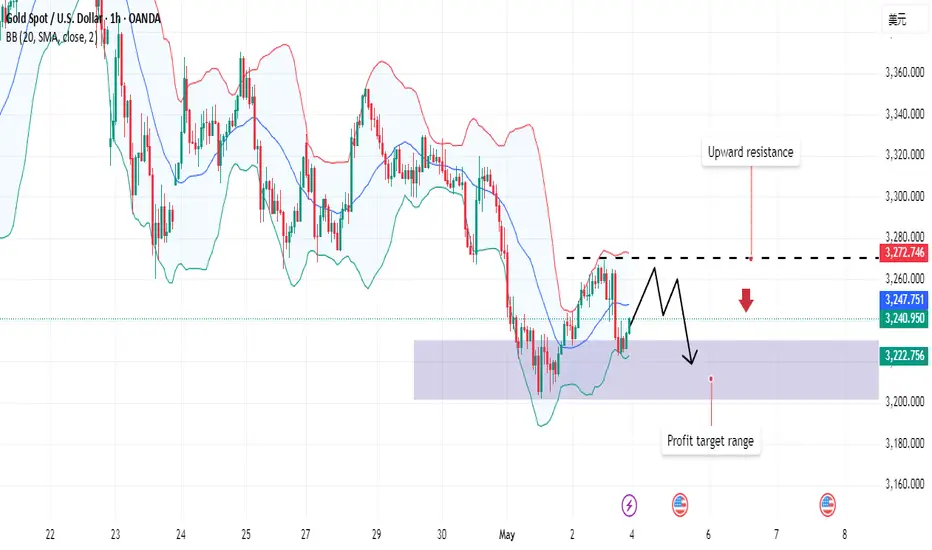
Gold fell as expected. What will happen next week?Gold fell within the range expected by Quid. Although it rebounded slightly, the final result did not change. Will the direction of gold change next week?
Quid's analysis:
Gold's 1-hour moving average is downward, and there is a trend of continuous downward development; gold is currently under pressure from the 3270 line, so 3270 will still be the key turning point for gold bears next week. Although gold has rebounded slightly, the magnitude of the decline is not large; if the upward resistance level of 3270 fails to break through next week, it may be in a sideways fluctuation.
The downward trend will not reverse for the time being, unless major news is released on the weekend, which directly affects the gold market.
Quid believes that the ups and downs of the market are normal. Gold has fallen by about $300 from its high point, and the overall trend in the near future is still downward; it continues to fall after a small rebound, which means that the strength of gold bears is still there.
Quide believes that it is always easy to follow its trend; violating its rules always makes oneself exhausted; the market is always right, and standing on the opposite side of the market will always be taught a lesson by the market. In the face of the overall trend, traders should not be lucky, and the market will not forgive your mistakes again and again.
Operation strategy:
Short around 3270, stop loss at 3280, take profit around 3220;
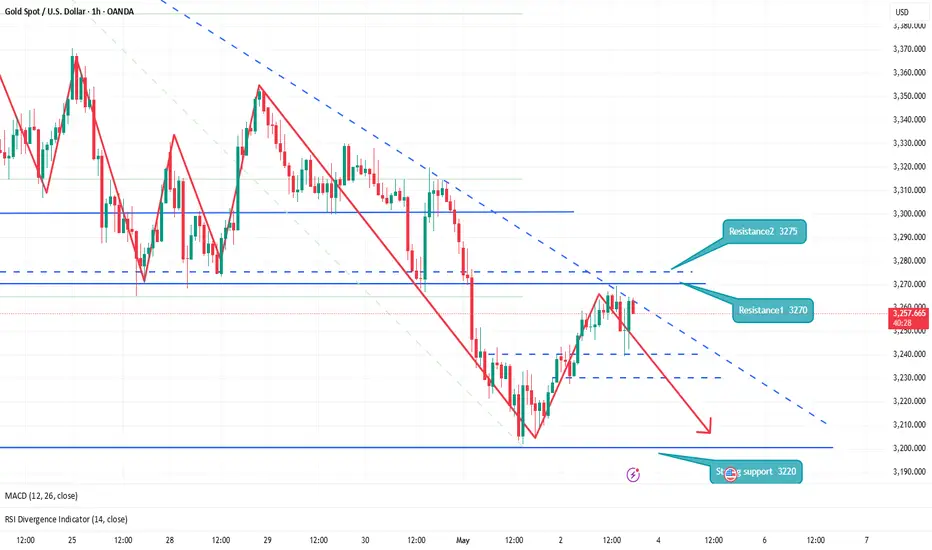
The latest gold strategy analysis and operation guidance📌Fundamentals:
This week, the US economic data was released intensively, and ADP employment, unemployment benefits, GDP and PCE price index were all bullish, but some data showed signs of weakness after Trump's tariff policy. The unemployment rate remained the same as the previous value of 4.2%, while the expected new employment of 130,000 was significantly lower than the previous value of 228,000. The market's concerns about the cooling of the economy provided support for the gold price.
📊Technical side:
Although the 1-hour moving average is still in a dead cross short arrangement, there are signs of turning around. At the same time, after the rebound, gold began to consolidate at a high level instead of continuing to fall, so the momentum of the bears was weakened. So today's closing is critical. Today, gold fell back to around 3230 under pressure from 3270. In the short term, this is a balance range. You can see the shock in this range at night. If gold finally closes above 3270, then gold will most likely continue to rise next week. If it closes below 3240, then gold bears still have a great chance. If you want to operate in the short term, then don't chase it for the time being. Since it is a shock, you can go short first at a high level. If it breaks through 3270, then wait until next week. On the whole, today's short-term operation of gold suggests that the rebound is mainly short, and the callback is supplemented by long. The top short-term focus is on the first-line resistance of 3265-3270, and the bottom short-term focus is on the first-line support of 3200-3197.
🎯Practical strategies:
Strategy 1: Go short when gold rebounds around 3263-3266, with a target around 3230-3210.
Strategy 2: Go long when gold pulls back around 3197-3200, with a target around 3220-3230.

The non - farm payrolls data has "disrupted" the gold market.This week’s trading wrapped up successfully. Our exclusive VIP trading signals achieved a 95% accuracy rate!
After the release of the non-farm payrolls data last night, the gold price dropped as expected, but then it quickly bottomed out and rebounded, continuing to maintain a volatile trend. Recently, the impact of the non-farm payrolls data on the gold market seems to be gradually weakening, and its fluctuation range is even smaller than usual. In the 1-hour chart of gold, the moving averages formed a bearish arrangement with a death cross pointing downward, and they eventually continued to diverge downward. Currently, gold is under pressure and has pulled back under the suppression at the level of 3,270. Therefore, the area around 3,270 will still be a crucial turning point between the bulls and bears of gold next week. Although there was a rebound in the late night for gold, in fact, the extent of the rebound was not significant compared with the decline. If gold fails to break through the pressure at 3,270 next week, at most, it will just be in a range-bound situation, and the bullish trend of gold will not reverse easily for the time being.
Trading Strategy:
Sell@3260-3270
TP:3230-3240
If your current gold trading performance is not satisfactory and you hope to avoid detours in your investment, you are welcome to communicate and exchange ideas with us!

As expected, gold prices continue to fall
📌 Gold driving factors
There are two aspects to look at the impact of April non-agricultural data on the gold market.
One is the data itself and the existing economic environment, and the other is combined with the technical aspect.
The market itself is troubled by the tariff issue. Whether it is the US stock market or the US dollar, they all need good economic data to boost. Once the April non-agricultural performance is poor, the market sell-off will be out of control, and it also means that the risk of US economic recession will increase.
Secondly, good data performance reduces the Fed's expectations for rate cuts. As we all know, the Fed's expectations for rate cuts or implementation of rate cuts are theoretically good for gold prices, and vice versa.
The cooling of the tariff issue may come soon, which is also not conducive to the rise in gold prices, but cooling does not mean the end, and the final achievement will definitely take some time.
📊Comment Analysis
Recently, we have been very good at controlling the gold market. Keeping an eye on the changes in fundamental news is the focus of research and judgment. Of course, the technical direction is also of reference value. The next market will revolve around fundamental news, especially in the context of tariffs.
The non-agricultural data exceeded expectations, and the tariff issue may see "dawn". If it can be confirmed in the near future, the risk aversion sentiment will subside in the short term, which is not conducive to the rise of gold prices. There is a high probability that there is room for retracement, so there is no rush to chase now.
💰Strategy Package
Operation ideas for next week:
Gold 3265 short, stop loss 3275, target 3230-3220;.
⭐️ Note: Labaron hopes that traders can properly manage their funds
- Choose the number of lots that matches your funds
- Profit is 4-7% of the capital account
- Stop loss is 1-3% of the capital account

XAUUSD BuyHello traders!
There’s an ideal buying opportunity on XAUUSD right now. I’ve activated a Buy position to take advantage of this setup.
The TP target is **3262.58** and the SL level is **3242.65**.
Make sure to adjust your lot size and risk according to your trading plan, and enter the trade with discipline.
🔔 I post detailed trade ideas and daily market analysis like this every day on my TradingView profile.
👉 Follow me to get notified and read the full breakdowns.

Will the Fed or Trade Talks Move the Needle?🔎 GOLD WEEKLY SETUP – Will the Fed or Trade Talks Move the Needle?
As we head into a pivotal week, gold finds itself boxed between macro pressures and structural indecision. After bouncing between 3,204 and 3,277 last week, all eyes are now on what could be the two biggest catalysts in months: the FOMC decision and renewed trade signals from Washington and Beijing.
🧭 The Bigger Picture
🇨🇳 China’s surprise SGX:40B tariff waiver suggests de-escalation and improving sentiment.
🇺🇸 US Nonfarm Payrolls came in stronger than expected — adding to hawkish Fed pressure.
💵 DXY & Bond Yields remain strong. As long as the USD holds above 105, upside for gold may remain limited.
🔔 This Week’s Macro Triggers
📆 FOMC Meeting & Powell’s Press Conference
➤ A dovish shift = bullish for gold
➤ Status quo or hawkish tone = room for further downside
📉 US–China Trade Headlines
➤ Continued easing = bearish pressure on gold
➤ New tensions = potential safe-haven bid
📊 Technical Landscape (H4/D1 Chart Focus)
Price action is forming a clear descending wedge, with major support still intact around the 3,204 – 3,224 zone. Previous highs at 3,277 capped last week’s rally and now act as the first barrier to reclaim.
We’re likely to see breakout potential increase mid-week as volatility kicks in post-FOMC.
🎯 Trade Plan – Week of May 6th
🔵 BUY ZONE A:
Entry: 3,204 – 3,202
SL: 3,198
TPs: 3,208 → 3,212 → 3,216 → 3,220 → 3,225 → 3,230
🔴 SELL ZONE:
Entry: 3,276 – 3,278
SL: 3,282
TPs: 3,272 → 3,268 → 3,264 → 3,260 → 3,250 → 3,240
⚠️ Risk Watchlist
🏛 Fed’s tone on rates
📉 DXY approaching 106.5
🌍 Surprise geopolitical or tariff-related news
🧠 Final Thoughts:
This is not a week to predict.
It’s a week to respond.
Gold is coiling. Structure is clear.
Discipline over bias — wait for confirmation, execute with precision.
📌 Follow for midweek intraday updates and real-time FOMC response plans.

Summary of the Gold Market This WeekThis week, the gold market showed a clear downward trend, with spot gold accumulating a 2.43% decline.👉👉👉
The economic data had a significant impact on the gold market this week. Data released by the US Department of Labor on the 2nd showed that the non - farm payroll employment in the US increased by 177,000 in April, much better than the expected 138,000, and the growth data for the previous two months were revised downwards. The US unemployment rate was 4.2% in April, in line with market expectations. The strong non - farm payroll data reduced the possibility of the Federal Reserve cutting interest rates in June. Under normal circumstances, the reduction in the interest rate hike expectation should be bullish for gold. However, the gold market did not rise sharply this time, mainly because the gold price had risen significantly in the early stage and the long - term investors had a strong sentiment of taking profits. At the same time, the relatively good employment data also reflected the resilience of the US economy to a certain extent, weakening the appeal of gold as a safe - haven asset. As a result, the gold price did not show an obvious upward trend immediately after the data was released. Instead, it remained volatile in the short term.
From a technical perspective, although the gold price has declined this week, the futures price still has certain technical advantages in the near term. On the daily chart, although a negative candlestick was recorded this week, the previous upward trend has made the moving average system still show a long - term arrangement. From the perspective of the RSI, the current value is hovering around 50, indicating that the market's long and short forces are temporarily relatively balanced, and neither side has an obvious advantage. Therefore, the gold price has entered a consolidation stage.
With the economic development in Asia and the changes in consumers' demand for gold investment and jewelry, Asia's influence in the global gold market has become increasingly prominent. If the demand in Asia remains strong in the future, it will provide strong support for the gold price. On the contrary, if the demand weakens, it may increase the downward pressure on the gold price.
Looking ahead to next week, the gold market still faces many uncertainties. On the one hand, the continuous changes in economic data and the direction of the Federal Reserve's monetary policy remain key factors. If the subsequently released data continue to show the resilience of the US economy, it may further reduce the market's expectation of a rate cut by the Federal Reserve, thereby suppressing the gold price. On the other hand, any new development in the international trade situation may trigger fluctuations in the market's risk - averse sentiment, thus affecting the supply - demand relationship and price trend of gold.

GOLD D1 Chart Update For Shorter Term TradingRead all levels mentioned in chart carefully as we have 2 directions
Right now GOLD standing at turning point
GOLD remains in BUY trend as long as stays above 2900-3000 Zone

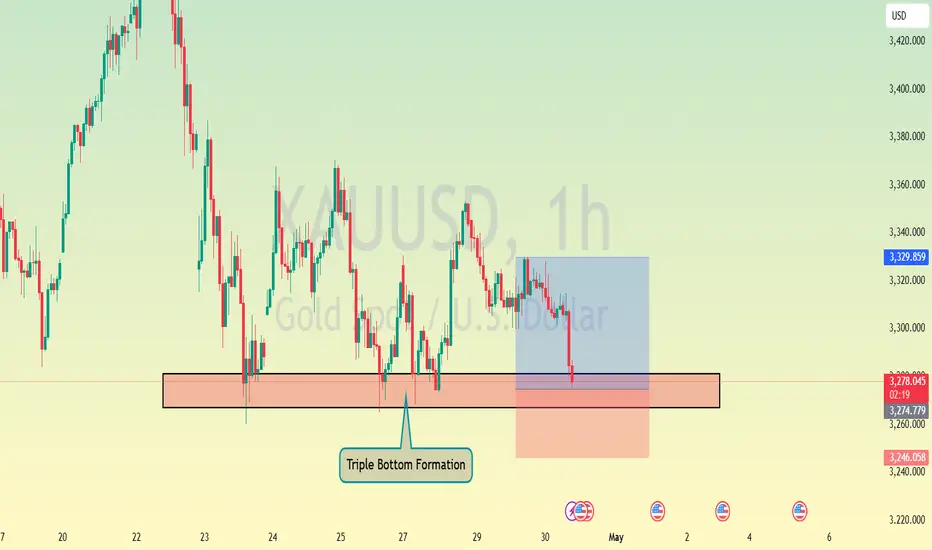
Gold's Symmetrical Triangle Near Break – Support Test Imminent!Gold ( OANDA:XAUUSD ) moved as I expected in my previous post and attacked the Support zone($3,282-$3,245) and Support lines for the second time . The question is, can Gold break the Support zone($3,282-$3,245) and Support lines or not!?
Please stay with me .
Gold is moving between Support zone($3,282-$3,245) and Resistance zone($3,386-$3,357) again . In fact, it can be said that Gold has been moving in a range for the past 5-6 days .
From a Classical Technical Analysis perspective, Gold appears to be forming a Symmetrical Triangle Pattern. A break of either line could indicate the next direction for Gold, but since the Symmetrical Triangle Pattern is a Continuation Pattern , the lower line is more likely to break .
In terms of Elliott Wave Theory analysis , it seems that we still have to wait for the next five downwaves .
------------------------------------------
Today, important U.S. data — JOLTS Job Openings and CB Consumer Confidence — will be released.
Let’s quickly review their potential impact on Gold:
JOLTS Job Openings :
If the number comes lower than expected , it signals a weakening labor market, increasing the chances of a dovish Fed → Bullish for Gold .
If the number is stronger than expected , it indicates a robust labor market, pushing the Fed to stay hawkish → Bearish for Gold .
CB Consumer Confidence :
A drop in consumer confidence reflects economic worries , driving demand for safe-haven assets like Gold → Bullish .
A rise in consumer confidence shows economic strength, reducing the appeal of Gold → Bearish .
Historical Impact :
Both indices have caused strong intraday moves in Gold recently, especially if the figures surprise the market.
Summary :
Weak JOLTS and low Confidence → Gold bullish
Strong JOLTS and high Confidence → Gold bearish
Be prepared for high volatility during the releases. Always manage your risk carefully!
------------------------------------------
I expect Gold to attack the Support zone($3,282-$3,245) and Support lines for at least the third time , and if it breaks, the next target could be $3,223 .
Note: If Gold can move above $3,393, we can expect more pumps and maybe make a new All-Time High(ATH).
Gold Analyze ( XAUUSD ), 1-hour time frame.
Be sure to follow the updated ideas.
Do not forget to put a Stop loss for your positions (For every position you want to open).
Please follow your strategy; this is just my idea, and I will gladly see your ideas in this post.
Please do not forget the ✅' like '✅ button 🙏😊 & Share it with your friends; thanks, and Trade safe.

Gold trend layout in the evening after the release of NFP data🗞News side:
1. Pay attention to the recent trade situation and news about the Fed's interest rate cuts
2. Be wary of DXY trends
3. The situation of the Russian-Ukrainian war and the follow-up events of the India-Pakistan conflict
📈Technical aspects:
The short orders in hand have already been profitable, and gold is now back near 3250, while the US dollar index has once again fallen by 100, reaching around 99.6, and the 1H moving average is currently showing signs of turning upward. The upper and lower shadow lines of the 1H K-line closing look like cross stars of equal length, which means that things may go wrong, and gold may rebound upwards in the short term. We can still focus on the resistance of 3260-3270 above, and further focus on the first-line resistance of 3280-3286, while the bottom has never been able to effectively break through the first-line support of 3240. If this week closes at 3240, then the market outlook next week will be conducive to long trading.
Intraday operation suggestions
🎁SELL 3260-3270
🎁TP 3245-3240
🎁BUY 3230-3240
🎁TP 3260-3270
If you agree with this point of view, or you have a better idea, please leave a message in the comment area. I look forward to hearing different voices.
OANDA:XAUUSD FX:XAUUSD FXOPEN:XAUUSD FOREXCOM:XAUUSD TVC:GOLD
The decisive battle day of major data (XAUUSD/GOLD)
Yesterday, it was clearly pointed out that the pressure position after the rebound is 3255-3270. Today, due to the oversold influence of XAUUSD, it rebounded to a high of 3258. In terms of operation, it is still mainly chosen to sell. Today is the "third day" deadline. If the impact of geopolitics continues to be suspended. It is expected that XAUUSD will fall by $100/ounce today.
There have been some oversold rebounds in the Asian market XAUUSD. Beware of the market's inducement to buy more. So 3260-3270 continues to be mainly sold.
TP1 3230-3220.
TP2 3170-3160

Non-farm payrolls may bottom out and rebound!Today's opening continued to rebound and rise, and the daily line has gone through three consecutive negative lines. Today is the fourth day of the probability of correction, and the decline is bound to be not as large as yesterday. Therefore, the position of choosing a short position cannot be too low, because it is not extremely weak. The Asian session rebounded and corrected. In the afternoon, you can switch to a short position around 3260. The support below is 3230-3227!
For the big non-agricultural data in the evening, according to the ADP data on Wednesday, it is likely to be bullish for gold. Under the influence of the tariff war, the employment data may not be too good, and the economic situation will only get worse. There is no doubt about this. Comprehensive analysis, I think the probability of the big non-agricultural data and unemployment rate in the evening is relatively high. Therefore, shorting is limited to intraday, and the focus in the evening is on the bottoming out and rebounding cycles.

XAU/USD (Gold) Analysis 2/5/20251. XAU/USD recently recorded an all-time high (ATH) at the 3150 level.
2. Following a healthy retracement, we are now eyeing potential long opportunities near the 3100 zone.
3. The 3100 level presents a favorable risk-reward entry point, aligned with historical support.
4. Market sentiment remains bullish, supported by strong fundamentals and ongoing geopolitical tensions.
5. A breakout above the previous ATH could open the door for a continued rally toward higher resistance levels.
6. Our upside targets for this move are in the range of 3450 to 3500, offering considerable profit potential.
7. Price consolidation near 3100 indicates accumulation, reinforcing the long bias.
8. We anticipate renewed buying pressure as the market tests key psychological and technical levels.
9. Risk management will be crucial, with stops ideally placed just below the 3050 support region.
10. Overall, this setup offers a compelling long trade backed by technical structure and market momentum.

Non-agriculture ended perfectly, Today’s closing is key!📌Fundamentals:
The US April non-farm payrolls data (177,000 new jobs) exceeded expectations, reinforcing the Fed's expectations of a smaller rate cut. The market's expectations for rate cuts this year have been lowered from 90 basis points to 85 basis points, and the strengthening of the US dollar has suppressed gold prices.
📊Technical aspects:
From the 4-hour analysis, gold fell after the negative news of non-farm payrolls today, but gold bottomed out and rebounded, and continued to fluctuate. It feels that non-farm payrolls have gradually lost its charm, and the market is not as good as usual. However, today's closing is very critical, and it is also the key to whether gold will turn around. The non-farm payrolls market has basically finished, and the upper side continues to pay attention to the suppression of 3260-68, focusing on the suppression of 3290-95 above, and the short-term support near 3235-3240 below.
🎯Practical strategies:
1. Go short when gold rebounds at 3260-65, cover short positions at 3378-85, and target 3240-3245.

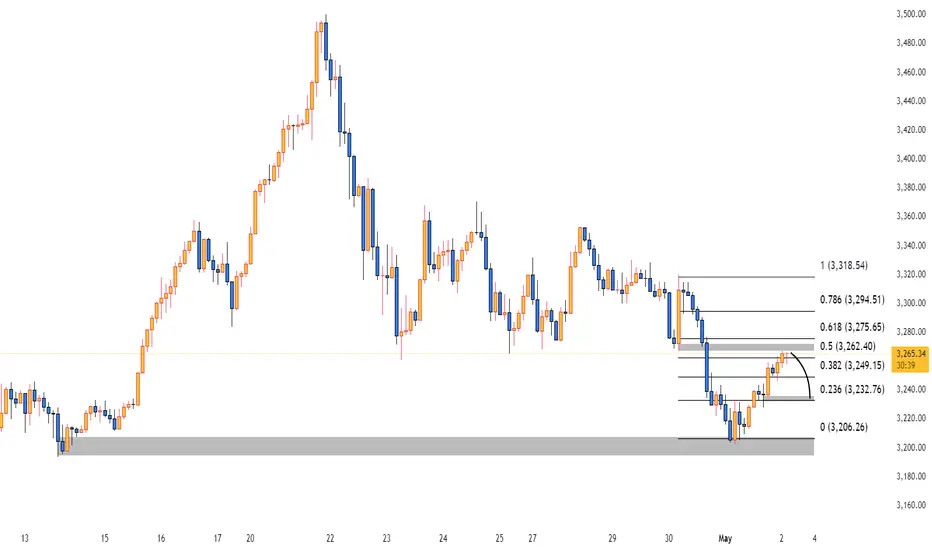
XAUUSD Analysis🟡 XAUUSD Analysis – May 2, 2025
Chart Overview:
Price is reacting near the 0.5–0.618 Fibonacci retracement zone (~3262–3275), a key supply area.
A bearish rejection candle is forming at 3264.51, showing resistance.
The projection curve on the chart suggests a potential pullback to the 0.236 (3232.76) or even 0 (3206.26) level.
🧠 Fundamental Catalyst (Today’s NFP):
If the NFP comes out weak (138K or lower) as expected:
USD may weaken → gold could break above 3275 and aim for 3294 or higher.
If NFP beats expectations significantly (e.g., above 200K):
Strong USD → This bearish setup could play out → Gold may drop toward 3232 or 3206.
📉 Signal (Short-term idea):
Bias: Bearish below 3275
Entry: Sell near 3265–3275 (supply zone)
TP1: 3232
TP2: 3206
Gold non-farm data fell into volatility!After the negative news of non-agricultural data today, gold fell as expected, but it bottomed out and rebounded, and continued to fluctuate. Although the 1-hour moving average is still in a dead cross short arrangement, there are signs of turning around. At the same time, after the rebound of gold, it began to consolidate at a high level instead of continuing to fall, so the momentum of the bears was weakened. Therefore, the closing is very critical. Gold fell back to around 3240 under pressure from 3270. In the short term, this is a balance range. You can look at the fluctuations in this range. If gold finally closes above 3270, then gold will most likely continue to rise next week. If it closes below 3240, then there is still a great opportunity for gold bears. If you want to operate in the short term, don't chase it for the time being. Since it is a shock, you can go short at a high level first. If it breaks through 3270, on the whole, it is recommended to go short on rebounds as the main operation strategy, and go long on callbacks as the auxiliary. The short-term focus on the upper short-term resistance of 3265-3270, and the short-term focus on the lower short-term support of 3200-3197.

5/2 Gold Trading SignalsI'm very sorry that today's update is a little late because I'm traveling during the holiday. However, I have already told you about the trading strategy yesterday. The market changes are still in line with our expectations. Following the signal of selling in the 3260-3280 range, the returns should be good.
Gold is now falling back. There is support near 3200, but the bears are strong at present, so it is still mainly selling. This decline is expected to fall below 3200, but because of the support, the possibility of a direct break is not very high. If it falls directly, there will definitely be at least one small rebound, roughly around 3210.
So the transaction can be carried out like this:
Buy in the 3194-3185 range
Sell in the 3246-3258 range

Range-bound volatility. Sell high and buy low.After the data release, the market reacted swiftly but in different directions. The US dollar index was indecisive after the data release. Although it briefly touched 100.0418, it then retreated to 99.9507, with a daily decline of 0.23%, failing to continue its previous strength. Spot gold dropped about $9 to $3,250 per ounce within one minute after the data release, but then rebounded to $3,255 per ounce with a daily increase of 0.56%. The short - term resistance levels of $3,260 and $3,265 have become the focus of attention. Overall, the better - than - expected performance of the April non - farm payrolls data has injected short - term confidence into the market. However, the revision of historical data and external uncertainties still make investors vigilant. In the short term, there may still be room for risk - assets to rise, but in the medium to long term, the downside risks are building up.
Trading Strategy:
buy@3225-3240
TP:3275-3290
If your current gold trading performance is not satisfactory and you hope to avoid detours in your investment, you are welcome to communicate and exchange ideas with us!

The Gold is in the Selling DirectionHello Traders
In This Chart GOLD HOURLY Forex Forecast By FOREX PLANET
today Gold analysis 👆
🟢This Chart includes_ (GOLD market update)
🟢What is The Next Opportunity on GOLD Market
🟢how to Enter to the Valid Entry With Assurance Profit
This CHART is For Trader's that Want to Improve Their Technical Analysis Skills and Their Trading By Understanding How To Analyze The Market Using Multiple Timeframes and Understanding The Bigger Picture on the Charts

Gold is in the bullish direction after correcting the supportHello Traders
In This Chart GOLD HOURLY Forex Forecast By FOREX PLANET
today Gold analysis 👆
🟢This Chart includes_ (GOLD market update)
🟢What is The Next Opportunity on GOLD Market
🟢how to Enter to the Valid Entry With Assurance Profit
This CHART is For Trader's that Want to Improve Their Technical Analysis Skills and Their Trading By Understanding How To Analyze The Market Using Multiple Timeframes and Understanding The Bigger Picture on the Charts
Gold is in the Bearish DirectionHello Traders
In This Chart GOLD HOURLY Forex Forecast By FOREX PLANET
today Gold analysis 👆
🟢This Chart includes_ (GOLD market update)
🟢What is The Next Opportunity on GOLD Market
🟢how to Enter to the Valid Entry With Assurance Profit
This CHART is For Trader's that Want to Improve Their Technical Analysis Skills and Their Trading By Understanding How To Analyze The Market Using Multiple Timeframes and Understanding The Bigger Picture on the Charts
