XAU/USD 30 April 2025 Intraday AnalysisH4 Analysis:
-> Swing: Bullish.
-> Internal: Bullish.
Analysis and bias remains the same as analysis dated 23 April 2025
Price has now printed a bearish CHoCH according to my analysis yesterday.
Price is now trading within an established internal range.
Intraday Expectation:
Price to trade down to either discount of internal 50% EQ, or H4 demand zone before targeting weak internal high priced at 3,500.200.
Note:
With the Federal Reserve's dovish stance and persisting geopolitical uncertainties, heightened volatility in Gold is expected to continue. Traders should proceed with caution and adjust risk management strategies in this high-volatility environment.
Price could also be driven by President Trump's policies, geopolitical moves and economic decisions which are sparking uncertainty.
H4 Chart:
M15 Analysis:
-> Swing: Bullish.
-> Internal: Bearish.
Analysis and Bias remains the same as analysis dated 24 April 2025.
Price printed as per my note yesterday whereby I mentioned that we should be surprised if price printed a bearish iBOS as all HTF's require a pullback.
Price subsequently printed a bearish iBOS which confirms internal structure.
Intraday Expectation:
Price has traded up to just short of premium of internal 50% EQ where we are seeing a reaction. Price could potentially trade further into premium of 50%, or H4/M15 nested supply zone before targeting weak internal low priced at 3,260.190.
Note:
With the Federal Reserve maintaining a dovish stance and ongoing geopolitical tensions, volatility in Gold prices is expected to remain elevated. Traders should exercise caution, adjust risk management strategies, and stay prepared for potential price whipsaws in this high-volatility environment.
Trump's tariff announcement will most likely cause considerably increased volatility and whipsaws.
M15 Chart:
Xauusdanalysis

4/30 Gold Trading SignalsGold showed limited movement yesterday and did not enter either of our predefined major trading zones, leading to minimal profits.
As of now, the price continues to consolidate. A larger movement is likely to occur during the U.S. session following key economic data.
Until then, consider short-term range trading between 3330-3290.
📌 Why Today’s Data Matters
Gold has been trapped in a tight range for several sessions, and a directional breakout is imminent.
Today’s data release will likely dictate that direction, so it is crucial to stay alert.
✅ Data-Driven Strategy:
If data is bullish (gold rallies):
Avoid chasing the initial breakout. Wait for the first spike to settle, then short the retracement, with a TP of less than $10.
If bulls remain strong, the retracement should stay under $20. Once short positions are closed, watch for confirmation to go long.
If data is bearish (gold drops):
If price doesn't reach the lower buy zones(3258-3223), wait for a minor rebound to short, targeting the next leg lower.
📌 Today's Suggested Trade Zones:
🔻 Sell Zones:
3378–3418
3330–3358
🔺 Buy Zones:
3258–3223
3110–3330 (ladder entries)

Gold insights: 30-APRIL-2025Rise and shine, traders! Start your day with actionable Gold insights. Let's grow your skills together, one chart at a time.

Gold in Focus: Tight Range Before Major US Data 🌐 Gold in Focus: Tight Range Before Major US Data – Time to Prepare for the Storm?
Gold (XAU/USD) is currently trapped within a narrow consolidation zone, with traders across global markets awaiting critical economic events in the second half of this week. The bounce from the 3290–3270 support zones confirms strong buying interest, yet bulls seem cautious ahead of the ADP employment report today and the all-important Nonfarm Payrolls (NFP) on Friday.
Despite dovish signs from recent labor data and declining US bond yields, gold has not been able to regain strong upward momentum. This hesitance is attributed to mixed market sentiment fueled by ongoing US-China trade negotiations, potential interest rate outlook shifts from the Fed, and end-of-month positioning across major asset classes.
💼 What’s happening behind the scenes?
US 10Y yields dropped, signaling weaker inflation outlooks — usually bullish for gold.
DXY remains fragile but still attracts safe-haven inflows amid global political tensions.
Investors are cautious ahead of back-to-back economic events and might delay large trades until Friday.
With a bank holiday looming in Asia and Europe tomorrow, liquidity could tighten and amplify volatility. Gold might continue trading in a compressed range between 3274–3357 until NFP injects a fresh directional impulse.
🔍 Technical Roadmap:
🔺 Resistance Levels to Monitor:
3328
3336
3352
3357
3366
🔻 Support Levels to Watch:
3305
3292
3274
📌 Trade Strategy (30m–1H timeframe bias)
🔵 BUY ZONE A
📍 Entry: 3292 – 3290
🎯 SL: 3287
🎯 TP: 3295 → 3300 → 3304 → 3308 → 3315 → 3320
🔵 BUY ZONE B
📍 Entry: 3275 – 3273
🎯 SL: 3268
🎯 TP: 3280 → 3284 → 3286 → 3290 → 3300
🔴 SELL ZONE A
📍 Entry: 3350 – 3352
🎯 SL: 3356
🎯 TP: 3345 → 3340 → 3336 → 3332 → 3320
🔴 SELL ZONE B
📍 Entry: 3365 – 3367
🎯 SL: 3371
🎯 TP: 3361 → 3357 → 3352 → 3347 → 3340
📣 Final Thoughts:
We are in the "calm before the storm" phase. Price is coiling in tight ranges with declining volume and momentum. Today's ADP report could trigger intraday volatility, but major players may still remain on the sidelines until Friday's NFP.
As it’s also the last day of the month, be alert for liquidity grabs and potential stop hunts. Stick to your risk management plan and avoid revenge trades in volatile setups.
🛡️ Stay patient. Trade smart. Let the market reveal the direction.

Gold is still on a volatile downward trendGold continues to fluctuate in the 1-hour chart, and the amplitude of fluctuations is beginning to narrow, which indicates that a change is getting closer. As for gold's current fluctuations, it is still in a downward trend.
Trading idea: short gold near 3318, stop loss 3330, target 3300

Gold price up or down?Gold has been fluctuating at the bottom in recent days. The large range is obviously 3260-3370, and the small range changes every day. On Tuesday, it was 3352-3300. The overall trend was first falling and then rising, but the decline was stronger than the rise. For the time being, gold is still weak. On the upside, pay attention to the break of 3370. If 3370 breaks, look at 3420-3500. The operation idea remains unchanged. Today, we still look for low points to go long. The support below the small cycle is around 3300-3280. These two supports are necessary points for going long today.

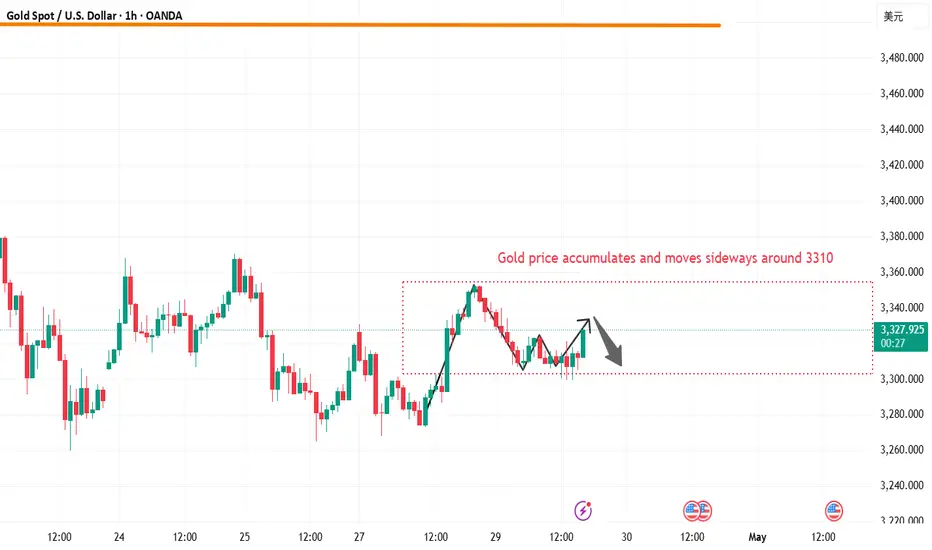
XAU/USD: Accumulating Strength and Awaiting a BreakthroughFrom the perspective of intraday trading rhythm, gold has continued its recent pattern. It rose sharply in the morning and then declined, fluctuated during the European trading session, and stabilized and surged during the US trading session. Based on this rhythm, today we can mainly focus on the effectiveness of the support level at $3,300. If this support level can still hold after the fluctuations in the European trading session and the price stabilizes at this level during the US trading session, one can consider going long on dips. As the consolidation period continues to lengthen and the trading range keeps shrinking, it indicates that the market is about to break the current volatile pattern. After the impact of Trump's tariff policies gradually fades away, the market is re-pricing gold, and it is inevitable that the trend will be erratic during this process.
Regarding the subsequent trend, we should focus on how gold tests the resistance levels above. Once it breaks through $3,330 and even further breaks through $3,352, it will signal that the bottom structure is becoming more stable. The current repeated fluctuations are actually about constructing a new upward support platform, laying a solid foundation for the subsequent upward trend.
Overall, there is no need to be overly concerned about the short-term fluctuations, as the overall upward rhythm of gold has not changed. Investors can closely monitor the breakthrough of key levels and seize trading opportunities.
XAUUSD
buy@3290-3300-3310
tp:3300-3340-3350
I am committed to sharing trading signals every day. Among them, real-time signals will be flexibly pushed according to market dynamics. All the signals sent out last week accurately matched the market trends, helping numerous traders achieve substantial profits. Regardless of your previous investment performance, I believe that with the support of my professional strategies and timely signals, I will surely be able to assist you in breaking through investment bottlenecks and achieving new breakthroughs in the trading field.

Gold is in a long-short tug-of-war, waiting for a breakGold enters the range fluctuation in the 4-hour chart. From the chart, we can see that the trend is triangular, with high points gradually moving down and low points gradually moving up. When the space cannot be expanded, there will be a breakthrough in one direction. There will be news this week. Therefore, short-term trading still depends on highs and lows. The daily chart MACD begins to cross downward. The daily chart is horizontally consolidated and paused, unable to set a new high, and there is still a need for short-term correction. In summary, I suggest that short-term operations should focus on long and short positions, supplemented by long positions.

Gold suffers from short selling and may fall sharply!The market is basically in a weak decline during the day, and the rebound is not strong. The hourly chart shows more negatives than positives, which shows that there is still a decline. As for the position selection, it is not recommended to chase the short position. If it can reach the high point of 3323-3324, it is still possible to continue to short. The support below is 3287-3270. If it falls below the low point of 3260, then pay attention to the top and bottom conversion position of 3245.

No fear of retracement, continue to be long on goldFundamentals:
1. First, focus on Trump and the Fed’s dynamics;
2. Pay attention to whether the geopolitical conflicts escalate, including the situation between India and Pakistan, Russia and Ukraine, and the situation between the United States and Iran, etc.
Technical aspects:
Gold fell after touching 3330, but it is obvious that the retracement space of gold is being compressed. The lowest price of gold only fell back to 3313, and it did not even make any attempt below 3310. With the continuous consolidation and strengthening of the support in the 3310-3300 area, the double bottom structure and the arc bottom form a technical resonance in the short term. Gold should still have room to continue to rise. I expect that gold is likely to continue to rebound and extend to the 3350-3360 area.
Trading strategy:
It is possible to consider going long on gold again after gold falls back to the 3315-3305 area, and expect gold to rise above 3350 as expected!

The gold daily line switches between yin and yang in a cycle!Gold fell back after hitting the 3500 mark, and the current low is temporarily stable around 3260. The daily cycle shows that the gold price has failed to test the support level for three consecutive trading days, and the pattern shows a wide range of fluctuations with alternating Yin and Yang lines. In this market, blindly chasing orders is risky because the price lacks sustainability and the long and short forces frequently switch. On the 4-hour chart, gold showed a small range consolidation, and the Bollinger Bands contracted, further confirming the oscillating pattern. The current trend is waiting for external factors to stimulate it, and the fluctuation of the US dollar index and the change of risk aversion will become the key drivers.

Gold fluctuates, waiting for data to guide the directionIn the recent volatile market, we must restrain the impulse to chase the rise and sell the fall. In terms of operation, it is recommended to go high and sell low in the range of 3270-3360: do not chase long above 3340, and go short on highs; do not chase short below 3280, and go low on callbacks. If the trend effectively falls below 3260 and stabilizes, it will be regarded as a medium-term long signal, rather than a stop-loss exit opportunity. The 1-hour moving average of gold begins to converge, but it continues to diverge downward. It seems that the surge of gold is just to lure more. Gold has been up and down recently, but the overall shock is still bearish. Whether the current shock of gold will eventually reverse upward, or is it just a relay of the decline, the data of gold in the second half of the week may give the answer. Since gold also rushed up and fell under the stimulation of risk aversion, it means that gold is still under pressure from above.
Investment strategy: Gold 3335 short, stop loss 3345, target 3270

Xauusd down trend. XAUUSD Update
Current Price: 3317.00
I've entered a sell position.
Stop Loss: 3369.94
Take Profit: 3265.67
Risking 52.94 points for a potential gain of 51.33 points.
Let’s see how this plays out.
Trust your setup. Stay disciplined.

XAU/USD: Seize the Range, Win the VolatilityCurrently, the gold price is in a pattern of wide-range fluctuations in the short term. The resistance at 3340 above is quite prominent, and the key support level below is at 3260. During the recent volatile market conditions, it is crucial to rein in the impulse to chase rising prices and sell in a panic when prices drop.
In terms of trading operations, it is recommended to adopt the strategy of selling high and buying low within the range of 3270-3360. Do not chase long positions when the price is above 3340, and you can initiate short positions when the price rises. When the price is below 3280, do not chase short positions, and you can buy at lower prices during pullbacks. If the price effectively breaks below 3260 and stabilizes, it should be seen as a medium-term signal for going long rather than a time to exit with a stop loss.
Overall, gold still needs to digest the adjustment pressure in the short term, but the risk of a trend-driven decline is limited. It is advisable to be patient and avoid taking heavy positions to bet on the market direction. You can make trading decisions after the market direction becomes clear.
XAUUSD
sell@3330-3335 tp:3315-3310
buy@3305-3310 tp:3325-3330
Investment itself is not risky; it is only when investment is out of control that risks occur. When trading, always remember not to act on impulse. I will share trading signals every day. All the signals have been accurate without any mistakes for a whole month. No matter what gains or losses you've had in the past, with my help, you have the hope of achieving a breakthrough in your investment.

Gold shock pulls long and short without continuationFrom the daily line, the K-line closed with a hammer-shaped small positive line with a long lower shadow, showing a trend of falling back and oscillating from a high position, which intensified the change in the K-line pattern of the top. The 4-hour level analysis shows that the short-term important suppression of gold is at 3360-3366. In terms of operation strategy, it is still mainly based on shorting if the rebound does not break this suppression level. The important support level of 3260-3268 should be paid attention to below. The middle track of the Bollinger band at the hourly level is near 3322, which can be used as a watershed of strength and weakness. After the gold price falls below the middle track of the Bollinger band, it is likely to go to the lower track of the Bollinger band, and it is more likely to test the oscillation bottom position of 3260. In terms of short-term operation ideas for gold, it is recommended to mainly short on rebounds, and to supplement on pullbacks.

Gold is short, gold may plummet!As the current price is basically fluctuating within the large range of 3260-3370, the overall trend is fluctuating downward, the high point is constantly moving down, and the low point is tested many times. The more tests are made, the greater the probability of breaking. Therefore, the continuity of the rebound is not strong. In the morning, we stepped back to 3319 and bought more. In the afternoon, we rebounded to 3323 and left the market with a small profit and then went short. It basically maintained a weak consolidation at a low level. This trend means that there will be further declines.

Gold Price in Key Compression Zone: Awaiting BreakoutThe 1-hour chart of XAU/USD (Gold Spot vs US Dollar) shows a clear symmetrical triangle formation, where the price has been compressing between a descending resistance zone (red) and a horizontal support zone (green). Here's a breakdown of the setup:
Support Zone (~3040–3080 USD):
This area has acted as a strong base multiple times, suggesting buyers are stepping in consistently at this level.
Resistance Trendline (~3310–3320 USD):
The price has repeatedly tested this descending resistance line but has failed to break above it so far.
EMA Indicators:
50 EMA (black line): Currently acting as dynamic resistance.
200 EMA (blue line): Price is hovering around it, indicating indecision.
Projected Breakout Scenarios:
Upside Breakout:
If price breaks above the resistance trendline, a sharp rally is projected towards the 3480–3520 USD zone. This move aligns with previous supply levels.
Downside Breakout:
If support fails, we could see a breakdown toward the 3040 USD region, with extended targets near 3080–3040 USD.
Current Bias:
The market is consolidating, and a breakout is imminent. Watch for volume and candle confirmation at either the resistance or support to determine the next major move.
================================================================
Disclosure:
I am a participant in TradeNation's Influencer Program and receive a monthly fee for utilising their TradingView charts in my market analysis.
=================================================================

Gold Spot (XAU/USD) Bullish Setup: Buy Zone to Target Levels Gold Spot (XAU/USD) on the 1-hour timeframe. Key points:
Support Zone: Strong support is identified in the yellow zone around 3,290–3,293, where price has bounced multiple times.
Buy Zone: Market is currently in a potential buy zone just above support, signaling a possible long entry.
Targets:
1st target: Around 3,368
2nd target: Around 3,419
All-Time High: Marked as a potential long-term resistance above 3,500.
Outlook: If price respects the support and buy zone, the market may rally toward the 1st and 2nd targets. Watch for bullish confirmation before entering.

The gold strategy is correct, enter the market at key points.Gold clearly treated the wide range of fluctuations, and the strategy was basically realized! In the real market, I also arranged short orders at 3345 and 35, and took profit at 3313-14! I continued to arrange long orders at 3302, and finally successfully reached the profit target of 3315! The overall harvest was good.
Analysis of gold trend:
On Tuesday (April 29) in the Asian market, spot gold fluctuated in a narrow range and is currently trading at $3337.58/ounce. Gold prices reversed their decline on Monday and rose. Earlier, they fell to around $3268, but then there was a low-absorption buying, and gold prices closed at $3343.91/ounce; the dollar fell across the board on Monday, which also provided support for gold prices. Investors cautiously waited for further news on US trade policies and prepared for a week of intensive economic data, which may initially indicate whether US President Trump's trade war is having an impact.
From a technical perspective, gold prices reversed their decline on Monday and rose. Gold repeatedly tested the 3260-3270 area for support. Gold has formed a multiple bottom structure in the short term, so gold may end its short-term adjustment. This time, gold has already adjusted, and it is unlikely to adjust again. Therefore, as long as it does not break the 3260 low in the near future, gold will rise and there will be room for growth. As for the high point, there are two dividing points, one is the 3337 high point, breaking 3337 is a strong shock, and the other is the 3370 high point, breaking 3370 is absolutely strong, then, the upper space is opened, and then look at 3420-3500.
From the daily chart, the daily line forms three bottoms at 3260, and the daily line closes positively, and the bullish trend is obvious. As long as the daily line is positive, it will not be able to go to the upper track or the previous high is just around the corner. The 4-hour cycle is also absolutely strong after Monday's rise, but now the unilateral rising mode of the Bollinger opening has not yet formed, and the gains and losses of 3370 will be tested here. Therefore, if the bullish long position continues on Tuesday, it must pay attention to whether 3370 breaks. If 3370 breaks, there will be a strong unilateral rising space. If 3370 does not break, it will still be a large range of fluctuations. Then, the only thing to consider during the day is to adjust the long position. Today, the lower support is around 3300-3310, and the upper pressure is around 3350-3360.

Shorting opportunities are coming near 3330 in the US market!
📌 Driving events
Because the easing of US-China trade tensions has weakened gold's safe-haven appeal, while investors are waiting for US economic data to assess the Fed's policy direction. Gold has been in a range recently as the market now waits for details of the first trade agreement, which is expected to be announced this week or next week.
📊Comment analysis
Gold reached a turning point last week, with Trump making some very positive comments, while stagflation risks continued to be excluded, and gold continued to fall. Stagflation pricing has driven gold prices higher, and as the market begins to exclude this risk, it is normal for a correction to occur, especially considering that "long gold" has become one of the most crowded trades.
💰Strategy Package
Short position:
Actively participate around 3330 points, profit target around 3300 points
⭐️ Note: Labaron hopes that traders can properly manage their funds
- Choose the number of lots that matches your funds
- Profit is 4-7% of the fund account
- Stop loss is 1-3% of the fund account
Let’s continue to be long on gold and keep winning!Fundamentals:
1. Focus on the performance of US economic data and the dynamics of the Federal Reserve;
Technical aspects:
At present, gold has failed to fall below the key area of 3300 many times during the retracement process, further strengthening the short-term structural support and strengthening the market's recognition of the effectiveness of its structural support. Moreover, gold may still maintain a volatile market before the NFP market. Due to the cautious attitude of the market, it is difficult for a unilateral trend to appear before the NFP market.
Short term trading strategies:
As in the two recently updated trading views, the trading strategy of long gold in the 3310-3300 area is still effective! Looking forward to gold rebounding to 3325 or even higher!

What is gold waiting for? Stuck in the 3300 area⭐️GOLDEN INFORMATION:
Gold price (XAU/USD) fails to build on Monday’s rebound from the key $3,265–$3,260 support zone, encountering renewed selling pressure during the Asian session on Tuesday. Although signals from the US and China remain mixed, investor sentiment remains buoyed by hopes of a potential easing in trade tensions between the world’s two largest economies. Additionally, signs of advancement in tariff negotiations have further bolstered optimism, dampening the appeal of the safe-haven metal.
⭐️Personal comments NOVA:
Gold price needs to be boosted by economic news to break out of the sideways price range around 3300, continue to wait today around 3300
⭐️SET UP GOLD PRICE:
🔥SELL GOLD zone : 3366- 3368 SL 3373
TP1: $3350
TP2: $3340
TP3: $3330
🔥BUY GOLD zone: $3267 - $3265 SL $3260
TP1: $3280
TP2: $3300
TP3: $3318
🔥BUY GOLD zone: $3301 - $3299 SL $3296 scalping
TP1: $3305
TP2: $3310
TP3: $3320
⭐️Technical analysis:
Based on technical indicators EMA 34, EMA89 and support resistance areas to set up a reasonable SELL order.
⭐️NOTE:
Note: Nova wishes traders to manage their capital well
- take the number of lots that match your capital
- Takeprofit equal to 4-6% of capital account
- Stoplose equal to 2-3% of capital account

Golden layout strategy!Gold daily level includes a positive hammer line with a long lower shadow. Gold fluctuates and hovers. There have been four oscillating daily lines, all running below the 3370 line. The probability of continued fluctuation is high. Based on the above analysis, it can be concluded that gold bottomed out and rebounded, and bulls took the initiative. In terms of operation, consider retreating and arranging long orders first, and high shorts as a supplement. Pay attention to the resistance of 3370-3400 US dollars on the top, and the support of 3310-3260 US dollars on the bottom.
