Another Good Trade for GOLD (XAUUSD) Today
My overall forecast for this week is that Gold will do classic expansion week where monday will go up then tuesday will most likely go up to sweep mondays high then do the reversal so that wednesday and thursday will be expansion going down and target the daily imbalances below. For today i was expecting a bullish push upwards for GOLD before it will reverse so i followed my steps by combining my multi timeframe analysis. From daily for the overall bias to 1H for that confirmation and alignment then 5m for my entry timeframe. Once i saw those 3 timeframes align with combination confirmation that i saw with the price action then i entered the trade. My original target was 1:3R but then i saw the weakness after price came to my 1:2R level so i manually pulled out with a 1:2R gain for today....
Xauusdbuy

You can't make money from such a simple market?After gold stepped back, it hit a new high again. Gold bulls continued to be strong. Gold broke through 3127 again, so the bulls are even better.
The gold 1-hour moving average continues to cross upwards and diverges. The support of the gold 1-hour moving average has moved up to 3096, but gold is now far away from the moving average, so wait patiently for adjustments and then step back to continue to buy. The gold 1-hour lowest yesterday fell to around 3100 and then stabilized again, so today gold will continue to buy on dips above 3100.
Trading ideas for reference:
Go long near gold 3110, sl: 3100, tp: 3130

3/31 Gold Trading StrategiesThe five-wave upward movement in gold has been completed. Next, we expect a period of consolidation around 3130, forming a short-term top before a potential pullback. However, during this consolidation phase, there is a possibility of a price surge, though the probability is low.
Trading Suggestions:
For conservative traders: Avoid rushing into positions. It’s better to wait for a pullback and the confirmation of a secondary top before entering trades.
For aggressive traders: You may enter at the current price, but be cautious with your position sizing and leave room for potential additions.
Based on the magnitude of the previous upward movement, the expected retracement zone is around 3110-3096, where a minor support level may form.
Trading Strategy:
📉 Sell in the 3121-3131 range
📈 Buy in the 3105-3090 range
Trade carefully

XAU/USD BuyHello dear traders
I try to guide you in trading and creating trading positions and share my trading ideas with you so that if I make a profit, you can also make a profit with me.
These analyzes are done with great complexity and all technical parameters are taken into account as much as possible.
And finally, it is presented to you in a completely simple and practical way to use them.
Be sure to follow the capital management.
Do not risk more than 1% of the capital in any of the positions.
Keep in mind that you are responsible for all trades.
(Good luck)

GOLD: What to do if you Hold a Short position?Gold is rebounding. Pay attention to the resistance above 3020. At present, we can see obvious selling pressure on the 2H chart. MACD has formed a divergence. 2H is a larger period. Its form is short, which means that tomorrow or the day after tomorrow, the market will fall sharply.
In addition, the divergence of MACD is sometimes repaired by shock market. This situation is not uncommon, so when trading, we need to focus on the support.
Judging from the current candlestick chart arrangement, there is support near 3100, followed by the 3096-3088 range. If a larger divergence pattern is to be formed, the price may reach the 3036-3048 range. At that time, there is no need to hesitate too much, just sell it.

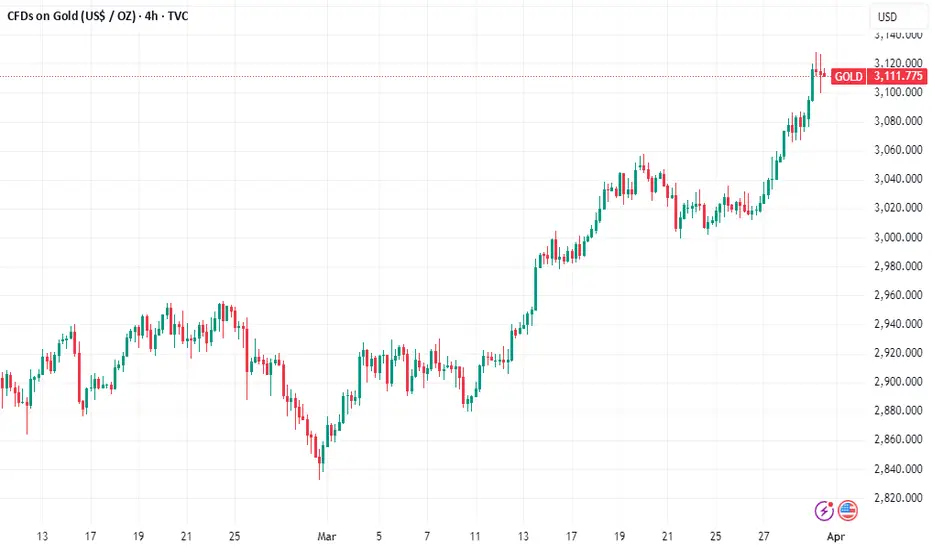
Gold's Historic Ascent: Breaking the $3,100 Barrier
Gold, the timeless safe-haven asset, has surged to unprecedented heights, breaching the $3,100 per ounce mark for the first time in history. This remarkable rally, fueled by a confluence of geopolitical tensions and economic anxieties, underscores gold's enduring appeal as a hedge against uncertainty. The recent surge, surpassing the previous record set just days prior, signals a potent shift in investor sentiment, driven significantly by the United States' imposition of new levies.
The Catalyst: US Levies and Geopolitical Turmoil
The primary catalyst for gold's dramatic ascent is the escalating geopolitical landscape, particularly the United States' implementation of new levies. These levies, often associated with trade disputes and economic protectionism, inject uncertainty into global markets. Investors, seeking to mitigate potential losses, flock to safe-haven assets like gold, driving its price upward.
Beyond the immediate impact of US levies, a broader sense of economic fragility permeates the market. Concerns about inflation, rising interest rates, and potential economic slowdowns have created a climate of apprehension. In such environments, gold's historical role as a store of value becomes increasingly attractive, bolstering its demand.
Gold's Safe-Haven Status: A Time-Tested Phenomenon
Gold's allure as a safe-haven asset is deeply rooted in its intrinsic properties and historical performance. Unlike fiat currencies, which are susceptible to inflation and government policies, gold retains its value over long periods. In times of economic and political instability, gold tends to outperform other asset classes, serving as a reliable hedge against market volatility.
This safe-haven status is further reinforced by gold's limited supply and its universal recognition as a valuable asset. The precious metal's physical nature and its role in various industries, from jewelry to electronics, contribute to its enduring demand.
The Market Reaction: A Surge in Investor Confidence
The surge in gold prices reflects a significant shift in investor confidence. As traditional investment avenues become increasingly risky, investors are turning to gold as a means of preserving capital. The influx of funds into gold-backed exchange-traded funds (ETFs) and other gold-related investments underscores this trend.
The market's reaction also highlights the interconnectedness of global economies. The US levies, while originating from a single nation, have reverberated across international markets, triggering a flight to safety. This demonstrates the profound impact of geopolitical events on investor behavior and asset prices.
Analyzing the Price Surge: Factors at Play
Several factors contribute to gold's current price surge:
• Currency Fluctuations: A weakening US dollar can make gold more attractive to investors holding other currencies.
• Inflationary Pressures: Rising inflation erodes the purchasing power of fiat currencies, increasing the appeal of gold as an inflation hedge.
• Interest Rate Policies: Lower interest rates can reduce the opportunity cost of holding gold, as it does not generate interest income.
• Geopolitical Instability: Political conflicts, trade disputes, and economic sanctions create uncertainty, driving demand for safe-haven assets.
• Central Bank Purchases: Central banks often hold gold reserves as a hedge against currency fluctuations and economic instability. Their purchasing activity can influence gold prices.
•
Looking Ahead: The Future of Gold Prices
Predicting future gold prices is inherently challenging, as they are influenced by a complex interplay of factors. However, several trends suggest that gold's upward trajectory may continue:
• Persistent Geopolitical Tensions: Ongoing political conflicts and trade disputes are likely to sustain demand for safe-haven assets.
• Economic Uncertainty: Concerns about inflation, rising interest rates, and potential economic slowdowns are expected to persist.
• Increased Investor Interest: The recent surge in gold prices has attracted significant investor attention, potentially leading to further inflows of funds.
However, potential headwinds could also impact gold prices:
• Strengthening US Dollar: A stronger US dollar could make gold less attractive to international investors.
• Rising Interest Rates: Higher interest rates could increase the opportunity cost of holding gold.
• Improved Economic Outlook: A more optimistic economic outlook could reduce demand for safe-haven assets.
The Significance of Gold's Milestone
Gold's breach of the $3,100 mark is a significant milestone, reflecting the profound impact of geopolitical tensions and economic anxieties on global markets. It underscores gold's enduring role as a safe-haven asset and its ability to preserve value in times of uncertainty.
As investors navigate the complexities of the global economy, gold is likely to remain a key component of diversified investment portfolios. Its historical performance, intrinsic properties, and universal appeal make it a compelling asset in an increasingly uncertain world.
GOLD:Short positions are dominant in New York sessionToday, gold jumped higher and opened higher. After filling the gap, it continued to rise, breaking through the 3100 mark and approaching 3130. The excessive and rapid rise caused the MACD indicator to diverge, giving us the opportunity to short this time, from which we gained 1000+ points of profit. Together with the profit of nearly 2000 points in the Asian session, we have gained more than 3000 points of profit today.
At present, the price is still falling, with weak support roughly around 3107 and strong support around 3098. Before the start of the US session, the price is expected to fluctuate in the 3100-3130 area. There will be large fluctuations after the opening, and the possibility of falling from a high position is greater, so the US session can pay more attention to the opportunity to short at a high position.

Will Gold Break 3000? (Potential Bullish Continuation)Gold price seems to exhibit signs of overall bullish continuation on the Longer Timeframes as the price action may break the previous All Time High of 2956.
A potential break may be indicative of another top OR a new high.
We take our chance on the basis of a proper Bullish Breakout.
Trade Plan :
Entry @ 2967
Stop Loss @ 2822
TP 1 @ 3112

GOLD: SELL@3096-3102 TP3083-3078Gold opened higher today, and the price once approached 3100. It will fall back in a short time. It is recommended to sell in the range of 3096-3102, tp3083-3078, sl3107

XAUUSD:Tomorrow, focus on going long on pullbacksLast Friday, influenced by both the evening market sentiment and capital flows, gold had a relatively high probability of rising overall. However, after the release of the PCE inflation data, the market reaction was poor as the data was bearish.
Gold failed to directly break through the previous high and reach a new peak. It was evident that the gold price did not hold firm above 3086, dropping rapidly after touching that level twice. Thus, one should not blindly chase long positions. If the gold price breaks below 3060, a genuine adjustment may ensue.
Overall, for tomorrow's short-term trading of gold, the trading approach should mainly involve going long on pullbacks and be supplemented by selling short on rebounds. In the short term, closely monitor the resistance level at the 3095-3100 range on the upside, and the support level at the 3070-3065 range on the downside.
Get daily trading signals that ensure continuous profits! With an astonishing 90% accuracy rate, I'm the record - holder of an 800% monthly return. Click the link below the article to obtain accurate signals now!

3/31 Gold Trading StrategiesThis seems to be a 5-wave upward trend, and GOLD is currently in the final phase of the upward movement. Given the strength of the bullish momentum, a rise towards the 3100 level is highly probable. Therefore, in tomorrow's trading, it would be reasonable to continue buying with a take-profit target in the 3095-3105 zone. Once the take-profit area is reached, consider switching to a short position.

Gold Spot (XAU/USD) Analysis: Bullish Pennant Breakout to Target1. Overview of the Chart
This 4-hour chart of Gold Spot (XAU/USD) presents a bullish pennant pattern, which is a strong continuation formation, indicating that the price is likely to continue its upward trajectory. The price action has followed a clear trend structure, and we can identify key support and resistance levels, breakout points, and potential profit targets.
This analysis provides a comprehensive breakdown of the chart setup, including:
The technical pattern formation
Key support and resistance zones
Trade setup with an ideal entry, stop loss, and profit target
Risk management considerations
Market conditions and external factors to monitor
2. Breakdown of the Chart Pattern: Bullish Pennant Formation
Understanding the Bullish Pennant Pattern
A bullish pennant is a continuation pattern that occurs after a strong upward movement (known as the "flagpole"). The market then consolidates within a small triangular shape, forming the pennant. This consolidation is seen as a temporary pause before the next bullish move.
Key Characteristics of the Pennant in this Chart
Flagpole Formation:
The steep rally before the pennant formed represents a strong bullish impulse, driven by increased buying pressure.
This rapid price increase set the foundation for the pennant pattern.
Consolidation (Pennant Formation):
Price action moved within converging trendlines, forming a symmetrical triangular pattern.
The market temporarily paused, as some traders took profits while others awaited further momentum.
This type of consolidation is common before the price resumes its trend.
Breakout from the Pennant:
The bullish breakout above the upper trendline of the pennant confirms the continuation of the uptrend.
A strong breakout suggests renewed buying interest, likely pushing prices toward the next resistance level.
3. Key Technical Levels on the Chart
A. Resistance Level (Potential Selling Zone)
A critical resistance zone is marked between $3,100 - $3,125, where selling pressure could emerge.
If the price faces rejection in this zone, a temporary retracement could occur before another push higher.
A breakout above this resistance level would further strengthen the bullish case, possibly pushing gold toward the $3,175 - $3,200 range.
B. Support Level (Demand Zone)
The support zone is around $3,025 - $3,017, which is the last significant swing low.
This level represents a strong buying area where traders may look for re-entry on a pullback.
A break below this support could invalidate the bullish setup, signaling a shift in market sentiment.
C. Trendline Support (Dynamic Support)
The dashed black trendline represents an uptrend support.
If price retraces toward this level and holds, it may offer another buying opportunity before resuming its uptrend.
A break below this trendline would be a warning signal, suggesting a weakening of bullish momentum.
4. Trade Setup and Execution Strategy
A. Entry Strategy
The ideal entry point was upon the confirmed breakout above the pennant, around $3,075 - $3,085.
Aggressive traders may have entered at the breakout itself.
Conservative traders may wait for a pullback to retest the breakout zone before entering, ensuring confirmation.
B. Stop Loss Placement (Risk Management)
A stop loss is placed below the support zone at $3,017 to minimize downside risk.
This placement protects against false breakouts or unexpected market reversals.
Keeping a tight stop loss allows for a higher risk-to-reward ratio while maintaining a disciplined approach.
C. Profit Target Projection (Expected Price Movement)
The target price is determined using the measured move approach, where the height of the flagpole is added to the breakout point.
The expected profit target is in the range of $3,175 - $3,200, offering a potential upside of 4.29% from the breakout level.
If price maintains its bullish momentum, further gains could be expected beyond the target zone.
5. Risk Management & Considerations
A. Risk-to-Reward Ratio (RRR)
This trade setup provides a favorable risk-to-reward ratio (RRR).
With an entry near $3,085, a stop loss at $3,017, and a target around $3,175, the trade offers a reward-to-risk ratio of approximately 3:1.
This ensures that even if the trade does not succeed, the risk is controlled while allowing significant upside potential.
B. Factors That Could Invalidate the Setup
Failure to sustain the breakout: If price falls back below the pennant, the setup may be invalid.
Break below the support zone ($3,017): This would signal a possible trend reversal.
Weak volume on breakout: A lack of volume could indicate a false breakout, leading to price retracement.
C. Alternative Trade Scenarios
Scenario 1: Retest & Continuation:
If price pulls back to retest the breakout zone ($3,075 - $3,085) and holds, traders can look for another buying opportunity.
Scenario 2: False Breakout & Reversal:
If price falls below the support level ($3,017), traders should exit long positions and re-evaluate market conditions.
6. Market Conditions & External Factors to Monitor
A. Gold’s Correlation with USD & Interest Rates
Stronger USD → Downward Pressure on Gold
Weaker USD → Bullish Gold Trend
Interest rate decisions from the U.S. Federal Reserve play a significant role in gold prices.
B. Economic Events & News Impact
Inflation Reports: Higher inflation often supports gold prices.
Geopolitical Tensions: Political instability can lead to increased demand for gold as a safe-haven asset.
Stock Market Movements: A weaker stock market can drive capital into gold.
7. Conclusion: Bullish Outlook with Cautious Optimism
Key Takeaways:
✔ Bullish pennant breakout confirmed – strong continuation signal.
✔ Price is above key support & trendline – maintaining bullish structure.
✔ Clear trade plan with entry, stop loss, and target levels.
Trading Plan Summary:
Entry Stop Loss Target Risk-Reward Ratio
$3,075 - $3,085 $3,017 $3,175 - $3,200 3:1
📌 Final Recommendation:
Maintain a bullish bias as long as price holds above the support zone ($3,017).
Watch for volume confirmation to ensure the breakout is valid.
Adjust stop loss or secure profits if price reaches key resistance levels ($3,100 - $3,125).
If you need further clarification or alternative trade scenarios, let me know! 🚀

Gold Top Trading SignalsGold continued to weaken under pressure at 3047 in Asian trading last Friday. In the afternoon, the European session broke through the 3030 mark and stabilized near 3021. In the evening, the US session repeatedly fluctuated and suppressed below the 3037 mark, ushering in an accelerated downward decline and breaking the bottom. Finally, it pierced near 3000 before closing and rebounded and closed at 3023. The daily K-line closed with a suppressed and falling middle shadow. The overall gold price showed a suppressed and falling adjustment pattern below the 3057 mark. After the opening of gold in the morning today, the gold price did not fluctuate much. It rebounded to the 3026 line and then stepped back for adjustment. As long as the correction does not break the low point of last Friday, we will continue to look for opportunities to buy when it steps back.
From the current 4-hour analysis, today's upper short-term resistance is still focused on around 3030-35, and the lower short-term support is focused on around 3000-3005. The overall support relies on this range to maintain the main tone of high-altitude low-multiple cycles. In the middle position, watch more and do less, be cautious in chasing orders, and wait patiently for key points to enter the market.
Gold operation strategy:
1. Gold falls back to 3000-3005 line, stop loss 2995, target 3025-3030 line, continue to hold if it breaks;
2. Gold rebounds to 3035 line but does not break, you can go short, stop loss 3042, target 3005-10 line;

Gold recommends short entry at 3030Last week, the daily RSI of gold fell slightly below the overbought area of 70, but combined with the intact structure of the three-month rising channel, the current retracement is more inclined to a technical correction rather than a trend reversal. From a spatial perspective, the 3030 line as the midpoint of the channel constitutes the primary resistance. If this position cannot be effectively broken through, the gold price may test the support of the 3000 integer mark downward. It is worth noting that the static resistance formed near 3050 resonates with the recent negative fundamentals, further suppressing the upward space.
The current strategy needs to fluctuate in the range. In the morning, focus on whether the opening high of 3026 can be recovered. If it stabilizes, it will be seen to 3035, the opening point of last week; on the contrary, if it falls below the short-term moving average support of 3010, the short position can follow the trend to the expected level of 3000. It is recommended to adopt the range trading mode, and operate back and forth between high and low in the range of 3000-3035. Technically, we need to be alert to the stagflation signal formed by the continuous shortening of the MACD red column and the closing of the Bollinger Bands. It is recommended to avoid chasing highs and focus on the impact of the US CPI data on the market at noon.
Gold operation suggestions: short near the rebound of 3030-3035, stop loss 3042, target 3005

Gold 100% Trading SignalsGold opened on Monday with a rebound range fluctuation. At present, it has reached the highest point of 3032 and then retreated under pressure. The lowest point reached 3014. Our article also gave the upper 3030-35 line as the main suppression range fluctuation. We will continue to pay attention to the range fluctuation. The operation is still mainly to do more on the retracement. If it continues to strengthen and break through, the subsequent decline may just be a correction of the bulls. The short-term suppression point above gold will be maintained at the 3035 line. As long as the correction does not break the low point near 3000 last Friday, we will continue to look for more opportunities on the retracement.
From the current 4-hour analysis, the upper short-term resistance is still focused on 3035, the lower short-term support is focused on 3015-20, and the focus is on the support near 3000-3005. The overall main tone of low-multiple participation remains unchanged. For the middle position, watch more and do less, and be cautious in chasing orders.
Gold operation strategy:
1. Buy when gold falls back to 3015-3020, add more when it falls back to 3000-05, stop loss at 2995, target at 3035-3040, continue to hold if it breaks

Gold Trading SignalsOn Friday night, it bottomed out at 3000 and rebounded, and rebounded to close at 3023 in the early morning. This position is very critical. On the one hand, it is in the middle of the decline of 3038-3000, which can go up or down; on the other hand, the 618 golden section is just at 3023. If it opens here on Monday, there are technical reasons to support it. If it breaks the short-term line, it can only rely on the 3038 line pressure to be bearish.
Therefore, for gold on Monday, don’t blindly chase it when it opens in the morning, as it is easy to cause market interruption after the weekend. You can try shorting by relying on the 3038 line pressure above, and you can see more rebounds around the 3010 line support below. If there are changes in the specific market, it will be given in real time during the trading session.
In terms of trading, Jinsheng’s expected analysis layout was fully completed at the end of Friday yesterday, and the market was accurately realized. The short position at 3043 in the morning was successfully closed at 3030 at noon, earning 13 US dollars; the short position at 3033 rebounded in the afternoon, and the position was reduced at 3017 in the evening, with the remaining profit at 3006, earning 27 US dollars; the two orders made a profit of 40 US dollars, and the weekly line ended perfectly.

Gold recommends high-short and low-longThe rise of the US dollar index benefited from Trump's tariff policy. Just yesterday, Trump suddenly announced that a 25% tariff would be imposed on the purchase of oil and natural gas from Venezuela. At the same time, he claimed that some tariffs would be reduced or exempted. The market's tense nerves were released, and the US dollar index rose sharply. As the end of the month approaches, the market needs to rebalance its investment portfolio and increase the allocation of US dollars to hedge against unknown risks, pushing the US dollar to continue to rise. Yesterday, the market news was light. Today, the market will welcome the speech of Federal Reserve Board Governor Kugler on "Economic Outlook and Entrepreneurship". Immediately afterwards, New York Fed Williams will speak at a public event. In addition, there is the March Conference Board Consumer Confidence Index at 10 pm. The above events and data are concentrated in the evening time today, which will have a certain impact on the market and need to be paid attention to. The price of gold has begun to retreat from its historical high, and the safe-haven buying force has eased. This retreat momentum is expected to intensify further, especially in terms of technology.
At present, the price of gold is running in a similar triangle range, and the correction cycle is extended. On the one hand, the bulls rebounded after the pressure of the high, and it is difficult to return to the strong position directly; on the other hand, the retracement is supported by the key top and bottom conversion support band of 3005-3000. This trading day focuses on the gains and losses below the low of 3000 at the end of last Friday, and the breakthrough below the upper 3030 pressure line. If it cannot break through, there is a high probability of oscillating around this range during the day. Gold operation suggestion 1: short near the rebound of 3020-3025, stop loss 3030, target 3005. Gold operation suggestion 2: long near the retracement of 3000-3005, stop loss 2995, target 3020

Gold Bullish Frenzy? Watch for Reversal SignalsAt present, it seems that the situation for the bulls is promising. However, the market is not necessarily so. This kind of behavior to induce more long positions is quite normal in the market.
Market makers often operate in a strategic way. After they have reaped the profits from the bulls, it's highly likely that the next target will be the bears.
Looking at the gold market specifically, the price of gold is currently at a high level and is bound to decline. This frenzied bullish trend simply cannot be sustained, and this is an inevitable outcome. The current gold price has seriously deviated from its normal track. One could even
say that it has completely derailed or "strayed from the norm". Such a situation is clearly unreasonable, and a return to a reasonable level is inevitable.
I will share trading signals every day. All the signals have been accurate for a whole month in a row. If you also need them, please click on the link below the article to obtain them.

Gold (XAU/USD) Technical Analysis – Next Week Big Move?The daily chart of Gold Spot (XAU/USD) presents a well-structured triangle pattern breakout, a strong uptrend, and a critical resistance zone near all-time highs (ATH). The price action suggests that gold is in a bullish phase but approaching a key decision point where it could either break higher or face a temporary pullback.
This analysis provides a detailed breakdown of the pattern, key levels, potential scenarios, and trading strategies for the coming week.
1. Technical Chart Breakdown
A. Triangle Pattern Breakout (Bullish Continuation)
The chart shows a symmetrical triangle formation, which typically signals a consolidation phase before a major price movement.
After a period of accumulation within the triangle, gold broke out upwards, confirming a bullish continuation pattern.
This breakout was supported by strong volume and buying pressure, reinforcing the trend strength.
B. Trendline & Support Levels (Key Areas for Buyers)
A rising trendline has been acting as dynamic support, confirming that the market remains in a bullish structure.
Major Support Levels:
$3,000 – A psychological support level that may act as a bounce zone in case of rejection at resistance.
$2,885 – A well-defined horizontal support level, previously tested multiple times.
If the price falls below $2,885, it could signal a trend reversal or a deeper correction.
2. Key Price Levels & Market Sentiment
A. Resistance & Target Levels (Where Sellers Might Step In)
Primary Resistance Zone: $3,137 - $3,150
This level represents a combination of all-time high (ATH), historical resistance, and a key breakout target.
If the price breaks and holds above this zone, it could trigger further upside towards $3,200 - $3,250.
However, if sellers dominate at this level, a pullback or correction could occur.
B. Stop-Loss & Risk Management Considerations
Traders should be cautious around the resistance zone and place stop-loss levels strategically to manage risk.
Stop-Loss Suggestions:
For Long Trades: Below $3,000 (to protect against fake breakouts).
For Short Trades: Above $3,150 (if price rejects resistance and starts a reversal).
3. Trading Strategy for Next Week
Scenario 1: Bullish Breakout & Continuation
If gold breaks and sustains above $3,137, it will confirm a bullish continuation.
Entry Strategy: Look for a retest of the breakout level ($3,100 - $3,137) before entering long positions.
Profit Targets:
First Target: $3,200
Second Target: $3,250+
Stop-Loss: Below $3,000, to protect against sudden reversals.
Scenario 2: Rejection at Resistance & Pullback
If gold fails to break $3,137 and forms a bearish rejection candle, it may indicate a short-term pullback.
Short Entry Strategy: Wait for confirmation of rejection with bearish price action signals (e.g., bearish engulfing, long upper wick).
Downside Targets:
First Target: $3,000
Second Target: $2,885 (major support)
Stop-Loss: Above $3,150, to avoid being trapped in a false breakdown.
Scenario 3: Bearish Reversal (Break Below $2,885)
If gold falls below $2,885, it could signal a potential trend reversal.
Short Trade Setup: Enter below $2,885, targeting $2,800 - $2,750 in the medium term.
Stop-Loss: Above $2,900, in case of a false breakdown.
4. Indicators & Confirmation Signals
A. Volume & Candlestick Patterns
Watch for high volume during breakouts to confirm strength.
Candlestick patterns such as bullish engulfing, hammer (for support bounces), or shooting star (for resistance rejection) can provide strong confirmation signals.
B. RSI (Relative Strength Index) & Overbought Conditions
If RSI is above 70, it could indicate that gold is overbought, increasing the likelihood of a pullback.
If RSI stays above 50 but below 70, it confirms bullish strength.
C. Moving Averages for Trend Confirmation
50-day and 200-day moving averages can act as additional support and resistance zones.
If the price is above both moving averages, it confirms the bullish trend.
5. Conclusion – What to Watch for Next Week?
✅ If price breaks and holds above $3,137 → Expect continuation towards $3,200 - $3,250.
✅ If price rejects at $3,137 → Watch for a pullback towards $3,000 or $2,885 for re-entry.
✅ If price drops below $2,885 → Expect deeper correction with a shift in trend structure.
📌 Key Takeaway: Gold remains bullish, but traders should watch the resistance level at $3,137 closely for confirmation of a breakout or a possible reversal. Risk management is crucial in case of unexpected market shifts.
Would you like me to add more insights using Fibonacci levels or historical trends? 📊🚀

GOLD Long opportunity from 3,050 or 3,020 back to ATH'sThis week, my outlook on gold remains strongly bullish. Price has once again reached its all-time high (ATH) and broken structure to the upside, leaving behind new demand zones that present potential buying opportunities.
The first key area of interest is the nearby 6-hour demand zone. While not the most ideal setup, I will be monitoring how price reacts once it mitigates this level.
Additionally, there is a 15-hour demand zone positioned lower, offering a more favorable entry at a discounted price. This zone was responsible for the break of structure to the upside, making it a strong area of interest. If price reaches this level, I expect a slowdown followed by a buildup of bullish momentum.
Confluences for XAU/USD Buys:
Price has broken structure to the upside on the higher timeframes.
Clean 6-hour and 15-hour demand zones remain unmitigated.
Gold has been consistently bullish across both lower and higher timeframes.
DXY is trending bearish, reinforcing gold’s bullish bias due to their inverse correlation.
Note: There is some liquidity resting below in the form of an equal low and a small trendline. I will wait for confirmation in these areas before making any decisions.

The short-term short positions in gold are now yielding profits!Currently, the market continues to maintain a range - bound oscillation pattern. In the short term, there are no conditions for a significant unilateral upward or downward movement. In terms of short - term trading, the price is currently trading at $3032. From the perspective of intraday trading strategies, this price level can be regarded as an entry point for short positions. Today, special attention should be paid to the $3020 level, which serves as the daily demarcation line between bulls and bears. If the price drops from a high level as expected, effectively breaks below the $3020 level and closes below this price, the short - side is expected to witness a sharp acceleration in the bottom - seeking trend.
Since the week began, considering global economic trends and gold market volatility, we've steadily shorted gold. All signals, from our in - depth analyses, have proven accurate. I'll keep giving accurate signals, factoring in market changes.
XAUUSD
sell@3030-3035
tp:3025-3015
I will share trading signals every day. All the signals have been accurate for a whole month in a row. If you also need them, please click on the link below the article to obtain them.

GOLD Bullish Continuation - Will Buyers Push Toward 3,084$?OANDA:XAUUSD is currently trading within an ascending channel, maintaining a bullish structure. The price has broken above a key resistance zone which has now flipped to support, aligning with a potential bullish continuation.
With momentum favoring the upside, the price could move toward the 3,084$ level, which aligns with the midline of the channel. However, a failure to hold this level could indicate a potential shift in momentum.
Traders should monitor for bullish confirmation signals, such as bullish engulfing candles, strong wicks rejecting the support zone, or increased buying volume, before considering long positions.
Let me know your thoughts or any additional insights you might have! 🚀

Gold (XAU/USD) – Triangle Breakout & Bullish Trade Setup Overview
This 1-hour Gold Spot (XAU/USD) chart showcases a well-defined symmetrical triangle pattern, which has successfully broken out to the upside. This breakout indicates strong bullish momentum, setting up a potential rally towards $3,107 and beyond.
The analysis below will cover:
✅ Triangle Pattern Formation & Breakout Explanation
✅ Key Technical Levels (Support, Resistance, ATH)
✅ Entry, Stop Loss, & Take Profit Strategies
✅ Risk Management Considerations
✅ Final Trade Setup & Market Sentiment
Let’s dive into the details.
1️⃣ Chart Pattern: Symmetrical Triangle Formation
What is a Symmetrical Triangle?
A symmetrical triangle is a common continuation pattern in technical analysis that forms when price consolidates within two converging trendlines. This structure indicates a period of indecision in the market before a potential breakout occurs.
When price breaks above the upper trendline, it signals a bullish continuation.
If price breaks below the lower trendline, it suggests a bearish move.
In this case, gold has broken above the upper resistance trendline, signaling a continuation of the existing uptrend.
Pattern Breakdown (Step by Step):
Triangle Formation: The price made higher lows and lower highs, compressing within the pattern.
Price Squeeze: As the market approached the apex of the triangle, volatility decreased, indicating an imminent breakout.
Breakout Confirmation: A strong bullish candle closed above the resistance trendline, validating the pattern and confirming bullish momentum.
2️⃣ Key Technical Levels & Zones
🔹 Support & Resistance Zones:
Support Level: $3,012 - $3,020 (Highlighted as a strong demand zone where buyers stepped in).
Resistance Level: $3,080 (Previously acted as strong resistance but has now turned into support post-breakout).
All-Time High (ATH): Marked just below $3,090, where price previously struggled to break through.
🔸 Breakout Target & Price Projection
Breakout Level: The breakout happened above $3,080, confirming an uptrend continuation.
Target Calculation:
The height of the triangle is projected upwards from the breakout point.
This gives us a price target of $3,107 - $3,120 in the short term.
3️⃣ Trading Strategy Based on Breakout
✅ Entry Strategy:
Aggressive Entry: Entering immediately after the breakout candle closes above $3,080, riding the momentum.
Conservative Entry: Waiting for a potential pullback to $3,080 (now acting as support) before entering a long position.
⛔ Stop Loss Placement:
Ideal Stop Loss: Below the previous support zone at $3,012, ensuring protection against fake breakouts.
Tighter Stop Loss: Just below the breakout point at $3,065, in case of a minor retracement before moving higher.
🎯 Profit Target Strategy:
Short-Term Target: $3,107, based on the triangle’s measured move.
Extended Target: If momentum sustains, $3,120+ could be achieved, aligning with previous bullish trends.
4️⃣ Risk Management & Market Considerations
Risk Factors to Monitor:
🔸 Volume Confirmation: A breakout with high trading volume is a stronger signal than one with low volume.
🔸 Market Fundamentals: Events like US inflation data, Federal Reserve rate decisions, and geopolitical tensions can impact gold prices.
🔸 False Breakout Risk: If price falls back below $3,080, the breakout might be invalid, signaling a potential reversal.
Risk-Reward Ratio:
📌 Entry: $3,080
📌 Stop Loss: $3,012 (Approx. 68 points risk)
📌 Target: $3,107 - $3,120 (Approx. 27-40 points reward)
📌 Risk-to-Reward Ratio: 2:1+, making this a favorable trade setup.
5️⃣ Market Sentiment & Final Trade Setup
📈 Bullish Outlook:
The successful breakout above the symmetrical triangle signals continued bullish strength.
Price is holding above the previous resistance zone at $3,080, now acting as support.
The next resistance target is $3,107 - $3,120, aligning with previous swing highs.
🔴 Bearish Scenario (If Invalidated):
If price falls back below $3,080, it could indicate a false breakout.
A break below $3,065 might lead to a retest of the $3,012 support zone.
📊 Final Trading Plan:
✅ Buy (Long) at: $3,080 - $3,085
🎯 Target 1: $3,107
🎯 Target 2: $3,120+ (Extended Target)
⛔ Stop Loss: $3,012
🔥 Conclusion: Bullish Bias with Caution
Gold (XAU/USD) has successfully broken out of the symmetrical triangle, signaling a strong bullish continuation. As long as price holds above $3,080, the bias remains bullish, targeting $3,107 - $3,120.
💡 Key Takeaway: Watch for a pullback and retest of $3,080 before entering, ensuring confirmation before committing to the trade.
🚀 Final Outlook: Bullish – Gold is positioned for further upside if momentum continues!
