XAUUSD: Gold Once Again Back To $3270 Region, What Next ? Gold has once again backed to the 3270 region and rejected it, currently trading at 3280$. The main question is whether gold will hold on to this level. If not, we could see a strong sell-off taking the price to 3130. This is because the sellers’ presence has increased, and the price has been volatile due to mixed news and economic data, further strengthening the bears’ position in the market.
Despite this, we remain optimistic that gold will continue its bullish move upwards. There’s a strong reason for this: we may see all-out war happening in Asia, although this is purely speculative. For now, you may decide to continue monitoring the price or even take a swing buy, which could be risky.
Given the volatility of gold, we recommend trading cautiously and taking extra precautions while trading gold.
Wishing you good luck and safe trading!
Thank you for your support! 😊
If you’d like to contribute, here are a few ways you can help us:
- Like our ideas
- Comment on our ideas
- Share our ideas
Team Setupsfx_
❤️🚀
Xauusdbuy

#XAUUSD: 676+ Pips Since Our Last Entry! Comment Your Views! As we explained in our previous chart, the price will retouch 3270$ and then continue the bullish movement. The price did exactly that, with a 674+ increase from our last idea. It’s now on the way towards $3500 or beyond. Get ready for a big move on gold this week, but be extra cautious as the price can be volatile.
Good luck and trade safely!
Thank you for your unwavering support! 😊
If you’d like to contribute, here are a few ways you can help us:
- Like our ideas
- Comment on our ideas
- Share our ideas
Team Setupsfx_
❤️🚀

XAUUSD: Intraday Bullish Move Up To $3400! The OANDA:XAUUSD price has shown strong bullish momentum, indicating it will likely continue to rise above $3400. However, the price is currently volatile and is likely to remain so.
Good luck and trade safely!
Thank you for your unwavering support! 😊
If you’d like to contribute, here are a few ways you can help us:
- Like our ideas
- Comment on our ideas
- Share our ideas
Team Setupsfx_
❤️🚀

How to position the market after gold falls to around 3280Gold began to fall after rebounding to around 3313, and has now fallen below the important support of 3300. Looking at it now, gold is most likely to be a relay of the decline. The rebound of gold will continue to be bearish. The current 1-hour moving average of gold tends to stick together and diverge downward, and the decline is a bit sharp. If it continues to cross downwards to form a dead cross, then there is still room for gold shorts to fall. It is recommended to wait and see the support of the previous low of 3260. If the support is not broken, then consider going long. In the evening, we need to pay attention to the fluctuations that may be caused by ADP and PCE data.
Many friends who have read my posts have reported that my trading ideas and strategies are very helpful to them. I always firmly believe that profitability is the criterion for measuring strength, and seizing the opportunity is the key to victory. I will post every day to share my trading strategies and ideas for free. If you have just entered the market and don’t know how to make more profits, if you are already in it but the harvest is not ideal, then you might consider taking a look at my profile.
OANDA:XAUUSD FX:XAUUSD FOREXCOM:XAUUSD FXOPEN:XAUUSD TVC:GOLD

4/30 Gold Trading SignalsGold showed limited movement yesterday and did not enter either of our predefined major trading zones, leading to minimal profits.
As of now, the price continues to consolidate. A larger movement is likely to occur during the U.S. session following key economic data.
Until then, consider short-term range trading between 3330-3290.
📌 Why Today’s Data Matters
Gold has been trapped in a tight range for several sessions, and a directional breakout is imminent.
Today’s data release will likely dictate that direction, so it is crucial to stay alert.
✅ Data-Driven Strategy:
If data is bullish (gold rallies):
Avoid chasing the initial breakout. Wait for the first spike to settle, then short the retracement, with a TP of less than $10.
If bulls remain strong, the retracement should stay under $20. Once short positions are closed, watch for confirmation to go long.
If data is bearish (gold drops):
If price doesn't reach the lower buy zones(3258-3223), wait for a minor rebound to short, targeting the next leg lower.
📌 Today's Suggested Trade Zones:
🔻 Sell Zones:
3378–3418
3330–3358
🔺 Buy Zones:
3258–3223
3110–3330 (ladder entries)

XAU/USD: Accumulating Strength and Awaiting a BreakthroughFrom the perspective of intraday trading rhythm, gold has continued its recent pattern. It rose sharply in the morning and then declined, fluctuated during the European trading session, and stabilized and surged during the US trading session. Based on this rhythm, today we can mainly focus on the effectiveness of the support level at $3,300. If this support level can still hold after the fluctuations in the European trading session and the price stabilizes at this level during the US trading session, one can consider going long on dips. As the consolidation period continues to lengthen and the trading range keeps shrinking, it indicates that the market is about to break the current volatile pattern. After the impact of Trump's tariff policies gradually fades away, the market is re-pricing gold, and it is inevitable that the trend will be erratic during this process.
Regarding the subsequent trend, we should focus on how gold tests the resistance levels above. Once it breaks through $3,330 and even further breaks through $3,352, it will signal that the bottom structure is becoming more stable. The current repeated fluctuations are actually about constructing a new upward support platform, laying a solid foundation for the subsequent upward trend.
Overall, there is no need to be overly concerned about the short-term fluctuations, as the overall upward rhythm of gold has not changed. Investors can closely monitor the breakthrough of key levels and seize trading opportunities.
XAUUSD
buy@3290-3300-3310
tp:3300-3340-3350
I am committed to sharing trading signals every day. Among them, real-time signals will be flexibly pushed according to market dynamics. All the signals sent out last week accurately matched the market trends, helping numerous traders achieve substantial profits. Regardless of your previous investment performance, I believe that with the support of my professional strategies and timely signals, I will surely be able to assist you in breaking through investment bottlenecks and achieving new breakthroughs in the trading field.

XAU/USD: Seize the Range, Win the VolatilityCurrently, the gold price is in a pattern of wide-range fluctuations in the short term. The resistance at 3340 above is quite prominent, and the key support level below is at 3260. During the recent volatile market conditions, it is crucial to rein in the impulse to chase rising prices and sell in a panic when prices drop.
In terms of trading operations, it is recommended to adopt the strategy of selling high and buying low within the range of 3270-3360. Do not chase long positions when the price is above 3340, and you can initiate short positions when the price rises. When the price is below 3280, do not chase short positions, and you can buy at lower prices during pullbacks. If the price effectively breaks below 3260 and stabilizes, it should be seen as a medium-term signal for going long rather than a time to exit with a stop loss.
Overall, gold still needs to digest the adjustment pressure in the short term, but the risk of a trend-driven decline is limited. It is advisable to be patient and avoid taking heavy positions to bet on the market direction. You can make trading decisions after the market direction becomes clear.
XAUUSD
sell@3330-3335 tp:3315-3310
buy@3305-3310 tp:3325-3330
Investment itself is not risky; it is only when investment is out of control that risks occur. When trading, always remember not to act on impulse. I will share trading signals every day. All the signals have been accurate without any mistakes for a whole month. No matter what gains or losses you've had in the past, with my help, you have the hope of achieving a breakthrough in your investment.

Volatile, Bearish Bias: Gold Trend Analysis & Trading TipsThe market is in a volatile trend with a bearish bias. Analysis of the gold market trend and trading suggestions
On Tuesday (April 29th), spot gold plummeted😲. Current price: 3306.49, down 1.14%. Opened at 3341.30, high of 3348.36, low of 3299.68
News in Brief
Trump's tough moves keep failing in the financial market😔. Bond market turmoil forced him to delay tariffs. Stock, bond & dollar slumps made him drop the Fed chair firing threat. His trade war "maximum pressure" strategy backfired against a major Asian nation💥. With losses piling up, he may cut tariffs. Legal battles at home are also mounting⚖️. Policy uncertainty could boost gold, but Fed rates or a soft landing might weigh on prices⏳.
Technical Analysis of Gold: After hitting 3500, gold declined😕. The current low is at 3260, which hasn't been broken in three daily trading days. With the pattern of alternating bull and bear candles, it's a clear wide-swing market😣. Don't chase trades as there's no continuity; it just moves back and forth.
On the daily chart, the trading range shifted from 3380-3260 last week to 3260-3330 but rebounded last night, returning to the wide range😲. The alternating bull-bear pattern makes the trend unsustainable these days. Today, the 5-day MA crossed below the 10-day MA, yet the opening price was above the 5-day MA, a divergence🤔. So, a downward correction was expected below 3332. Now there's a small bearish candle, and a small one with a long lower shadow may follow😏.
⚡️⚡️⚡️ XAUUSD ⚡️⚡️⚡️
🚀 Sell@3330 - 3320
🚀 TP 3300 - 3280
Accurate signals are updated every day 📈 If you encounter any problems during trading, these signals can serve as your reliable guide 🧭 Feel free to refer to them! I sincerely hope they'll be of great help to you 🌟

Let’s continue to be long on gold and keep winning!Fundamentals:
1. Focus on the performance of US economic data and the dynamics of the Federal Reserve;
Technical aspects:
At present, gold has failed to fall below the key area of 3300 many times during the retracement process, further strengthening the short-term structural support and strengthening the market's recognition of the effectiveness of its structural support. Moreover, gold may still maintain a volatile market before the NFP market. Due to the cautious attitude of the market, it is difficult for a unilateral trend to appear before the NFP market.
Short term trading strategies:
As in the two recently updated trading views, the trading strategy of long gold in the 3310-3300 area is still effective! Looking forward to gold rebounding to 3325 or even higher!

Don’t be afraid of pullbacks, we can still go long on goldFundamentals:
1. First, pay attention to the dynamics of Trump and the Federal Reserve;
2. Pay attention to whether the geopolitical conflicts escalate, including the situation between India and Pakistan, Russia and Ukraine, and the situation between the United States and Iran.
Technical aspects:
Compared with yesterday, although the bullish momentum is weak, it has not fallen below the support of the 3005-2995 area, and even failed to fall below 3000. In addition, as gold fluctuates and falls, there is a large amount of buying funds entering the market in the short term. In the recent short-term structure, gold has built a very obvious turning point near the 3300 area. Therefore, gold may still rebound to above 3330 before NFP.
Short-term trading strategy:
You can still consider continuing to go long on gold in the 3310-3300 area, TP: 3325-3335

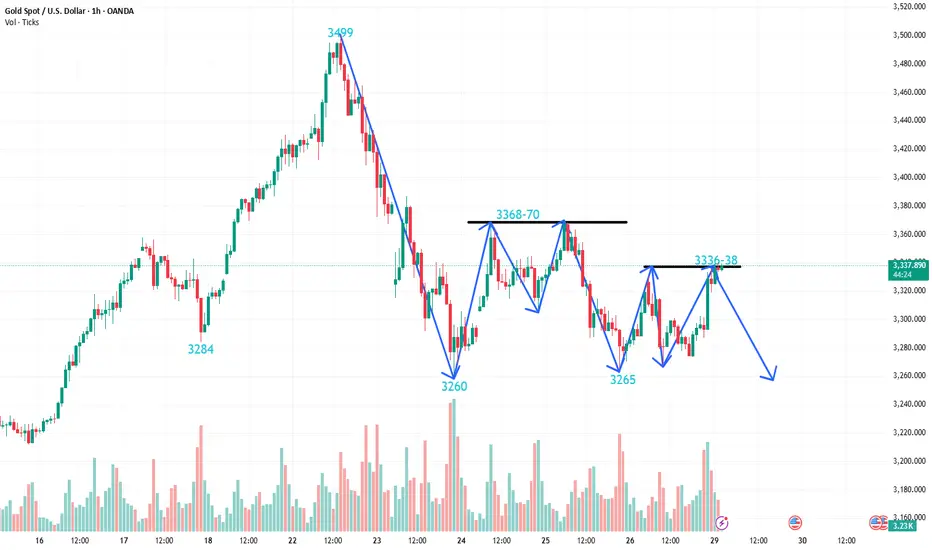
Gold Technicals Signal Range Oscillation, Bearish Play in FocusCurrently, both the bullish and bearish forces in the gold market are fiercely competing within the range of 3260-3370. The hourly chart shows a sideways trend, while the daily chart indicates a struggle around the short-term moving averages. In the early morning, the price of gold dropped to 3305 and then rebounded to 3324. The trend during the European trading session is crucial. If the weakness persists, one may consider shorting on the pullback before the US trading session. The upper resistance is at 3355-3360, and the lower support is at 3280-3275.
Technically, an embryonic head-and-shoulders bottom has formed on the hourly chart (left shoulder at 3280, bottom at 3260, right shoulder at 3265). Whether the neckline at 3370 can be broken will determine the upward trend. A W-bottom pattern is being brewed on the 4-hour chart, and its confirmation depends on whether the double-top resistance at 3370 can be broken. Otherwise, the price of gold will continue to fluctuate within the range of 3370-3260.
XAUUSD
sell@3330-3340
tp:3300-3290
Investment itself is not risky; it is only when investment is out of control that risks occur. When trading, always remember not to act on impulse. I will share trading signals every day. All the signals have been accurate without any mistakes for a whole month. No matter what gains or losses you've had in the past, with my help, you have the hope of achieving a breakthrough in your investment.

Gold prices fall under double top pressureGold closed above 3313 yesterday, and reached 3353 at the end of the trading day. Today, the gold price fell back. Currently, the gold price is under the double top pressure of 3370 above and under the multi-bottom support of 3260 below. The market outlook mainly focuses on the shock adjustment in this range. The middle track of the Bollinger band at the hourly level is around 3322, which can be used as a watershed of strength and weakness. After the gold price falls below the middle track of the Bollinger band today, it is likely to go to the lower track of the Bollinger band, and it is more likely to test the shock bottom of 3260.

Buy gold, gold is expected to rebound to the 3330-3335 zoneFundamentals:
1. First, pay attention to the dynamics of Trump and the Federal Reserve;
2. Pay attention to whether the geopolitical conflicts will escalate, including the situation between India and Pakistan, Russia and Ukraine, and the situation between the United States and Iran.
Technical aspects:
Gold rebounded and tested the area near 3353, then encountered resistance and fell back. During the decline, it stopped falling near 3305, and in the short-term structure, a triple bottom structure and an arc bottom pattern were constructed around the price of "3308-3305-3308", proving that in the 3310-3305 area, there is a large amount of buying funds entering the market in the short term; in addition, before the NFP market, it is difficult for gold to form a unilateral trend, and overall gold is still in a state of shock.
Short-term trading strategy:
It is possible to consider buying gold in batches in the 3315-3305 zone; TP: 3330-33340
OANDA:XAUUSD FOREXCOM:XAUUSD FOREXCOM:XAUUSD FOREXCOM:XAUUSD TVC:DXY

4/29 Gold Trading SignalsThe buy orders initiated around 3273 yesterday have already delivered solid profits.
After a slight rally at today’s opening, gold prices have pulled back.
Currently, the candlestick formation shows no clear directional trend, while some short-term technical indicators are pointing downward.
Before any corrective signals appear, we need to closely watch the support near 3306.
As long as this level holds, the short-term bullish momentum still has a chance to continue.
On the news side, today's scheduled data releases are of minor impact.
Focus instead on developments regarding the India-Pakistan situation and US Treasury Secretary Bessent’s press conference.
If geopolitical tensions escalate, gold may break out to new highs.
🔹 Today's Trading Strategy:
Sell within 3407-3428 zone
Buy within 3258-3223 zone
Flexibly trade between 3346-3313 / 3378-3336 / 3273-3316 zones
Please manage your positions carefully and stay alert for unexpected market moves.

XAUUSD:Reference for today's trading strategyYesterday, gold opened at $3,331 and trended downward unidirectionally until it rebounded strongly after hitting the key support around $3,260. The upward momentum continued at night, surging to $3,353 and then pulling back slightly, closing at $3,343. This morning, it opened flat at $3,343, quickly came under pressure, and entered a deep correction. Now it's fluctuating narrowly around $3,310 with bulls and bears in a stalemate.
From a comprehensive analysis of technicals and market sentiment, though bulls are active and have the momentum to challenge the $3,370 resistance, due to the upcoming NFP data, market wait-and-see sentiment is strong and volatility has increased notably. Historical data shows gold prices often fluctuate sharply before major economic data releases to digest risks in advance.
Considering the current K-line pattern and volume changes, it's likely that gold will experience a deep correction and retest the $3,260 support before breaking through the $3,370 resistance. This "accumulating strength through correction" can relieve profit-taking pressure and build up momentum for a future breakout.
Given the increased market uncertainties, today's trading strategy suggests being cautiously bullish and strictly controlling risks. Investors should set stop-losses rigorously to guard against sudden sharp fluctuations before the NFP release. Also, avoid aggressive bottom-fishing, closely monitor the market, and wait for price stabilization or clear technical signals before entering the market.
XAUUSD
buy@3280-3260
tp:3330-3350
In the future, we will continue to monitor the market changes and update the trading strategies in real time.
I am committed to sharing trading signals every day. Among them, real-time signals will be flexibly pushed according to market dynamics. All the signals sent out last week accurately matched the market trends, helping numerous traders achieve substantial profits. Regardless of your previous investment performance, I believe that with the support of my professional strategies and timely signals, I will surely be able to assist you in breaking through investment bottlenecks and achieving new breakthroughs in the trading field.

Short-selling StrategiesI. Analysis of Market Conditions
The current chart shows a range-bound oscillation pattern. After the previous decline, there has been repeated contention between bulls and bears. There is no one-sided trend, making trading judgment difficult. 📊
II. Short-selling Strategies
Levels: It is recommended to go short in the range of 3380 - 3360 - 3340. This is at the upper edge of the oscillation range, with strong resistance. It is difficult for the price to break through and is likely to decline. 📉
Background: The non-farm payrolls data is about to be released, increasing market uncertainty. Funds may withdraw or take short positions, and the price may decline to squeeze out the bubbles. 📅
III. Long-buying Strategies
The support at 3265 has been verified several times, indicating strong buying power from bulls. When the price retracts to around this level, you can consider going long. If the price breaks below this level, be vigilant about a trend reversal and set a stop loss in a timely manner. 📈
⚡️⚡️⚡️ XAUUSD ⚡️⚡️⚡️
🚀 Sell@3360 - 3340 -3320
🚀 TP 3300 - 3280 -3265
Accurate signals are updated every day 📈 If you encounter any problems during trading, these signals can serve as your reliable guide 🧭 Feel free to refer to them! I sincerely hope they'll be of great help to you 🌟

XAUUSD LONG SIGNALUnder current market conditions, the area near 3315.25 has been identified as a critical support zone, where the AI model detects a high-probability trade setup.
From a technical perspective, a clear directional bias based on recent price action patterns. Suppose the market demonstrates increased volume and price stability above key moving averages in the 3315.25 area. In that case, traders are advised to monitor for trend-continuation entry opportunities in alignment with the prevailing momentum.
Profit targets are defined at 3352.88 and 3401.74, corresponding to logical technical resistance zones. These levels are designed for staged profit-taking across different trade management styles. Stop-loss should be strictly enforced at the designated level; once breached, the strategy is considered invalidated in order to limit potential downside.

Gold has the potential to rebound towards the 2338 "Gold has the potential to rebound towards the 2338 area, but first, a correction to the 3212–3293 range is needed to create a strong momentum for further upward movement."
Today's Scenario: XAUUSD Trading Strategy Around the Key Price Zones
🔻 Sell XAUUSD around 3338
Stop Loss: 3346
Take Profit 1: 3328
Take Profit 2: 3218
Take Profit 3: 3212
🔺 Buy XAUUSD around 3212
Stop Loss: 3200
Take Profit 1: 3218
Take Profit 2: 3225
Take Profit 3: 3230
Note: Always set a Stop Loss in every trade to manage risk and protect your capital.

Gold trend picks directionGold fell by 230 USD in a row on the daily line. Currently, 3500 is under short-term pressure. Today, we will focus on the continuity of the decline. It directly rushed from 3288 to 3310 in 5 minutes after opening. Yesterday, it hit the lowest point of 3258 above the 0.5 division of 2956-3500. This position is temporarily supported and rebounded, but whether the adjustment is over is still uncertain. It depends on the intraday closing pattern. If today's closing can stand above the MA5 daily moving average resistance of 3358 again, then there will be signs of the end of the downward adjustment, and the next day must be accompanied by a positive line. Pull up; on the contrary, if it closes below the 5-day MA, then there is a high probability that the 10-day moving average position will continue to decline, and then the 50-division position 3228 is further down, which happens to be the starting point of the big positive on April 16. This is likely to be the end point of this round of adjustment, or there will not be much room to go down, because from the standard wave pattern, it cannot fall below the first wave high, which is 3167, which is also the current middle track; therefore, either 3228 will stabilize on dips, or somewhere in the 3228-3167 area will stabilize, and then finally return to the bullish trend and pull up
The short-term 4-hour middle track 3380 has been lost and has become a key counter-pressure point. As long as it does not stand above it again, it will maintain a downward correction. After breaking 3292 below, the 66-day moving average of 3260 will be the loser or loser; the 1-hour K-line is under pressure from ma10 and ma5 and continues to fall. After yesterday's consolidation and pull-up, the K-line has now re-run above ma10, and the macd has formed a golden cross below the zero axis. This wave of 200 US dollars of rapid decline has almost corrected most of it. If it continues downward for another wave, or with the help of bottom divergence, it will slowly brew a short-term bottom; today's gold rebound focuses on the resistance below 3367, below the extreme middle track of 3380, and it is still bearish if it cannot withstand the pressure. If the strong support of 3260 or 3245-28 is stable, we will start to consider bottom-fishing.

Gold 100% Profit SignalFrom the current 4-hour analysis, the short-term pressure on gold is 3343-50, and the important pressure on 3360-66. The operation is still mainly short-selling if the rebound does not break. Below, we first pay attention to the short-term support of 3310-15, and the important support of 3260-68.
Gold rebounds to 3343-50 line short, rebound to 3360-66 line to cover short, stop loss 3372, target 3310-3315 line, continue to hold if it breaks

Gold market analysis referenceThe recent gold fluctuations are really violent and fast. If you hesitate for a moment, you will basically miss the market. If you are too impatient, you will easily hit the stop loss. Now the fluctuations in a few hours are equivalent to the fluctuations in the past month. The stop loss of 3-5 US dollars can be easily swept. The market is changing, and the corresponding stop loss should also be enlarged.
Gold opened higher and hit 3336 in the morning on Monday, continuing the decline of last week. The idea in the morning was to be bearish directly at the analysis point of 3332. After hitting the lowest point of 3268, it fluctuated upward. The European session also fell to 3273 and then rebounded. The highest point in the US session just reached 3336 again, a standard bottoming and rebounding trend. Since it is an adjustment structure, let's re-analyze the idea. The gold price fell at 3500 and rebounded at 3260 last Wednesday. The rhythm was volatile. It rebounded above 3260 many times below, and did not cross the first rebound high of 3367 above. From a technical point of view, the gold price needs to effectively fall below the 3265-3260 US dollar range in the short term before it can confirm a larger correction downward. Once it is confirmed to fall below, the gold price may quickly fall to the 50% retracement level near 3225 US dollars, further pointing to the 3200 US dollar mark. If it loses 3200 US dollars, it will suggest that gold may have peaked in the short term.
For the current gold, the 4-hour chart is stuck in a wide range of oscillations between 3260-3338, and is currently at the edge of the lower track. Gold has formed a multi-round back-test support area at the 3270 price level. Although the price has touched this level several times, it has not effectively broken down. The bulls have launched a phased counter-attack. In terms of technical form, the double pressure characteristics have appeared near the previous rebound high of 3370. This area has the dual attributes of the second wave rebound target and the right shoulder pressure level of the head and shoulders top pattern. Today, we mainly focus on the closing price. If it stands firmly at the 3336 line, then we will adjust our thinking tomorrow. On the contrary, it encounters resistance at the high point of today's morning session at 3336 and then falls back, and goes to the 3278 line. Tomorrow we will continue to look at the idea of swinging and falling. On the whole, today's short-term operation strategy for gold is recommended to be mainly short-selling on rebounds, supplemented by long-selling on pullbacks. The short-term focus on the upper side is the 3338-3340 line of resistance, and the short-term focus on the lower side is the 3265-3260 line of support.
Strategy 1: When gold rebounds to around 3338-3340, short sell (buy short) in batches, 20% of the position, stop loss 6 points, target around 3300-3280, break to 3270
Strategy 2: When gold falls back to around 3265-3270, buy (buy up) 20% of the position in batches, stop loss 6 points, target around 3300-3320, break the position and look at 3330
Gold 100% Trading StrategyGold prices continued to fluctuate this week. Last Thursday, gold prices stabilized and rebounded near $3,284, and remained strong after breaking through $3,300. During today's Asian session, gold prices repeatedly hit the 3,385 pressure level but failed. After retreating to around 3,369 and gaining support, they rebounded again to around 3,396. The current price faces technical repair needs, but the overall upward trend has not changed, and the probability of breaking through the $3,400 mark is still high. The support level of the retracement is focused on the Asian session low of 3369 US dollars and the 4-hour MA5 moving average of 3360 US dollars. You can arrange long orders on dips; the upper pressure focuses on the 3396-3400 line. After breaking through, you need to be alert to the pressure of the daily error band indicator of 3425-3430 US dollars. At present, you can go short at the rebound of 3395 in the short term. The general trend is still dominated by low and long.
Gold recommendation: Go short near the rebound of 3395-3400, stop loss 3405, target 3370, strict stop loss for large fluctuations
Gold operation: Go long near the retracement of 3370-3375, stop loss 3362, target 3400, strict stop loss for large fluctuations

Gold 100% Profit SignalGold has retreated from $3,500, is the price near a top? Possibly. But I wouldn't sound the alarm bells just yet. This is most likely due to some regular profit-taking. The high indicators are more of a warning than a call to arms. Rather than "get out of here," it's more of a "stay alert."
At present, the initial support below is in the 3405-3400 area. Further down are the two key support levels of 3380 and 3357. 3380 is the support level near the middle track of the 4-hour level, and 3357 is an important top and bottom conversion position in the previous period. These two positions still provide strong support for the future market rise. At present, the 4-hour level high has closed in a bearish pattern of Yin engulfing Yang engulfing, and the K-line is negative. The short-term is expected to improve and fall back. Short-term operations will mainly rebound from high altitudes. Pay attention to the resistance near 3435 and 3450 on the top and do not break the air. Pay attention to the support near 3408-3400 on the bottom. If it breaks, adjust the position and continue to look at 3380.
