GOLD Analysis - Can buyers push toward 3,410$?OANDA:XAUUSD is trading within a clear ascending channel, with price action consistently respecting both the upper and lower boundaries. The recent bullish momentum indicates that buyers are in control, suggesting there's chances for potential continuation on the upside.
The price has recently broken above a key resistance zone and now came back for a retest. If this level holds as support, it would reinforce the bullish structure and increase the likelihood of a move toward the 3,410 target, which aligns with the channel’s upper boundary.
As long as the price remains above this support zone, the bullish outlook stays intact. However, a failure to hold above this level could invalidate the bullish scenario and increase the likelihood of a deeper pullback.
Remember, always confirm your setups and use proper risk management.
Xauusdlong

Gold XAUUSD Possible Move 9th May 2025🟨 XAUUSD (Gold) Analysis – 09 May 2025
Market Structure Overview:
The market was previously in a bearish trend, forming consecutive Lower Lows (LL) and Lower Highs (LH).
A bullish shift in structure occurred when price formed a Higher Low (HL) followed by a Higher High (HH), breaking and closing above the previous Lower High.
This break of structure signals a potential trend reversal or deeper pullback in progress.
Key Levels:
Support Zone (Demand): Around 3,315 – 3,325 (recent breakout zone and potential retest area).
Resistance Zone (Supply): Around 3,365 – 3,375 (previous structural HH + liquidity pool).
Expectations:
If price sustains above the 3,315–3,325 support zone, we expect a continuation to the upside targeting the 3,365–3,375 supply zone.
If price fails to hold above support, a rejection and continuation to the downside toward 3,280 is likely.
🔔 Trading Signal (Setup Idea):
Type: Buy (Conditional)
Entry:
Buy on confirmation from support (e.g., bullish engulfing, FVG, or sweep + bullish structure) around 3,320–3,325.
Stop Loss:
Below the swing low or invalidation level: 3,310
Take Profit:
TP1: 3,340 (minor resistance)
TP2: 3,365–3,375 (major supply zone)
Risk/Reward: Minimum 1:2 RRR
Confirmation Tips:
Look for bullish price action at the support zone (e.g., bullish pin bar, demand FVG, CHoCH).
Use volume, OBV, or momentum divergence for additional confirmation.
Show support by following, comment and sharing.

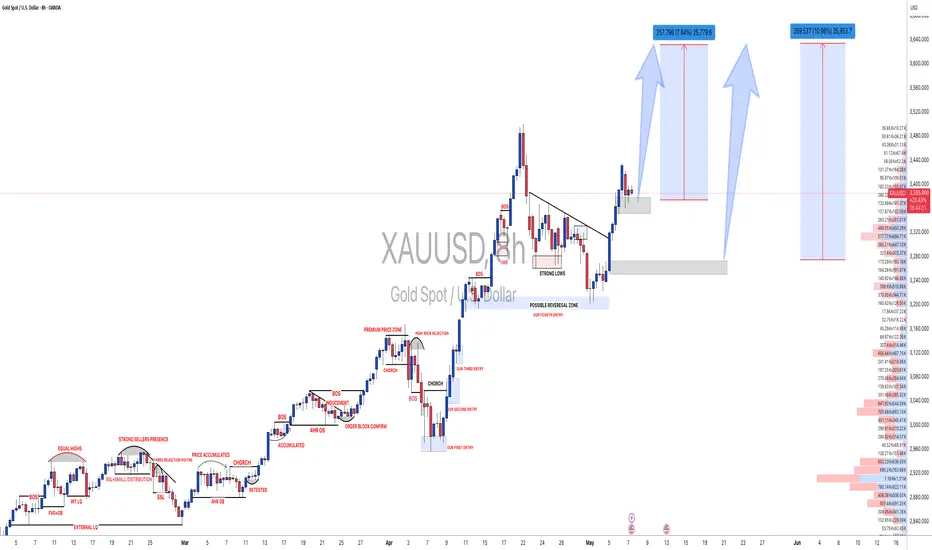
#XAUUSD: Gold to continue rising,$4000 by end of the year targetGold has unexpectedly declined to 3335 in response to the anticipated price increase following the unfolding conflict in Asia. Currently, two regions exhibit price reversals.
The XAUUSD price is progressing in accordance with our previous analysis. Both analyses have successfully reached the take-profit target, and we anticipate further bullish momentum in the near future. However, price movement is subject to potential reversals in two areas. Both targets are long-term oriented, indicating potential swing moves that may take time to complete. Stop-loss, intraday target, and position decisions should be based on individual analysis and overall market assessment. Strong fundamentals are essential for price to reach the designated target area.
We acknowledge our bias in this analysis, but it does not guarantee the realisation of the described outcome.
Upon trade activation, you can establish two targets. You have the flexibility to select your own take-profit based on your analysis and trade management strategies.
We appreciate your unwavering support.
For those who wish to contribute, we offer several avenues for assistance:
- Liking our ideas
- Commenting on our ideas
- Sharing our ideas
Thank you for your continued support.
If you feel inclined, we would be grateful for your generosity.
Best regards,
Team Setupsfx_❤️🚀

XAU/USD: Euro Session Trend Dictates Evening MovementYesterday, gold rose sharply and then fell back. In the early trading, it declined from $3,415. In the evening, after rebounding to $3,369, it continued to decline. By the end of the trading day, it broke below $3,320 and dropped to $3,288. Both the decline in the early trading and the subsequent rebound touched the 0.764 Fibonacci level. The conversion between the top and the bottom formed support, and in the afternoon trading, it rebounded above $3,330, indicating that the rebound trend may not have ended.
According to the recent market pattern, the price often hits new highs or lows. The four-hour candlestick chart closed with a medium bullish candlestick and recovered the lower band. It is expected that during the European trading session, the price will rise first and then fall. If it fails to rise, there is a high probability that the price will go up in the evening.
XAUUSD
sell:3345-3355
tp:3305-3295
sl:3362
I am committed to sharing trading signals every day. Among them, real-time signals will be flexibly pushed according to market dynamics. All the signals sent out last week accurately matched the market trends, helping numerous traders achieve substantial profits. Regardless of your previous investment performance, I believe that with the support of my professional strategies and timely signals, I will surely be able to assist you in breaking through investment bottlenecks and achieving new breakthroughs in the trading field.

XAU/USD - Fed warns of Economic UncertaintyThe XAU/USD pair on the M30 timeframe presents a Potential Buying Opportunity due to a recent Formation of a Bullish Flag Pattern. This suggests a shift in momentum towards the upside and a higher likelihood of further advances in the coming hours.
Possible Long Trade:
Entry: Consider Entering A Long Position around Trendline Of The Pattern.
Target Levels:
1st Resistance – 3473
2nd Resistance – 3519
🎁 Please hit the like button and
🎁 Leave a comment to support for My Post !
Your likes and comments are incredibly motivating and will encourage me to share more analysis with you.
Best Regards, KABHI_TA_TRADING
Thank you.

Gold head and shoulders bottom trend, bull market strong?🗞News side:
1. Tariffs push up inflation and slow down the economy, and the Federal Reserve may be in trouble
2. The situation between India and Pakistan escalates again
📈Technical aspects:
At the hourly level, today's Asian session continued the "wash-out" operation characteristics, quickly rising by 20 US dollars at the opening, and then stepped back to 3310 to confirm the top and bottom conversion support level. The two positive lines seemed to form a "yang-enclosing-yin" upward attack pattern, but suddenly reversed, not only breaking the trend support line of 3280, but also falling to 3274 before bottoming out and rebounding. This erratic trend has a significant long-short double kill effect for investors accustomed to trend continuation strategies. However, we can accurately find the right position in the market to trade and make profits.
At present, it is expected to form a "head and shoulders bottom" pattern from a morphological perspective, accumulating momentum for subsequent rises, and there is still room for upside in the short term. At present, any pullback is an opportunity for us to go long. Pay attention to the 3360-3370 line suppression on the top. If this resistance area is broken, it may open up a new round of upward space.
TVC:GOLD FOREXCOM:XAUUSD FXOPEN:XAUUSD TVC:GOLD FX:XAUUSD OANDA:XAUUSD

Gold operation strategyFrom the 4-hour analysis, the support below is around 3300-08. If it does not break, continue to be bullish. Pay attention to the short-term suppression of 3360-66 above. If the daily level stabilizes above this position, continue to maintain the low-multiple rhythm.
Gold operation strategy:
1. Go long when gold falls back to 3320-25, and cover long positions when it falls back to 3300-10, stop loss 3297, target 3355-3360, and continue to hold if it breaks;

Gold falls, can it continue to fall before closing?Gold still fell in the morning, but it made a V-shaped reversal after bottoming out and rebounding, slightly breaking the morning high of 3323 and touching the pressure line of 3330. This trend is very subtle, which means that the support here is strong at 3274. You can be bearish but not too bearish. Focus on the support line of 3300 and see the rebound strength of the European session. If the European session stands on the pressure line of 3330, then consider shorting around 3360 in the evening, and the US session will be volatile. If the rebound strength of the European session is limited and it is always suppressed below 3330 and goes sideways, then you can continue to be bearish directly, and the support below is 3270-3253. If it breaks above 3330, then you have to pull back and do more.

Special attention needs to be paid to gold operations on FridayThe current price fluctuates around the 3300-3348 range, with resistance at 3348-3352 and support at 3295-3303. If it breaks through 3348, be wary of a second surge to around 3365; conversely, if it loses 3295, it may fall back to the 3275-55 area.
Gold recommendation: short sell near 3335-3345 when it rebounds. Target position 3320-3310.

View on the short-term trend of gold!📌Fundamentals:
Gold prices fell sharply. After Trump announced a "breakthrough" trade deal with the UK, market expectations for more similar deals increased, weakening gold's appeal as a safe-haven asset.
📊Technological aspects:
Gold quickly fell in the Asian session and then quickly stretched back up. As of now, it has stood above 3320. So the possibility of gold falling again is relatively small. And there is a possibility that gold will further hit Thursday's high of 3360-70. If 3202 to 3435 is regarded as wave a, then 3438 to today's low of 3275 is wave b. So the current rebound from 3275 will go up in wave c. The first suppression position above is 3360-70, the high point of yesterday's rebound. At present, gold has stabilized above 3320, so the next bullish target for gold is to test 3360-70. After the pressure appears, follow the trend and go short.

Should we go long on gold when it falls back?From a technical point of view, the daily line has been in negative trend, which is definitely weakening. Whether the market will continue in the future needs to be observed. If it is established, the lower side may be seen at 3260 and 3200, but if the daily line is positive on Friday, it can also turn strong at any time. After all, the current price is just near the middle track of the daily Bollinger, and both rise and fall are possible.
In the 4-hour cycle, we should pay attention to today's closing situation. The price is temporarily around 3300. If it continues to fall, the lower track of Bollinger will open, which may form a unilateral trend, rebound, and Bollinger will close, and it will rise strongly again. Therefore, it is not easy to say the specific rise and fall situation for the time being. It is recommended to observe more to see whether the Asian and European sessions break the new low of 3288, and the upper pressure is 3350 and 3370. In the morning, gold rose first and then fell, and it was quite fierce. It is recommended not to chase orders. Pay attention to the support of 3288 first. If it does not break, try to go long. If it breaks, it will go to the low point of 3260. It is expected that gold will have another wave of rising space on Friday.

Tariff War Easing Signals: Gold Trend Analysis for Next WeekSince the issue of tariffs broke out, the development of the situation has not been in line with the expectations of the US government. In the face of the escalating trade frictions, the senior officials of the United States have released signals of easing through multiple channels and repeatedly expressed their willingness to hold negotiations with China on issues such as tariffs. After a prudent assessment, China, proceeding from the overall situation of maintaining the stability of bilateral economic and trade relations and promoting the healthy development of the global economy, has decided to engage with the United States.
In fact, there are no real winners in the ongoing standoff of the tariff war. As the world's two largest economies, only by reaching a relatively appropriate solution through negotiation can the fundamental interests of both China and the United States be met. This positive development is bound to significantly reduce the market's risk aversion sentiment. As a traditional safe-haven asset, the price of gold will also be under downward pressure accordingly.
From the perspective of technical analysis, the weekly chart of gold shows that although there was a strong upward pull at the beginning of this week, the daily chart has formed a "big yang front resistance line" pattern. This classic technical pattern indicates that the bullish momentum is close to exhaustion, and the subsequent downside risks have intensified. It is expected that the price of gold will further decline next week. The first support level should be focused on around $3,270. If this level is broken, the price of gold may continue to decline and seek support at the $3,200 level. Investors need to closely monitor the progress of the China-US negotiations and the dynamics of the gold market and adjust their investment strategies rationally.
I am committed to sharing trading signals every day. Among them, real-time signals will be flexibly pushed according to market dynamics. All the signals sent out last week accurately matched the market trends, helping numerous traders achieve substantial profits. Regardless of your previous investment performance, I believe that with the support of my professional strategies and timely signals, I will surely be able to assist you in breaking through investment bottlenecks and achieving new breakthroughs in the trading field.

Gold falls under pressureAlthough gold surged in the morning, it continued to fall in the afternoon and fell to 3320. Currently, gold rebounded moderately, but it is still under pressure after the sharp drop. The adjusted golden section line position, the 0.5 position of this wave of decline is the 3320-3318 area. The price bounced when it was touched for the first time. Going down, we need to pay attention to the 0.618 position 3288 area, which is close to the four-hour lower track 3284 area. The two together become the support area. The excess range is the double-line lower track 3270 on the hourly chart. Tonight, it is still a rebound to short, and pay attention to the 3370-74 line resistance situation above.

The latest ideas on gold.Gold prices are still in a long-term bullish trend, and recent operations still maintain the idea of buying on dips; in the medium term, it may fluctuate at a high level, and mid-term operations need to be treated with caution. With the short-term rise in the European session, gold is waiting for a decline to go long.

On May 9, the London market XAUUSD real-time trading strategyXAUUSD's huge drop hit 3274. From the side news, there is no huge potential impact. Because almost all important data are updated. From the larger level of K-line cycle, the top structure appears, which is why I remind everyone to continue to sell.
In the trading process, it is very important to switch from long to short. Often some traders always suffer huge losses in their accounts due to misjudgment. This week, under my accurate prediction, the market trend is exactly the same as I expected.
Summary: There is no major news affecting the current situation. And it is the last trading day of this week. For XAUUSD, maintaining high selling is the current trading direction. There are signs of returning to the weekly opening price at the daily level. Observe whether the pressure range of 3330-3340 can stabilize during the day. If not, we can focus on the lower profit range. 3260-3220.
To prevent missing out on some good trading strategies and ideas, remember to continue to pay attention to the ideas of the swing trading center. If you want to get more and more accurate signals, you can leave me a message.

#XAUUSD: Price to go beyond $3650 to $3700 around 3500 pips moveThe XAUUSD price is moving nicely as we had predicted in our previous analysis. Both of our analyses have hit the take-profit target, and we are likely to see more bullish momentum continue in the coming time. There are two areas where price could move or reverse. Both targets have a long-term view, which means we are talking about a possible swing move that will take time to complete. Stop-loss and intraday target and position can be taken based on your own analysis and overview. Strong fundamentals are needed for price to reach our designated target area.
Good luck and trade safely. Trading financial instruments like gold and other markets brings extreme risk and can be severe if the risk is not managed correctly.
We are sharing our bias here, but it does not guarantee that the move will happen as described.
Once the trade is activated, you can set two targets. You can choose your own take-profit based on your analysis and trade management.
Good luck and trade safely! 😊
Thanks a bunch for your unwavering support! ❤️🚀
If you’re feeling generous, here are a few ways you can help us out:
- Like our ideas
- Comment on our ideas
- Share our ideas
Cheers,
Team Setupsfx_
❤️🚀
XAUUSD Take ProfitThe gold trade I just shared delivered great profit and helped me hit my daily profit target in a single trade :)
So, gold ended up being both the first and last trade of the day.
Tomorrow is the weekend and the FX market will be closed, but as always, the crypto market stays open.
Hopefully, BTC will offer some good opportunities tomorrow :))
Wishing everyone a great weekend!

5/9 Gold Trading SignalsLong time no see, my friends! My holiday trip is about to end. I attended two weddings during this trip, which was unforgettable! I hope that everything goes well for everyone during my absence!
Gold has risen recently and returned to above 3400 again. Although it has fallen back in the past two days, the current technical level shows that the bulls are not over yet! This means that if there are friends who buy at high prices, they will have a chance to get out of trouble without doing other operations!
From the current pattern, it is in the stage of triangle consolidation. It is necessary to pay attention to the resistance of the 3360-3382 range. If the price falls under pressure at this position, we need to observe the support of the 3300-3280 range to determine whether it can form a short-term double bottom pattern or a head and shoulders bottom pattern again, so as to support the bulls to run again.
Based on the above analysis, today's trading suggestions:
Sell in the 3364-3386 range
Buy in the 3318-3302 range
Flexible trading in the 3323-3362 range

Gold long and short repeated operation
📌 Negative driving factors
Gold prices fell below $3,320/ounce on Thursday as the US-UK trade agreement improved risk appetite. Gold fell nearly 4% in two days as the US-UK agreement boosted risk appetite and demand for the US dollar.
📊Comment analysis
Gold fell directly at the opening of the Asian session today, and did not provide a good position for short selling. However, it rebounded and rose later, regaining its footing at 3,330. The short-term price fluctuated between long and short.
💰Strategy Package
🔥Sell Gold Zone: 3351-3353 SL 3358
TP1: $3340
TP2: $3330
TP3: $3320
🔥Buy Gold Zone: $3232 - $3234 SL $3227
TP1: $3245
TP2: $3260
TP3: $3270
⭐️ Note: Labaron hopes that traders can properly manage their funds
- Choose the number of lots that matches your funds
- Profit is 4-7% of the capital account
- Stop loss is 1-3% of the capital account

Gold 100% Profit SignalYesterday, gold surged and then fell. It was under pressure at 3415 in the early Asian session, and short orders were entered at 3413.6. After rebounding to 3369 in the European session, it was under pressure again, and short orders followed up at 3368.5. The overall trend continued to be extremely weak, breaking 3300 in the late trading and accelerating to 3288. It rebounded to above 3300 in the early morning, and the daily line closed with a long lower shadow positive line, indicating that short-term support is effective, but the rebound momentum is suppressed by the previous wave trend. The current gold price is fluctuating in the 3300-3348 range, with upper resistance of 3348-3352. If it breaks through, be alert to a second surge to 3365; the lower support is 3295-3303. If it loses or falls back to the 3275-3255 area. Trading needs to keep a close eye on the dynamics of key positions.
Operation strategy:
1. It is recommended to short gold when it rebounds to 3340-3345, with a stop loss at 3353 and a target of 3320-3300

Gold Eyes Upside Break – Bullish Outlook for Swing TradersGold (XAUUSD) continues to show strength on the 4-hour chart, maintaining its bullish structure and offering a compelling opportunity for swing traders. The market has recently rejected a key support zone, confirming buyer interest and momentum continuation.
Key Technical Observations
Support Zone Rejection: Price strongly rejected the $3,199–$3,265 support zone, forming a clear bullish response. This zone also coincides with the rising trendline, adding strength to the support.
Trendline Confirmation: The dotted green ascending trendline has been respected multiple times, reinforcing the ongoing uptrend.
Consolidation Breakout: After consolidating for nearly 3 days, price broke above the range, confirming bullish intent.
All-Time High Target: The next major resistance lies near the all-time high at $3,504, which acts as the primary upside target.
Trade Setup
Entry Level: $3,338 (after breakout from consolidation)
Take Profit (TP): $3,504
Stop Loss (SL): $3,265
Risk-Reward Ratio: Approximately 2.28
Gold is clearly bullish on the 4-hour timeframe. The trendline bounce, support zone defense, and breakout from consolidation provide a solid basis for swing traders aiming to capture a move toward the all-time high. As long as price remains above the $3,265 level, bullish positions remain valid.

#GOLD this is the expected next rallyas long as gold held 3277
we gonna see a move like that drawn on the chart
with first target to be 3600
if gold broke 3277 we gonna shift to the bearish scenario
follow for more....
and trade safe

Gold's decline under pressure is in line with expectations!From the perspective of the gold hourly line, the morning closed with a full sun, effectively breaking through the resistance of yesterday's 3360-3397 box. Therefore, it is definitely necessary to try to confirm the continued bullish trend after a pullback. The continuous diving in the afternoon refreshed the intraday low, which can only mean that the market is washing out, and all the long and short positions are driven out, and then brewing again; If the European session remains weak below 3350, there may be some room for further decline tonight, but the continuity may not be great, and it is easy to stabilize and bottom out and pull up; the current support is 3320, 3315, and 3305. If a stabilization signal is touched around 22:00, it is bullish. I personally think that there is limited space below 3300, and resistance is 3360, 3365, and 3370. If a pressure signal is touched around 20:00, it will fall back first; if it returns to above 3370, the trend will gradually become stronger, and it will be treated as a wide range of fluctuations for the time being;
On the whole, today's short-term operation strategy for gold is to short on rebounds and long on pullbacks. The short-term focus on the upper side is 3370-3375 resistance, and the short-term focus on the lower side is 3280-3290 support. Friends must keep up with the rhythm.
Short order strategy:
Strategy 1: Short 20% of the gold position in batches when it rebounds to around 3365-3370, stop loss 10 points, target around 3330-3305, and look at 3290 if it breaks;
Long order strategy:
Strategy 2: Long 20% of the gold position in batches when it pulls back to around 3285-3290, stop loss 10 points, target around 3310-3330, and look at 3350 if it breaks;
