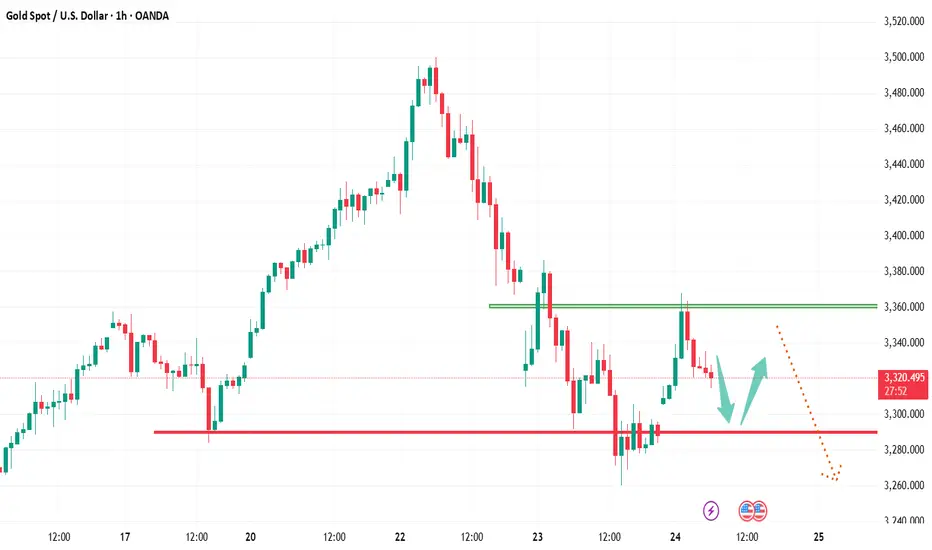
#XAUUSD :Is it a Correction Or a start of Major Bearish Trend? Gold has plummeted from 3550 to 3270, and it’s been falling steadily. We firmly believe that the price could reverse from either of our entry points, but given its significant drop, it raises concerns among traders. If the trend has shifted to bearish, it will likely continue to target buyers’ stop losses. In these market conditions, we strongly advise trading with utmost caution and prioritising risk management.
Good luck and trade safely.
Thanks for your support! 😊
If you want to help us out, here are a few things you can do:
- Like our ideas
- Comment on our ideas
- Share our ideas
Team Setupsfx_
❤️
Xauusdlong

XAUUSD TRIANGLE PATTERN IN 30-MI Created This XAUUSD Chart Analysis In 30-M Tf
Entry: BUY from 3338
Support zone : 3334
Target Will Be : 3370
NOTE : XAUUSD MADE TRIANGLE PATTERN SO THIS ANALYSIS IS BASED ON PERSONAL ANALYSIS FOR LEARNING PURPOSES. PLEASE USE PROPER RISK MANAGEMENT

How to break through the heavy pressure from above?From the analysis of the 4-hour line, today's support is around 3300-3310. If it falls back during the day, you can buy more once before rebounding. The upper short-term resistance is around 3340-3356, and the focus is on the suppression of 3380-90. The overall support is to maintain a wide range of long and short fluctuations in this range. In the middle position, watch more and move less, and follow orders cautiously, and wait patiently for key points to enter the market.
Gold operation strategy:
Gold rebounds at 3340 and goes short, rebounds at 3360 and covers short positions, stops at 3367, targets 3300-3310, and continues to hold if the position is broken;

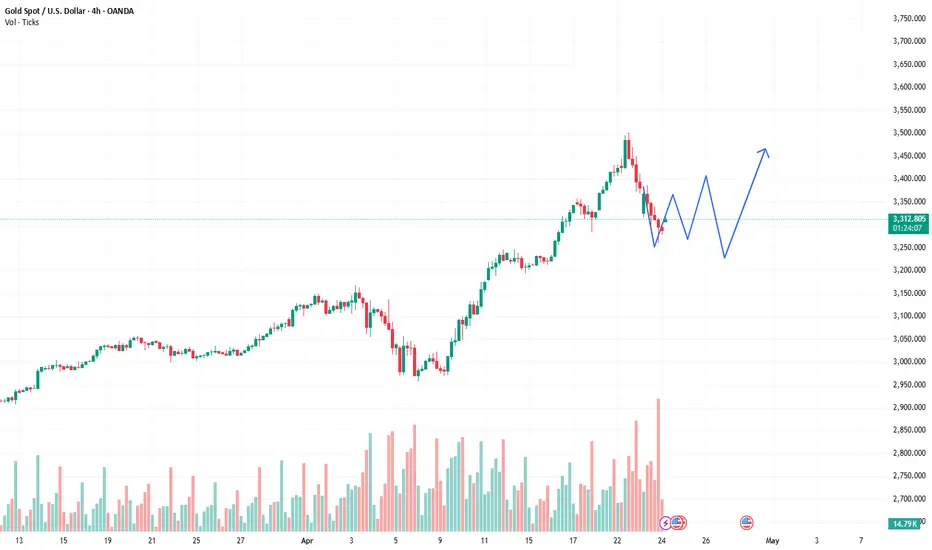
XAU/USD Gold Trade Plan 24/4/2025XAUUSD (Gold) Trading Outlook:
Buy Entry: $3,325
Key Support Zones: $3,260 and $3,200
Market Scenarios:
Bullish Scenario:
If XAUUSD sustains above the $3,260–$3,200 support zone, the bullish structure remains intact. A rebound from this zone may offer a buying opportunity with an upside target of $3,500.
Bearish Scenario:
If the price breaks below the $3,200 support level and falls through the channel, it may signal a bearish trend continuation, suggesting potential downside movement.

Gold short-term adjustment riskTechnical analysis of gold: The strong rise of gold in the early trading session is indeed a bit surprising. We have to think about whether gold has reversed? Or is it just a rebound? However, gold is under pressure from the moving average resistance, and the sharp rise in the early trading session is often easy to rush high and fall back. Gold 3365 continues to be short, and it falls and harvests as expected. Now it seems to be just a rebound, but the rebound is a little larger.
From the daily level, gold rose strongly during Tuesday's trading, touched the key price of 3500, then fell under pressure and finally closed with a negative line. This trend of rushing up and falling back shows that the upper selling pressure is heavy, and the bulls are strongly blocked by the bears at high levels. Immediately afterwards, gold continued to fall on Wednesday and closed with a negative line again, forming a technical pattern of two consecutive negative lines. This continuous decline further confirms that the short-term bears dominate.
From the 4-hour gold chart, the price of gold has been fluctuating and falling since it was under pressure at the 3500 level. The current price has fallen back to the 3260 level, with a short-term decline of 240 US dollars. Although there is a rebound during the day, the upward trend is currently destroyed. The MACD indicator has issued a death cross change signal, suggesting that the correction trend may have started. Pay attention to the pressure effect of the 3368 level during the day. For the current market, the rebound is just a flash in the pan, and gold has rebounded again, reaching a maximum of 3367 before retreating. It is currently maintained at around 3330. In fact, the market is currently at a loss for long and short positions, and is unable to withstand its huge fluctuations. For the morning's high and fall, we support it according to the shock retracement. If the European session rebounds again near 3358-60, continue to try to short, the target is around 3320-10, and the loss is 3370. The market amplitude is so drastic that I need to strictly implement good operating habits, try with a light position, strictly stop loss, and don't have a fluke mentality! On the whole, today's short-term operation strategy for gold is to short on rebounds and to buy on pullbacks. The short-term focus on the upper side is the 3368-3370 line of resistance, and the short-term focus on the lower side is the 3260-3285 line of support.
Short order strategy:
Strategy 1: When gold rebounds around 3358-3360, short sell (buy short) in batches, 20% of the position, stop loss 6 points, target around 3320-3300, break the position and look at 3260
Long order strategy:
Strategy 2: When gold falls back to around 3260-3265, buy long positions in batches (buy up) of 20% of the position, stop loss 6 points, target around 3300-3330, break the position and look at 3350

Gold stopped falling and stabilized and reboundedIn terms of market conditions, yesterday there was another big drop, from 3386 to 3260, with a total drop of 126 US dollars. This is the power of Trump's speech on reducing tariffs. Gold prices rise and fall as soon as he opens his mouth. Sometimes I really doubt whether he, a businessman, is investing. There may be a group of people around him who know his speech in advance and wait for the capital market to make money.
Back to the point, the entire decline of gold from 3500 to 3260 reached 240 US dollars, which took only two days. While the price fell, it brought about the correction of technical indicators, especially the daily line just stepped back on the short-term moving average, and the hourly line and the 4-hour cycle showed a healthy state. The market returned to the technical trend, but the current high price base brought about large daily fluctuations, so you should get used to it and do a good job of risk control.
At present, gold has stopped falling and stabilized. The daily line closed with a big negative for two consecutive days. The correction of the decline of 240 US dollars is almost in place, which is basically the same as the adjustment of 210 US dollars in the previous round. Then the probability of breaking the low again today is not high. The retracement adjustment in the strong bull market is generally about three trading days. Today is the third day. Combined with the decline in the previous two days, it is likely to fluctuate widely today.
Lianyang's rise was blocked by the first-line pressure of 3367 and fell back. Pay attention to the first-line support of 3330 to continue to be bullish. The upper pressure is at 3385-3386. If it touches it, you can go short.

Gold rebounds weakly and returns to a downtrendGold trend analysis: The current gold price is in a stalemate stage of long-short game. On the one hand, the path of the Fed's easing policy has been basically clear, and the US dollar is facing correction pressure; on the other hand, the stable global risk sentiment and the strong performance of the stock market have weakened the attractiveness of gold as a safe-haven tool. The repeated signals of global trade negotiations have also made the market direction unclear. From a technical point of view, gold has received support after the correction to the 26.3% Fibonacci retracement level of 3317 this week, and has returned to above $3,300 in the short term. The upper resistance focuses on the 3380 position. Once it breaks through, it will open up space to the 3400 mark.
From the daily gold chart, yesterday's gold price fell sharply and recorded a large real body negative candlestick pattern. The previous price peaked at a relatively obvious high, suggesting that the upper pressure effect is strong. The MACD indicator double line began to turn downward, increasing the risk of further short-term correction. However, the MA5 and MA10 moving averages have not turned downward yet, so you can pay attention to the support and defense of the moving averages. From the 4-hour gold chart, the gold price has maintained a volatile decline since it came under pressure at the 3500 line. The current price has fallen back to the 3260 line, with a short-term decline of US$240. Although there has been a rebound during the day, the upward trend has been destroyed. The MACD indicator double line has issued a dead cross reversal signal, suggesting that the correction trend may have started.
After the rise, gold fell back and fell below the support levels of 3351 and 3330. Now the market rebounded near 3314, which is also in line with our analysis of the long and short trend. In the big trend, the gold rally did not cross 3380, so there is still downward demand, that is to say, it can only be regarded as a rebound during the decline. In the short term, this wave of gains stopped at 3367, and now it broke through 3351 and pierced 3316 to rebound. The main focus on the upper support conversion resistance level of 51, followed by 3342. Specifically, you can wait for 42 to be touched and use 51 as protection to go short to see the gold price break the previous rebound low of 3314 to 3300. If it breaks down effectively, you can move the protection loss down to see the position of the rebound turning point of 3283 and 3260.

Gold may continue to fall in the short term
Trading sometimes does require some luck, but in the long run, good luck and bad luck will offset each other. To continue to succeed, you must rely on skills and apply good principles. Always remember; "Trading gold: half science, half art, all discipline."
📌 Driving events
The continued uncertainty of President Donald Trump's tariff policy and its broader impact on global economic growth have exacerbated market anxiety. These factors have triggered a new wave of safe-haven demand, pushing investors back into the gold market.
📊Commentary analysis
Gold prices are still facing selling pressure and are consolidating below the downward trend line. Trading prices are around 3,300 or lower.
💰Strategy Package
Short position:
Participate around 3320-30 points, profit target around 3290-80 points
⭐️ Note: Labaron hopes that traders can properly manage their funds
- Choose the number of lots that matches your funds
- Profit is 4-7% of the fund account
- Stop loss is 1-3% of the fund account
GOLD → Holdings are still insufficient, and there is still potenThe gold market has pulled back sharply one day after hitting an intraday record high of more than $3,500 an ounce. But Quaid believes that the gold rally is far from over as gold is severely under-owned and still cheap by some indicators.
Investors may see some short-term volatility as gold's parabolic move above $3,400 an ounce has made it "overbought at certain technical levels." However, overall, gold is still widely ignored by investors.
This could be a good technical target for gold. Comparing historical gold prices to the cost curve, the ratio shows that we can go further.
Although the opportunity cost of holding gold will remain high, gold remains an important safe-haven asset.
While a large number of investors continue to ignore gold, there is one group in the market that is buying as much of the precious metal as possible, and that is central banks.
Central banks will continue to buy gold as they question the reliability of the United States as a trading partner. The dollar is still weakening despite the selling of long-term U.S. bonds. This shouldn't happen, so there are definitely signs that not all US Treasuries are traditional safe-haven assets, and gold will benefit from this.
I hope this comprehensive analysis by Quaid can help all traders.
If you have other ideas, please leave a message to Quaid and we will discuss its trend together.

Gold price has stopped falling, can we buy higher?The short-term 4-hour middle track 3380 has been lost and has become a key counter-pressure point. As long as it does not stand above it again, it will maintain a downward correction. After breaking 3292 below, it will be the 66-day moving average of 3260. The 1-hour K-line is under pressure, After last night's consolidation and pull-up,plus MACD has a golden cross below the zero axis. This wave of $200 rapid decline has almost corrected most of it. If it continues downward for another wave, or with the help of bottom divergence, it will slowly brew a short-term bottom; today's gold rebound focuses on the resistance below 3340, below the extreme middle track 3356, it is still bearish if it cannot withstand the pressure, and it will start to consider bottom-fishing if the strong support 3260 or 3245 is stable;
"The tariff war" continues to manipulate the market.As evident from the chart, the drastic ups and downs triggered by tariffs this month have persisted, with the number of days seeing gold fluctuate by over $100 surpassing the historical total. Any speech, statement, or even minor move by Trump can sway market direction. We believe this essentially constitutes market manipulation, even transforming the market into a "battlefield" for the U.S. government to siphon off capital. However, since we cannot alter the status quo, we can only choose to accept it.
Currently, gold has entered an adjustment phase, and market trends could reverse at any moment due to a single news event. During this period, we need to stay calm, observe more, think critically, and carefully assess market dynamics.

Gold peaked and plummeted, entering a correction mode!Analysis of gold market trend:
Technical analysis of gold: Today, the highest price of gold is 3386, and the lowest price of US market is 3260, which is also a drop of 126 points. Although gold has continued its decline, it is not like yesterday. The decline is accompanied by a rebound. The trend of Asian market is a back and forth, and the trend of European market is also a back and forth. Needless to say, the US market fell after the opening and the current rebound, the overall rhythm is bearish, but it is not as clean as Tuesday. This trend reflects the opposition of market sentiment. After the risk aversion subsided, the gold price fell from the high of 3500, but after the long position was sold at a high level, some people still took over at a low level, so it led to a rebound trend after the decline.
Now from the daily chart, the daily K is likely to close with an upper shadow line as on Tuesday. Now the upper shadow line has been formed, so the closing price should be below the opening price of 3320. Now we need to pay attention to whether the lower shadow line can continue to spread downward. In other words, after this wave of rebound in the US market, there will be another wave of decline, and there will be a small rebound; returning to the short-term trend, in 1 hour, after the gold price fell below the two key positions of 3356 and 3285 today, the support moved down to around 3245. Although there was a rebound in the US market, it is likely to go to the range of 3228 to 3245 before rebounding, so the support references are 3260 and 3245; on the other hand, the resistance level, now the gold price pierces 3285 and then rebounds, and is now trading near this. The only reference is 3315 in the Asian session, and then up is the European session rebound high of 3340. If it is effectively crossed here, the bearish outlook will be suspended.
The direction of the end of the session is bearish. The steady operation is to intervene in short orders near 3320 to protect the area near 3330. Of course, you can intervene in short orders near 3310 to see if it can reach the range of 3260 to 3245. This is up to you. Even if it touches this range and rebounds later, I do not recommend participating in long orders. Overall, today's short-term operation strategy for gold is to focus on rebound shorting. The short-term focus on the upper side is 3315-3320 line resistance, and the short-term focus on the lower side is 3260-3245 line support. Friends must keep up with the rhythm.

The rise of the US dollar index suppressed gold.From the perspective of technical analysis, the gold daily chart shows a large negative line pattern and then forms an inverted hammer reversal prototype structure. Today, the key support level below has moved down to the 3300 integer mark area. In the US hourly chart cycle, after the gold price short-term touched the price of 3290 US dollars/ounce, the technical indicators showed oversold repair characteristics, suggesting the existence of technical rebound momentum. The upper resistance level of the current price range is locked in the 3350-3360 US dollars/ounce area, and the core defense level below is still 3300 US dollars/ounce. I think if this support level is effectively broken, it may trigger a technical bottoming out of the price in the 3250 US dollars/ounce area.
It is worth noting that the US dollar index has a short-term technical retracement. This kind of currency market fluctuation may provide a phased rebound support for the gold price through the exchange rate transmission mechanism. However, we need to be alert that the gold price has fallen below the 23.6% Fibonacci retracement level of the upward trend started from $2,900/ounce. If the 38.2% retracement level of $3,289/ounce is confirmed to be lost, it may trigger the resonance of technical stop loss orders and programmatic trading systems, forming further selling pressure. The current market structure shows typical characteristics of long-short game. It is recommended to pay close attention to the significance of gains and losses of $3,300/ounce for trend judgment.
Operation strategy: 1. It is recommended to short gold when it rebounds around 3,310, with the target at 3,290.3250

XAUUSD possible rejection?XAUUSD has dropped to daily support with a long atr candle and has primarily got rejected with potential trend reversal. As with current price on 15min, is creating series of higher high and higher low may continue with an uptrend to the daily resistance line?

Gold "skydived" from $3,500, where will the landing price be?Fundamental analysis: the game between policy signals and safe-haven demand
From a fundamental perspective, Trump's moderate statement is the core driving factor of this round of gold correction. However, as tariff expectations cool, investors are beginning to reassess the attractiveness of risky assets. The three major U.S. stock indexes closed higher on Tuesday, and the 10-year U.S. Treasury yield fell slightly, indicating that the market's confidence in the economic outlook has recovered. Against this background, the safe-haven premium of gold has been weakened, and profit-taking has accelerated.
In addition, the Fed's policy expectations are still an important variable affecting gold. At present, the market generally expects the Fed to continue to cut interest rates in 2025, but the pace and magnitude depend on inflation data and economic performance. If the expectation of interest rate cuts further heats up, the US dollar index may be under pressure, thereby providing some support for gold.
Technical analysis: pullback pressure and key support
The gold price fell below the support of $3,300, and the next key level points to $3,282, which coincides with the low point on April 17. If the decline continues, $3,150, as the pivot point in early April, will become an important defensive line for bulls. On the contrary, if the price stabilizes and rebounds, the pivot point of $3,415 will be the first resistance level, and further upward movement needs to pay attention to the higher resistance of $3,464. It is worth noting that the current price is far away from the resistance level of $3,415, and the rebound momentum may be limited in the short term, unless new fundamental catalysts appear to push the RSI back to the overbought area.
Quaid's comprehensive analysis:
The gold market has entered a consolidation phase after a rapid rise, and short-term correction pressure still exists, but in the long run, safe-haven demand and fundamental support remain solid. Quaid recommends that traders pay close attention to US policy trends, the trend of the US dollar, and the performance of key technical levels to grasp the market rhythm.
At the same time, Quaid will always pay attention to international news so as to make timely analysis and suggestions for traders; to help traders get out of the current predicament.

4/23 Gold Trading StrategyGold saw a sharp decline from 3500 to around 3360 yesterday, and our selling strategy delivered significant returns.
Over the weekend, Trump stated he has no intention to fire Powell and hinted at easing trade tensions. This quickly dampened market risk aversion, causing gold to plunge at the open today to near 3320. The downward momentum remains strong.
In this kind of market, flexibility is key. A sharp drop is usually followed by a rebound, but the strength of that rebound is what matters. Technically, the potential bounce is estimated at around $50, but whether the price continues to rise or resumes its decline will depend on how the market digests the news.
Technical levels (excluding news impact):
Key resistance: 3410–3440
Key support: 3328–3303
Considering the news:
Key resistance: 3346-3372
Key support: 3298–3268
Trading Strategy for Today:
Sell between 3410–3440
Buy between 3297–3267
Trade flexibly within 3386–3332 / 3296–3328

Can gold continue to fall and set a new high?This wave of gold correction is still ongoing. In fact, the market has a warning for today's pullback. After all, yesterday's closing line was a big negative line, so the trend of gold will definitely continue. Moreover, after gold rose to the 3500 level yesterday, the trend weakened. The market fell all the way and broke through the 3400 mark and the 3300 mark, and fell to the lowest level of 3290! To be honest, this round of decline is still quite strong. After breaking the continuous positive trend, the market ushered in the suppression of the market pullback, and at present, there is still a trend of continuation! On the whole, the short-term operation strategy of gold is recommended to be short-selling on rebounds and long-selling on pullbacks. The short-term focus on the upper side is 3320-3330 resistance, and the short-term focus on the lower side is 3285-3245 support.

Policies may drive the pace.Regarding the Federal Reserve Chair's statement indicating a halt to drastic interventions, it has, to a certain extent, bolstered the sentiment in the equity market, leading to an outflow of some funds from the gold market. Meanwhile, the market is also assessing the potential pace of subsequent policies. There remains a divergence in the market's expectations for Federal Reserve interest rate cuts in the coming months. The persistent phenomenon of policy stance reversals within the United States has resulted in inconsistent views on the macroeconomic outlook among market participants. Influenced by the aforementioned factors, after surging significantly to around $3,500 in the earlier period, the gold price experienced profit-taking. Technically, gold oscillated and declined all the way from around the high of $3,500 yesterday, reaching a low of $3,291, with a decline of over $200. In the short term, the decline in the gold price has halted, and the bullish sentiment persists. In actual trading, today, long positions were opened around the bottom of $3,302. After the decline in the evening, long positions can be further established.
If your current gold trading performance is not satisfactory and you hope to avoid detours in your investment, you are welcome to communicate and exchange ideas with us!

Trump's remarks and policy moves: Stirring the financial marketsTrump's remarks have sent shockwaves through financial markets and had a substantial impact on gold prices😰! He declared that he would not dismiss Fed Chair Powell, yet simultaneously called for interest rate cuts. His prior threats to remove Powell had stoked fears among investors regarding the Federal Reserve's policy, compelling them to turn to gold as a safe haven, which caused the price of gold to soar🚀. However, his most recent statement alleviated investors' concerns, leading funds to flow back into dollar - denominated assets and causing gold to decline from its peak levels📉
When it came to trade, Trump showed signs of leniency during the talks with China, aiming to reach a swift agreement that would reduce tariffs by 145% (although not to zero)🤝. The past unpredictability in trade relations had driven up the price of gold, and potential future easing measures might dampen the demand for gold as a safe haven asset⏳
Currently, the upward movement of XAU/USD has been put on hold⏸️. A large amount of capital has rushed into the virtual currency market, resulting in a significant surge in the price of BTC📈
⚡⚡⚡ XAUUSD ⚡⚡⚡
🚀 Sell@3300 - 3280
🚀 TP 3260 - 3240 - 3220 -3200
The market has been extremely volatile lately 📈📉 If you can't figure out the market's direction, you'll only be a cash dispenser for others 💰

Gold shorts are rampant! Can the 3300 mark be maintained?Yesterday, the international gold price fell from 3,500 USD/ounce to 130 USD, breaking through several important support levels. As of today, the lowest price reached 0.328, around 3291, which has given up all the gains this week. Focus on 0.382, 3291, within the day. If there is no break, the bulls will resist. After the break, the bears will continue to attack and look at around 3243-3228.
Spot gold today's operation strategy and key points analysis
Core view: The daily pressure adjustment continues, pay attention to the effectiveness of 3293 support in the short term, and the 3228-3240 area may become the end point of the adjustment;
The rebound is mainly high-altitude, pay attention to the 3340-3356 resistance area, and maintain a bearish outlook before stabilization;
1. Spot gold intraday operation plan
Resistance and short-selling area
Rebound: 3340-3356-3471 (4-hour middle track and MA5 daily resistance golden section 0.236)
Strategy: If the rebound is under pressure near 3340 (hourly chart K-line closes negative or stagflation signal), try shorting with a light position, stop loss above 3358, and target 3293-3280.
Aggressive short order: If the rebound is unable to break through 3335 (MA10 hourly moving average), you can enter the market in advance.
Support and potential bottom-picking area
First support: 3291 (Daily MA10 382 retracement)
Observation signal: If it rebounds and recovers 3291 after a rapid decline, you can short (light position), stop loss 3285, target 3340.
Strong support area: 3228-3240 (50% retracement, previous starting point)
Strategy: When it touches around 3228 for the first time, combined with bottom divergence or long lower shadow, try long with light position, stop loss 3210, target 3280-3300.
Breakthrough market response
Unexpectedly break through 3358: If the hourly chart closes at 3358, short orders will be temporarily exited, pay attention to the counter-pressure of 3380 (4-hour middle track), and short orders can still be tried.
Potential opportunities for bottom-picking in the market: focus on 3240-3228-3167
IV. Summary
Main idea: rebound high and high, focus on 3340-3356-3371*, if it does not break, continue to adjust;
Bottom-picking opportunity: wait for the stabilization signal in the 3228-3240-3167 area, and it is safer to trade on the right side;
Short-term trading depends on the system, and the market depends on the level. Short-term trading is high frequency, fast in and fast out. It is obviously impossible to pursue a high success rate in this model. Therefore, it can only rely on the system to win. There is a clear trading system, stop loss and stop profit system and risk control system. As long as these are done well, short-term trading can also make money. Moreover, short-term trading is a compulsory course for every trader. The market is the core of the real path to profitability, leapfrogging and successful trading, which requires considerable accumulation and precipitation, including the accumulation of mentality, funds, and technical level, and the market is also the path that every trader must reach and must eventually reach and move towards.

Gold is falling wildly, is a key position coming?As of press time, spot gold has fallen wildly to below the support level of $3,300, having hit a record high of $3,500.05 the previous trading day.
At present, gold has fallen more than 5% from its historical high, and the fundamentals seem to be changing.
Quaid believes that gold has reached a key "turning point". After a strong rebound, the precious metal not only gave up all its gains, but also fell to a new low.
The sharp rise in gold prices is mainly due to the market pricing of "stagflation" risks, but as this risk is gradually eliminated, gold may experience a significant correction, especially considering that "long gold" has become one of the most crowded trades in the market, and its parabolic rise is an obvious signal. From a larger cycle perspective, gold is still in an upward trend, because the real yield may continue to decline against the backdrop of the Fed's easing policy. But in the short term, if good news about tariffs continues to be released, gold prices may fall further, and the market will adjust according to the new environment.
Daily chart analysis
From the daily chart, gold has given up all of Monday's gains. From a risk management perspective, buyers may look for a more cost-effective entry position at 3290 in the hope of further gains, while sellers hope that prices can break further down, thereby increasing bearish bets.
4-hour chart analysis
In the 4-hour chart, prices found support around 3300 and rebounded. Buyers intervened at this position and set risks below this support level in an attempt to push prices higher again. Sellers hope that prices fall below this level to push prices further down.
Quaid's analysis:
The current market is crazy. If it can fluctuate and adjust around the 3300 support level, the downward trend will stop and it may rise to 3400.
If this support level fluctuates and falls, it may plummet to around 3150.
Traders can wait and see for a short period of time before trading.
I hope Quid's analysis can help you get out of your current predicament. I also wish that all traders can fight for their own money waves in the market and achieve financial freedom under Quaid’s advice and analysis.

3280 becomes the key for bulls!The previous surge in gold prices was mainly due to the market pricing of "stagflation" risks, but as this risk is gradually eliminated, gold may experience a significant correction, especially considering that "long gold" has become one of the most crowded trades in the market, and its parabolic rise is an obvious signal.
From a larger cycle perspective, gold is still in an upward trend, because the actual yield may continue to decline under the background of the Fed's easing policy. But in the short term, if the good news about tariffs continues to be released, the price of gold may fall further, and the market will adjust according to the new environment.
Views on gold tonight!
In fact, the market has a warning for today's retracement. After all, yesterday's closing line was a big negative line, so there must be a continuation in the trend of gold. Moreover, after yesterday's gold rose to the 3500 line, the trend weakened, and the market fell all the way to break the 3400 mark and the 3300 mark, and fell to the lowest 3290 line! To be honest, this round of decline is still quite strong. After breaking the continuous positive, the market ushered in the suppression of the market retracement, and at present, there is still a trend of continuation! In my opinion, the key entry point for long orders today is the previous starting point of 3280. The short-term retracement of gold is obviously continuing, and in the medium and long term, gold is still bullish. So our entry point is actually relatively simple. When it retreats to 3280, we can directly enter the market. There are still many opportunities for long orders. The retracement is not the peak!

GOLD UPDATEHello friends
As you can see in the picture, everything is clearly defined.
After a strong rise, we see a double top pattern at the top of the channel, which indicates that we should gradually wait for a correction.
Now, how far will the correction continue? In the picture, we have identified the support levels that the price can reach.
*Trade safely with us*
