Bullish momentum is strong, keep an eye on key positions
📌 Driving events
On Monday (April 14), spot gold fell slightly during the day, hitting a record high of $3,245.42/ounce earlier before falling back. Despite a small adjustment during the day, the price of gold remained above the key mark of $3,200/ounce, indicating that the overall market sentiment is still cautiously optimistic. The main factors driving this round of market conditions include uncertainty in the global trade environment, a weaker dollar, and continued warming of safe-haven demand. During the session, investors' reactions to the latest tariff remarks increased gold price volatility, but fundamental and technical support remained solid, and the strong pattern of gold did not show any significant shakes.
📊 Commentary and analysis
From a technical perspective, the trend of spot gold continued its recent strong pattern. On the daily level, gold prices have continued to run along the rising channel since breaking through $3,000/ounce. Although there was a small correction during the day, the overall bullish trend was not damaged. The current price is firmly above $3,200/ounce, which has become a key psychological and support level in the short term. If the gold price can continue to hold this area, bulls may further challenge $3,250/ounce or even higher.
On the hourly chart, after the gold price surged to $3,245.42/ounce in the morning, it was suppressed by short-term profit-taking and showed signs of decline.
However, from a longer-term perspective, the upward slope of gold prices since the end of last year has remained stable, and there has been no significant retracement after breaking through key resistance levels many times, reflecting the resilience of the bulls. Analysts pointed out that the support of $3,200/ounce is strong. If the subsequent price can hold this level, the bulls may exert their strength again in the next few days.
💰Strategy package
Upper pressure - 3260-3280
Lower support - 3210-3200
Start time 3220-30 Continue to go long
Take profit 3240
Stop loss 3210
⭐️Note: Labaron hopes that traders can properly manage their capital
- Choose the number of lots that matches your capital
- Take profit equals 4-7% of the capital account
- Stop loss equals 1-3% of the capital account
Xauusdlong
4/14 Gold Trading StrategiesLast Friday, gold showed a strong unidirectional rally followed by tight-range consolidation at high levels. Our bearish-biased strategy yielded limited profits, and some traders may still be holding trapped positions due to delayed exits. However, structurally, gold’s current posture signals early signs of exhaustion, and a pullback remains likely.
🔥【Key Headlines to Watch】
🇺🇸 The U.S. has suspended tariffs on popular consumer electronics, causing gold to gap down by $30 at today’s open.
🛠️ Trump is expected to unveil details on semiconductor tariffs — a reduction or pause will likely pressure gold lower.
💬 Two Fed officials speak today:
Barkin: Speech on “Navigating Through Economic Fog”
Cook: Remarks on the Fed’s evolving role in the economy.
📊 The NY Fed 1-Year Inflation Expectations report will be released — market expectations are bearish for gold.
🔍【Technical Outlook】
Gold remains near historic highs, trading at an extended premium;
The recent rally has been largely driven by speculative inflows, not solid demand;
If sentiment flips or profit-taking begins, a sharp sell-off could follow;
Structurally, gold appears to be forming a top — favor short setups at elevated levels.
🎯【Trade Setup for Today】
🔻Sell Zone: 3230 – 3250
Look to short near resistance on failed breakouts
🔺Buy Zone: 3128 – 3104
Consider long entries only on healthy pullbacks to strong support
🔄Range Zones:
3220 – 3195
3158 – 3206
Tactical range trading — adapt to intraday momentum shifts

3270, waiting for new ATH gold price⭐️GOLDEN INFORMATION:
Gold prices eased during Monday's Asian session as risk sentiment improved, prompting a shift away from safe-haven assets. The upbeat market tone followed Wall Street’s strong rebound on Friday and encouraging developments in the ongoing US–China tariff dispute, temporarily reducing upward pressure on the yellow metal.
Last week, China retaliated against the US’s 145% tariff hike by imposing 125% duties on American goods but later signaled it would not respond to any additional escalations. Over the weekend, President Donald Trump floated the idea of targeting Chinese semiconductors and electronics with a separate 20% tariff—indicating a possible shift in strategy from across-the-board tariffs to more focused trade measures.
⭐️Personal comments NOVA:
Gold price, buying volume maintained, continuing the upward trend: 3260, 3270
⭐️SET UP GOLD PRICE:
🔥SELL GOLD zone : 3270- 3272 SL 3277
TP1: $3260
TP2: $3250
TP3: $3240
🔥BUY GOLD zone: $3168 - $3166 SL $3161
TP1: $3175
TP2: $3190
TP3: $3200
⭐️Technical analysis:
Based on technical indicators EMA 34, EMA89 and support resistance areas to set up a reasonable BUY order.
⭐️NOTE:
Note: Nova wishes traders to manage their capital well
- take the number of lots that match your capital
- Takeprofit equal to 4-6% of capital account
- Stoplose equal to 2-3% of capital account
Gold falls under pressureGold rebounded from the bottom last week, and the entire increase from 2957 to 3245 was as high as 288 US dollars. It took only three trading days. The strong V reversal went up as it went down. At present, gold has successfully stood on the 3200 mark. Can it continue to rise this week? Is there any hope for 3500?
At present, whether it is from the daily or weekly lines, they are all big Yang closings, which all show the strong rise of gold. From the big trend, there is no doubt that the bullish direction. Especially for the current political and economic situation, but it is necessary to pay attention to the process of rising, which is also accompanied by a correction or deep retracement, just like the last wave of plunge.
At present, gold is mainly affected by tariff policies, which pushes gold prices to continue to rise. Now that the tariffs have been increased to 125%, adding more is just a number game with no practical significance. There is no more to add. The next step is to return to the negotiation table, which is just a matter of time. Once such a vent is revealed in the future, gold will dive from the high platform. This is a news risk point that needs to be paid attention to. There are risks in chasing high prices, and trading needs to be cautious.
The daily line rose nearly 300 US dollars in three consecutive days. This kind of rapid rise and fall will not last too long. It is easy to turn to negative correction or cross sideways in a cycle of three to four days. Therefore, I think the probability of a sharp rise in gold at the beginning of this week is not high, and we should be careful of the market that rises and falls.
Today, gold rose and fell as expected over the weekend. It just didn't break the high. Gold opened low at 3220 and rose successfully. Our 3220 long orders successfully stopped profit at 3235-3240; European session 3234 light position short, 3237 increase short position, 3218 reduce position, stop profit at 3209; long and short turnover all won. For gold, there is a possibility of continued downward exploration, focusing on the 3227-3230 pressure line short, the watershed 3238, and the support below is the 3200 mark-3187 line.

Gold fluctuates at high levels and is under pressure to adjust!Gold gapped down and opened low, bottomed out and rebounded without breaking the 3245 line. Today's trend is biased towards decline and adjustment. Intraday trading can be kept high and low! The upper 3245 suppression retracement is expected to gamble the small double top suppression deep retracement, and the lower support is first maintained near the morning retracement low point 3210. This first determines the strength of the European session. Only after breaking can we continue to chase the short position. If gold rebounds to 3240-43 during the day, we can short it. Today, we will focus on the previous high-altitude suppression. Pay attention to whether it can effectively stabilize at 3200-3190 below. If it stabilizes, we will continue to look at the integer 3300 mark. The bulls are still strong overall, but the intraday volatility of gold is large. If the position ratio is not done well, both long and short positions are easily damaged. Therefore, the recent trading is mainly to lock the area and position control ratio, strictly stop loss in the short term during the day, and do not hold positions and carry orders overnight!
On the whole, today's short-term operation of gold suggests that callbacks should be the main focus, and rebound shorts should be supplemented. The top short-term focus is on the first-line resistance of 3240-3245, and the bottom short-term focus is on the first-line support of 3210-3187.
Short position strategy:
Strategy 1: Short 20% of the gold position in batches when it rebounds to around 3240-3243, stop loss 6 points, target around 3210-3200, and look at 3190 if it breaks;
Long position strategy:
Strategy 2: Long 20% of the gold position in batches when it pulls back to around 3187-3190, stop loss 6 points, target around 3215-3235, and look at 3245 if it breaks;

Choose the right time to enter the market and wait for a reboundFrom the current trend of gold, we still focus on the short-term suppression of 3245-3250 today, and the short-term support of 3200-3206 below, with a focus on the support of 3188-90. Don't chase long at the current high position. The daily level reversal and negative closing may occur at any time.
Gold operation strategy:
If gold falls back to 3200-06 and does not break, you can buy more. If it falls back to 3188-90, you can buy more. Stop loss is 3178. The target is 3248-3250. If it breaks, continue to hold.

Gold will rebound strongly if it does not break 3200The technical aspects of the gold market remain strong during the day. The weekly line closed positively for consecutive days, and the daily line remained intact for four consecutive positive lines, and the medium-term upward trend remained unchanged. At present, we need to pay attention to the possible technical correction at the beginning of the week, but as long as there is no single negative swallowing positive or continuous negative pattern, the trend direction is still bullish. The key support level is at 3200, of which 3180 is the short-term long-short watershed. If it is effectively broken, the upward momentum will be weakened; 3150 is the critical point of the medium-term trend, and a break may trigger a deeper adjustment.
H4 cycle shows that the price stabilized after falling back to the 10-day moving average near 3200, and this position became the focus of intraday long-short game. Operation strategy suggestion: If the price falls back to the 3200-3205 area without breaking, you can choose to go long, and the target is the 3245-3255 resistance zone. After breaking through, you can follow the trend. Be careful that if the 3200 support is lost, you need to adjust the strategy and pay attention to the 3180 line. Overall, keep the idea of going long on the pullback, and pay attention to controlling the position to prevent short-term volatility risks.
Gold suggestion for the evening: Go long on the 3210-3205 area, stop loss 3200, target 3235

Continue to go long during the US trading session
📌 Driving events
The recent global economic situation is complex and changeable, and major events have far-reaching impacts. In terms of trade, although the United States has exempted some products from tariffs, repeated policies have led to increased trade tensions. Asian powers have imposed a 125% tariff on US imports, impacting the global industrial chain and supply chain. Looking ahead to this week, investors need to pay attention to the trade situation and risk aversion. The US "terrorist data" and the European Central Bank's interest rate decision will also affect the global financial market. Policymakers and investors need to respond with caution.
📊Commentary Analysis
In terms of gold, the overall gold price showed a sharp rise last Friday.
As for the four-hour level, the current focus needs to be on the support level of the 3200 area. This position is the key dividing line that determines the short-term trend of gold. If the price is above this position, it will continue to be long in the short term. Let us wait and see, waiting for good news from everyone.
💰Strategy package
Upper pressure——3260-3280
Lower support——3210-3200
Target 3220-30 to continue to do more
Take profit 3250
Stop loss 3210
⭐️Note: Labaron hopes that traders can properly manage their capital
- Choose the number of lots that matches your capital
- Take profit equals 4-7% of the capital account
- Stop loss equals 1-3% of the capital account

Gold price hits new high, 3216 as the dividing lineGold prices rose strongly by nearly $276 in three trading days, and broke through historical highs one after another. There is no highest, only higher.
There are many similar points in the rise, which can be summarized into five points. The first is the continued rise in the early trading and breaking through the new high. The second is the 0.382 position of the space adjustment and the same amplitude switching of the space. The third is the wandering back and forth sweep of the European session. The fourth is the flash of good points. The fifth is to learn to stop when you are ahead.
Combining these five points to look at the market situation, the gold price continues to rise. Last Friday, it closed directly at the high of 3237-3238 area.
Today The price opened lower in the morning and touched 3210, and hit a new high of 3245.6. But this time it was different. After the high, it fell back. The rise was 30 US dollars, and the high fell back 25 US dollars. Basically, the rise was as much as the fall. In the afternoon, the resistance of 3238 was confirmed for the second time, and it fell 22 US dollars again to find 3216, which was basically recovered.
The overall trend will be more adjusted. The cooperation between the high fall and the bottom recovery will provide momentum for the start of a new round of market.
Specifically, the key points to note are:
1. The correction range of the market space is at least 30 US dollars, and the start is at least 60 US dollars. Instead of focusing on the high and low issues, we should grasp the present.
2. The daily and weekly lines are rising strongly, and the indicators and patterns are overloaded. At present, only the direction is referenced; the four-hour pattern opening situation, the lifeline position is slightly far away, 3154 is close to the support point 3151 area that was stepped back late at night, and together they become the spatial dividing line. The resistance above is 3270-3275 and 3299.
3. The hourly chart pattern closed and flattened. Today's white market has been running back and forth around the upper and lower rails. The current pattern further closed the range of 3242-3216. Break through this space and then look at the space switch, and then cooperate with the small cycle double-line upper rail position 3194 area. If the price breaks the early low of 3210, it will switch space downward.
4. As shown in the figure, the price last week accelerated the rise and broke through 3190, and last Friday, it repeatedly broke through the new high around 3210, first the new high of 3238 (looking for 3210), then the new high of 3245 (looking for 3210), and then the new high of 3245.6
Now the price is down to 3216, which is also the starting point of the Asian session
Using 3216 as the switching point, the current sweeping space is about 30 US dollars, and the subsequent price breakthrough will switch the space of 30 US dollars
Focus on 3276-3278 upwards and 3186-3188 downwards
And it is very interesting that the 0.382 position of the latest wave of rise is also at 3187-3188
So, here we need to focus on the key points , with 3246-3216 as the range sweep, breaking through and switching to 30 US dollars, focusing on the support of the 3186-3188 area, and then looking at the upward switching space
In addition, it is necessary to remember that the online position is the 3131-3129 area, the top and bottom conversion position, and it is also a strong resistance level that turns into a strong support level after breaking through. After breaking through, it directly rises unilaterally
In summary, for gold at the beginning of the week, we treat it with a biased adjustment and sweeping idea. Referring to this idea, we have deployed high altitude twice in the 3236-3238 area. As of press time, the price fell to 3216, and all short orders were closed at 3217, waiting for the next plan. Now the price has risen again to 3230, and it continues to sweep, rushing high and falling, bottoming out and rising, which is in line with the above-mentioned biased sweeping and adjustment method.

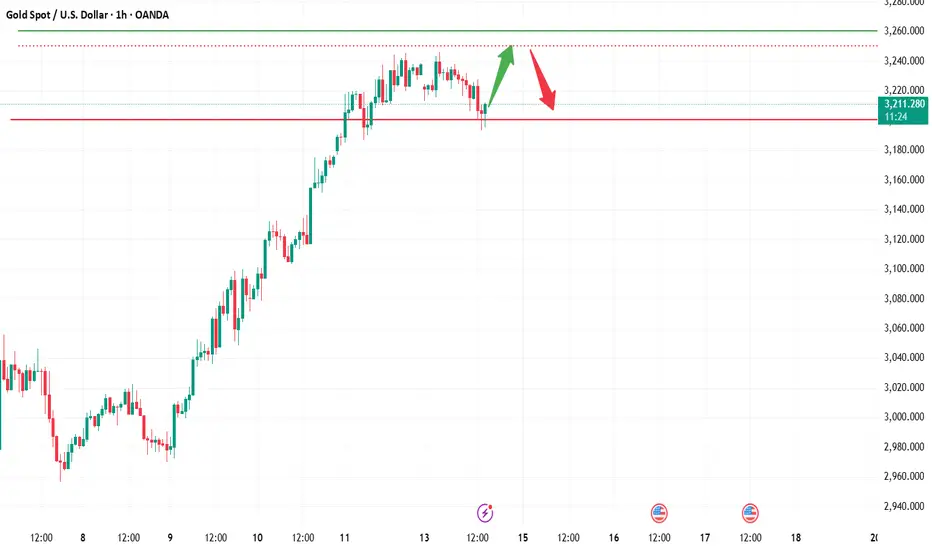
GOLD 2 Excepted Scenarios Very Clear , Which One You Prefer ? Here is my opinion on GOLD Chart , the price broke the highest Res , and continue to upside , so i think we have 2 ways in this pair right now , if the price go back to retest the broken res area and give us a good bullish Price Action we can enter a buy trade with smal lot size cuz the price at very high price , and if we have a clear closure below it , we can enter a sell trade with 500 pips target .
GOLD Price Analysis: Key Insights for Next Week Trading DecisionIn this video, I break down the key forces pushing gold to record highs. Learn how factors such as US-China trade tensions, global inflation pressures, and geopolitical uncertainty—combined with a weakening US Dollar and safe-haven demand—are reshaping the gold market.
In this quick analysis, we cover:
🔹 Inflation & Economic Uncertainty: How rising prices and central bank policies continue to drive interest in gold.
🔹 Trade Tensions & Geopolitical Risks: The impact of US-China disputes and global instability on market sentiment.
🔹 US Dollar Weakness: Why a softer USD is making gold a more attractive asset for international investors.
🔹 Technical Insights: Pinpointing key price levels and exploring potential trend continuations or reversals ahead of US retail sales data.
Disclaimer:
Forex and other market trading involve high risk and may not be for everyone. This content is educational only—not financial advice. Constantly assess your situation and consult a professional before investing. Past performance doesn’t guarantee future results.
#GoldMarketAnalysis #Inflation #TradeTensions #GeopoliticalRisks #TechnicalAnalysis #GoldTrading

Gold market analysis: 14-APRIL-2025Happy New week, check out our Gold market analysis: Today's zones for strategic decision-making.

XAUUSD Today's strategyLast week, the price of gold fluctuated sharply. It reached a low of $2,955, a high of $3,245, and finally closed at $3,238. The maximum cumulative increase throughout the week was $290, and the trading activity in the market reached a new high for the current stage.
This rally is also extremely rare in the historical price trends of gold over the past few decades. The driving factors are far beyond traditional logic – not only driven by the heightened inflation expectations and the weakening of the US dollar, but also more deeply induced by the intensification of the cracks in the global trade system and the continuous spillover of geopolitical risks. The uncertainty pervading the market has dampened investors' confidence. Central banks and sovereign wealth funds around the world have turned to increasing their holdings of physical gold one after another to avoid the systemic risks of the US dollar and other financial assets.
We maintain our bullish view unchanged. For short-term operations, it is recommended to continue with the strategy of going long on dips. Pay special attention to the key support level of $3,200, and you can consider placing long positions near this price level.
XAUUSD
buy@3210-3220
tp:3250-3260
When you find yourself in a difficult situation and at a loss in trading, don't face it alone. Please get in touch with me. I'm always ready to fight side by side with you, avoid risks, and embark on a new journey towards stable profits.

Gold's main rise is not over yet, long is still the core strategHeading into next week, we maintain a bullish medium-term outlook on gold, with a continued preference for trend-following long positions.
Although short-term bearish attempts persist, the broader upward structure remains intact, with pullbacks presenting tactical buying opportunities.
Key support is observed around $3,200/oz, which serves as a strategic level for initiating low-risk long entries within the ongoing uptrend.

XAU/USD is about to reach the 3300 - point level.The long-term upward trend remains unchanged. Tariffs are still a major variable causing significant fluctuations in gold.
U.S. Tariff Policies
Since April 9th, the United States has imposed tariffs ranging from 10% to 25% on goods from China, the European Union, Canada, and other regions, covering key sectors such as automobiles, steel, and semiconductors.😒
Countermeasures of Various Countries
China: On April 4th, China announced that it would impose a 34% tariff on U.S. goods starting from April 10th. On April 9th, the tariff rate was further increased to 84%, covering all U.S. goods.😠
The European Union: Announced that it would impose a 25% tariff on U.S. motorcycles, diamonds, and other goods starting from May 16th.😤
Canada: Imposed a 25% retaliatory tariff on U.S. automobiles on April 9th, but exempted auto parts.😏
At present, the rise of gold is still driven by the demand for a safe haven. It remains uncertain whether the 104% tariff will actually be implemented. Once relations deteriorate, it will truly be bullish for gold again. In the short term, this is definitely something that needs to be closely monitored.🤔
This upward movement has led to the clearing of many traders' accounts or significant losses 😫. You can follow my signals and gradually recover your losses and achieve profitability 🌟.
💰💰💰 XAUUSD 💰💰💰
🎯 Buy@3220 - 3230
🎯 TP 3270 - 3300
Traders, if you're fond of this perspective or have your own insights regarding it, feel free to share in the comments. I'm really looking forward to reading your thoughts! 🤗

Tariffs remain a major driver of XAUUSD swingsThe long-term upward trend remains unchanged. Tariffs are still a major variable causing significant fluctuations in gold.
In April 2025, the global trade war was in a severe situation. The adjustment of the United States' tariff policies triggered a series of countermeasures from various countries. The specific situation is as follows:
U.S. Tariff Policies
Since April 9th, the United States has imposed tariffs ranging from 10% to 25% on goods from China, the European Union, Canada, and other regions, covering key sectors such as automobiles, steel, and semiconductors.😒
Countermeasures of Various Countries
China: On April 4th, China announced that it would impose a 34% tariff on U.S. goods starting from April 10th. On April 9th, the tariff rate was further increased to 84%, covering all U.S. goods.😠
The European Union: Announced that it would impose a 25% tariff on U.S. motorcycles, diamonds, and other goods starting from May 16th.😤
Canada: Imposed a 25% retaliatory tariff on U.S. automobiles on April 9th, but exempted auto parts.😏
Impacts of the Trade War
Price Increases: Imported automobiles, electronic products, etc. are likely to increase in price. If U.S. agricultural products are subject to tariffs imposed by China, the prices of items such as meat and edible oil may fluctuate.😫
Employment Market Impact: Enterprises relying on exports may lay off employees. For example, the manufacturing industry in China and European automobile factories are affected. In the United States, certain industries such as agriculture and retail also face pressure.😔
Financial Market Volatility: The global stock market has experienced increased short-term volatility. Investors have shifted to safe-haven assets such as gold and treasury bonds. The stock price of Tesla plummeted by 40% due to tariff policies.😱
Supply Chain Disruption: There may be delays in the delivery of chips and auto parts due to trade barriers. The supply of some imported pharmaceuticals and industrial raw materials may also be affected. The prices of some products on cross-border e-commerce platforms may increase, and the costs of purchasing agents and cross-border logistics will rise.😣
At present, the rise of gold is still driven by the demand for a safe haven. It remains uncertain whether the 104% tariff will actually be implemented. Once relations deteriorate, it will truly be bullish for gold again. In the short term, this is definitely something that needs to be closely monitored.🤔
This upward movement has led to the clearing of many traders' accounts or significant losses 😫. You can follow my signals and gradually recover your losses and achieve profitability 🌟.
Traders, if you're fond of this perspective or have your own insights regarding it, feel free to share in the comments. I'm really looking forward to reading your thoughts! 🤗

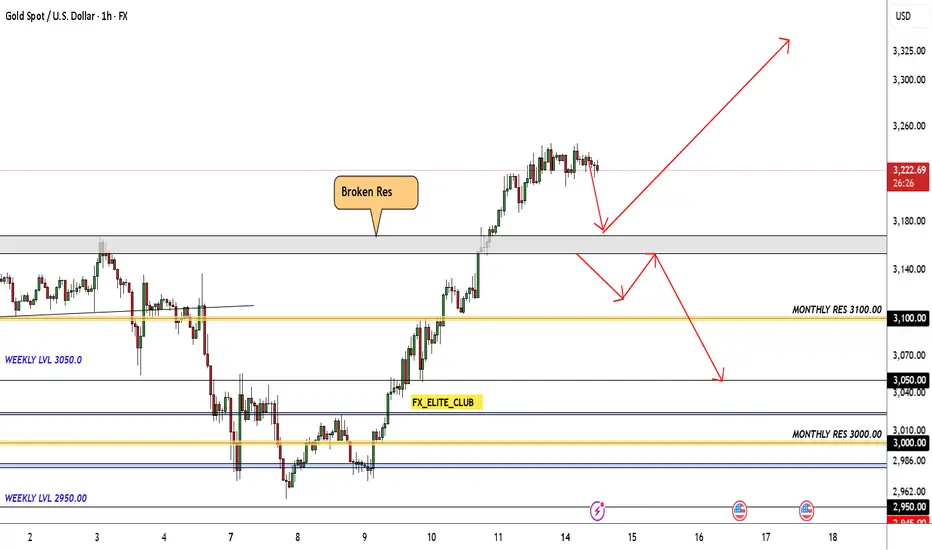
gold (update)Hello friends
Due to the price growth, we have given you the analysis that the price will fall and the same thing happened. Now, due to the sharp decline, the price has entered the channel and the 3 specified areas are important support areas for us, where we can buy with risk and capital management and move towards the specified goals.
*Trade safely with us*

GoldXau usd daily analysis
Time frame daily
Risk rewards ratio =3
Target 3.190$
Price fell down to uptrend cross as you can see on the chart and now after we heard good news about Europe and USA economic relations and Middle East war( Iran and USA are on the sides of deal table) gold will reach to my target

keep aiming for new ATH next week✍️ NOVA hello everyone, Let's comment on gold price next week from 04/14/2025 - 04/18/2025
🔥 World situation:
Gold extended its remarkable rally for a third consecutive session on Friday, surging to a fresh record high of $3,245 amid intensifying US–China trade tensions. The precious metal posted impressive gains of over 2% as fears of a prolonged trade war and its potential fallout on the global economy sent investors flocking to safe-haven assets. At the time of writing, XAU/USD is trading around $3,233.
The North American session saw China retaliate with a 125% tariff on US imports, following President Donald Trump’s move to raise tariffs on Chinese goods to 145%. The heightened geopolitical strain triggered a flight to safety, propelling Gold higher. Further fueling the rally was a sharp decline in the US Dollar, which tumbled to a near three-year low, with the US Dollar Index (DXY) falling to 99.01.
🔥 Identify:
The huge growth shows no signs of stopping, gold prices continue to benefit from tariff policies, continue to find new ATH early next week
🔥 Technically:
Based on the resistance and support areas of the gold price according to the H4 frame, NOVA identifies the important key areas as follows:
Resistance: $3255, $3280
Support : $3157, $3070
🔥 NOTE:
Note: Nova wishes traders to manage their capital well
- take the number of lots that match your capital
- Takeprofit equal to 4-6% of capital account
- Stoplose equal to 2-3% of capital account
- The winner is the one who sticks with the market the longest

Xauusd up trend Gold has been on an up trend since Friday.
And it will continue it uptrend up to the price of 3280.
So tape profit will be at 3280

Analysis of gold market price structure and trends.Layout ideas。On Thursday, the US dollar index broke down sharply, successfully stimulating the market's risk-averse funds to return to the gold market again, and the gold price rose again. Let's briefly sort it out!
First: The tariff issue of the trade war caused the global market to plummet, and gold fell accordingly. The main reason was that it was necessary to sell gold, recover funds, and fill the capital margin in the stock market, foreign exchange market, and bond market; therefore, gold also plummeted downward in the past few days;
Second: The U.S. dollar index plummeted and broke through, driving market funds back into the gold market, and the gold price hit a record high again;
In yesterday's analysis of spot, you can look back at yesterday's analysis of the daily K indicator. There are two situations, restart Golden cross means breaking the top and reaching a new high. You can look back at yesterday's analysis. This is also a common indicator trend.
Spot gold opened yesterday from 3081 and quickly fell to 3071 before rebounding to around 3100. After that, the price fell back to 3078-80 and rose to around 3132. The price fell back to 3103 from around 3132 and then rebounded to around 3136 and bottomed out around 3113-16 and rose to 3175. The price fell from 3175 to around 3152-54 and then rose again to around 3176 and closed. The opening price fluctuated and rose above 3200. From yesterday's trend: 3180 and 3100 are the bottom supports, but the area around 3100 has fallen back and repaired yesterday, so 3132-36 and 3116 are the current support points. Yesterday, it also directly rose and broke through 3134-36 and then rose without stepping back. At the same time, the price rose to 3174-76 and then retreated to 3152-54, so the current support point is around 3176. The opening price directly rose from this position. Currently, 3190 is the nearest support. Comprehensive important support: ①3176 ②3134 ?③3100 ? The small support distribution in the middle is 3190-3167-3154-3115
Spot gold market analysis:
Ⅰ: Spot gold daily MACD golden cross is initially established, and the dynamic indicator STO quickly repairs upward, which represents the bullish trend of prices. At present, there is no resistance point to judge because it is a historical high, so we can only try it based on small cycle indicators. The current support point of the daily line is located near the MA5 and MA10 moving averages, 3096-3088, and it is not necessary to consider it far away from the candlestick chart.
Ⅱ: Spot gold 4-hour current MACD high golden cross oscillates with large volume, and the dynamic indicator STO is overbought, which represents high-level price fluctuations. Because the indicators are at relatively high levels, they may face short-term peak signals at any time. Currently, we focus on the support line of 3176 near the MA5 moving average.
Ⅲ: Spot gold hourly MACD golden cross is currently oscillating with large volume, and the dynamic indicator STO is running overbought, which means that the hourly line is still oscillating and strong. The current focus is on the 3245 line. If it breaks through 3245 this hour, it will continue to look for highs. Otherwise, a small cycle peaking signal will be formed at this position. The current support below the hourly line is located at the MA5 and MA10 moving averages, and the focus is on the MA10 support 3185 line. Comprehensive thinking: The current price is oscillating at a high level, and the short-term focus is on the 3245 line. If it breaks through, the price will continue to move upward. The current focus below is the support near 3190. If it falls below, the price may move to around 3150-3135.
Strategy: Currently, the 3440-50 area is temporarily set to see pressure adjustment
Go long if the key support is stabilized below, and pay attention to 3187-3170 -3153-you can go long

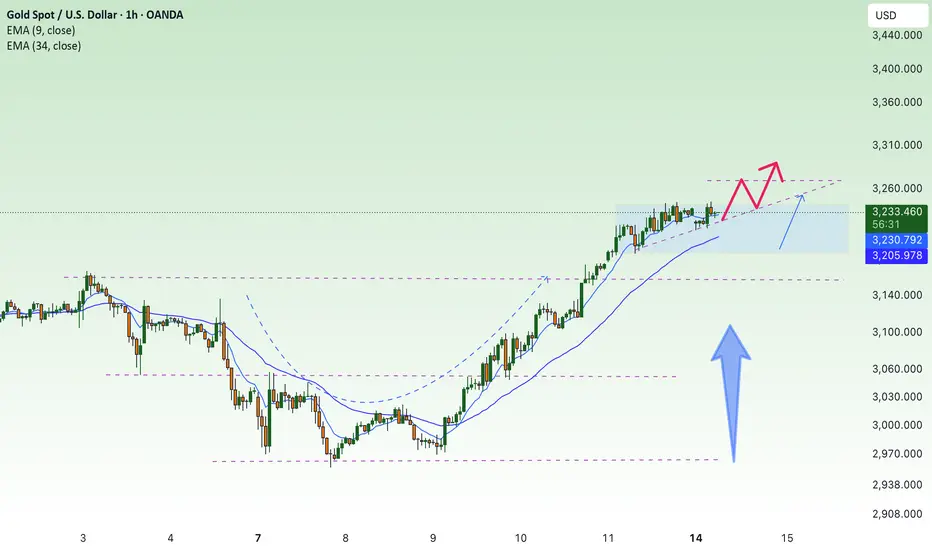
GOLD Analysis: Will buyers push toward 3,230?OANDA:XAUUSD continues to trade within a clearly defined ascending channel, with price action consistently respecting both upper and lower boundaries. The recent price action suggests buyers are currently in control, indicating the potential for continued upside.
Given the strength of the current bullish momentum, there is a strong likelihood that price may break above the key resistance zone. If that happens, it could come back to retest the level as support before continuing higher. A successful retest would reinforce the bullish structure and open the door for a potential move toward the 3,230 target, which aligns with the channel’s upper boundary.
However, if price fails to break above the resistance zone, it could signal weakening bullish momentum and open the door for a deeper pullback toward the lower boundary of the ascending channel.
Always confirm your setups and manage your risk accordingly.
Best of luck!

Gold is superb bullishAs we all knows that Chin and US trade war bringing gold to more higher and I still believe that it may not pause. Better to look buying on every dip.
