Gold & Silver Soar: Trade War RallyAnatomy of a Rally: How US-China Trade Tensions Propelled Gold to Record Highs and Lifted Silver
Introduction
The global financial landscape is frequently reshaped by geopolitical events, and few have cast as long a shadow in recent memory as the trade tensions between the United States and China. During periods of heightened friction, characterized by escalating tariffs, retaliatory measures, and pervasive economic uncertainty, markets often witness significant shifts in asset allocation. One of the most prominent beneficiaries during such times is gold. This document explores the dynamics behind gold prices reaching record highs amidst a US-China trade war, examining the multifaceted reasons for its ascent and noting the concurrent, significant rise in silver prices, which often move in tandem with the yellow metal due to overlapping market drivers.
The US-China Trade War: A Catalyst for Uncertainty
The trade conflict between the world's two largest economies represents more than just a dispute over tariffs and trade balances. It embodies a fundamental clash over technology, intellectual property, global influence, and differing economic models. The imposition of tariffs on hundreds of billions of dollars worth of goods creates direct economic consequences:
1. Increased Costs: Businesses face higher import costs, which can be absorbed (reducing profits), passed onto consumers (potentially fueling inflation), or lead to shifts in supply chains (causing disruption and inefficiency).
2. Reduced Trade Flows: Tariffs act as barriers, potentially dampening global trade volumes and impacting export-oriented economies.
3. Economic Growth Concerns: The uncertainty surrounding future trade policies makes businesses hesitant to invest and expand, potentially leading to slower global economic growth or even recessionary fears.
4. Supply Chain Disruptions: Companies reliant on cross-border supply chains face significant operational challenges, needing to find alternative suppliers or routes, often at higher costs and lower efficiency.
5. Currency Volatility: Trade disputes can lead to fluctuations in exchange rates, particularly involving the US dollar and the Chinese yuan, adding another layer of risk for international businesses and investors.
This pervasive uncertainty becomes a powerful driver pushing investors towards assets perceived as safe.
Gold: The Quintessential Safe Haven
Gold's reputation as a safe-haven asset is deeply ingrained in financial history. During times of economic stress, political instability, or market turmoil, investors flock to gold for several key reasons, all amplified by a US-China trade war:
1. Store of Value: Unlike fiat currencies, which can be devalued by inflation or government policy, gold is seen as retaining its intrinsic value over the long term. Fears that trade wars could lead to competitive currency devaluations or necessitate inflationary monetary policies (like extensive quantitative easing) make gold particularly attractive.
2. Hedging Against Uncertainty: When the outlook for traditional assets like stocks and bonds becomes cloudy due to geopolitical risks like a trade war, gold offers a perceived refuge. Its price often exhibits a low or negative correlation to equity markets during downturns, making it valuable for portfolio diversification.
3. Geopolitical Risk Premium: Major international conflicts or tensions invariably add a risk premium to gold prices. A trade war between global superpowers significantly elevates perceived geopolitical risk, prompting safe-haven buying.
4. Weakening US Dollar Potential: While the US dollar itself can act as a safe haven, a protracted trade war could raise questions about the US economic outlook or lead to policies aimed at weakening the dollar to boost exports. Since gold is typically priced in US dollars globally, a weaker dollar generally makes gold cheaper for holders of other currencies, potentially increasing demand and pushing the dollar price higher.
5. Central Bank Demand: In an environment of heightened geopolitical tension and questions surrounding the dominance of the US dollar, central banks (particularly those in emerging markets or nations seeking to reduce reliance on the USD) often increase their gold reserves. This diversification strategy provides a steady source of demand, underpinning prices. A US-China trade conflict could accelerate this trend among various nations.
6.
The Mechanics of the Price Surge
The record high in gold prices isn't just a passive reaction; it's driven by active market dynamics:
• Increased Investor Demand: Retail and institutional investors increase allocations to gold through physical bullion, gold futures contracts, and gold-backed Exchange Traded Funds (ETFs). Large inflows into major gold ETFs are often a visible indicator of this heightened demand.
• Speculative Activity: Traders in the futures market anticipate further price increases driven by the ongoing trade tensions and safe-haven flows, adding upward momentum.
• Sentiment: Market psychology plays a crucial role. As prices rise and news headlines focus on the trade war and gold's rally, a positive feedback loop can emerge, drawing in more buyers afraid of missing out (FOMO).
Silver's Ascent: Riding Gold's Coattails and Its Own Merits
Silver prices registering a steep rise alongside gold during such a period is a common phenomenon, though its drivers are slightly more complex:
1. Monetary Asset Correlation: Silver, like gold, has a long history as a monetary metal and store of value. It often trades as "poor man's gold," attracting investors seeking safe-haven exposure at a lower price point per ounce. During strong gold rallies driven by macroeconomic fear, silver typically follows suit.
2. Industrial Demand Component: Unlike gold, silver has significant industrial applications (electronics, solar panels, medical devices). This is a double-edged sword during a trade war. While safe-haven demand pulls prices up, fears of a trade-war-induced global economic slowdown could theoretically dampen industrial demand, potentially capping silver's gains relative to gold. However, in scenarios where safe-haven buying dominates market sentiment, this factor often takes a backseat initially.
3. Higher Volatility: Silver markets are smaller and typically more volatile than gold markets. This means that significant inflows driven by safe-haven sentiment can lead to sharper percentage gains (and potentially sharper losses during corrections) compared to gold. The "steep rise" noted is characteristic of silver's higher beta.
4. Gold-Silver Ratio: Traders often watch the gold-silver ratio (the number of silver ounces needed to buy one ounce of gold). When this ratio reaches historical extremes, some investors may buy silver, betting that it is undervalued relative to gold and that the ratio will revert closer to its historical mean. A major gold rally can stretch this ratio, triggering such trades and boosting silver demand.
Global Trends and Context
While the US-China trade war serves as a potent catalyst, it often occurs within a broader context of global trends that can support precious metal prices. These might include accommodative monetary policies from major central banks (low interest rates reduce the opportunity cost of holding non-yielding assets like gold), existing geopolitical hotspots beyond the US-China relationship, concerns about sovereign debt levels, or nascent inflationary pressures. The trade war acts as an accelerant, amplifying the impact of these underlying factors on gold and silver.
Conclusion
The surge of gold prices to record highs during a period marked by an intense US-China trade war is a textbook example of the metal fulfilling its traditional role as a premier safe-haven asset. The conflict breeds deep economic uncertainty, stokes fears of currency devaluation, heightens geopolitical risk perception, and potentially influences central bank reserve policies – all factors that historically drive capital towards gold. The simultaneous sharp rise in silver prices underscores its strong correlation with gold as a monetary asset, benefiting from the same wave of risk aversion, albeit with the added complexity of its industrial demand profile. Understanding these dynamics is crucial for investors navigating volatile periods, highlighting gold's enduring appeal as a portfolio diversifier and a refuge when storm clouds gather over the global economy, particularly when sparked by friction between major world powers.
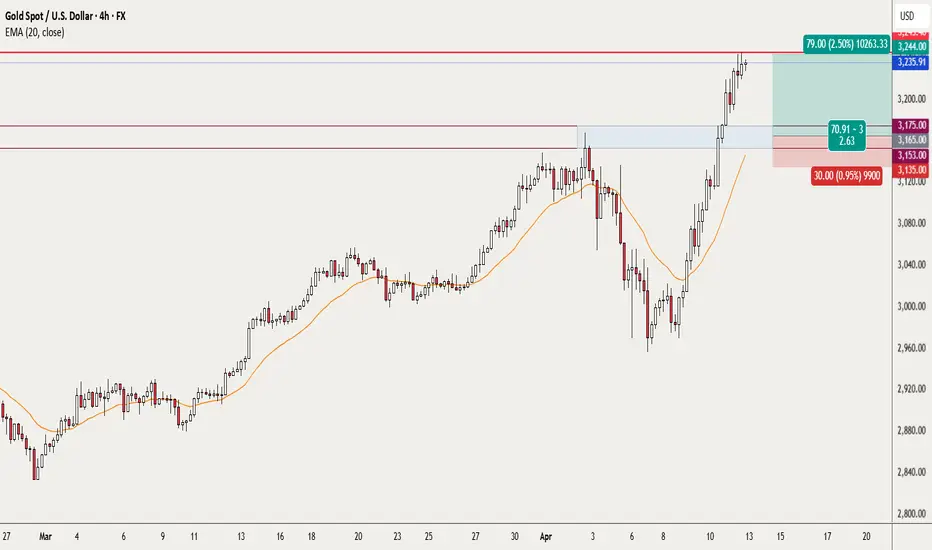
Xauusdlong
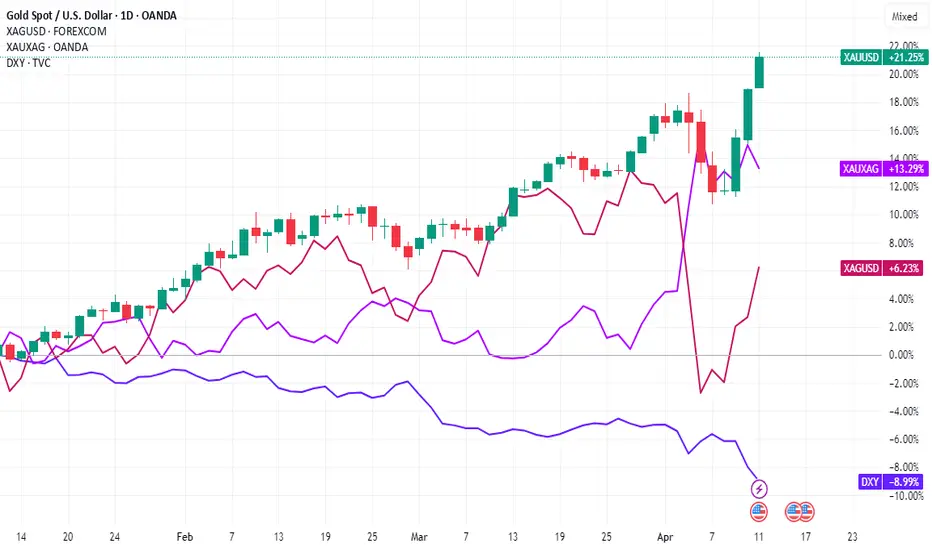
Investors seek refuge and gold is providing it!! The US dollar, equity and bond markets have all been hit hard and money has not turned to US treasuries either. I guess confidence on anything directly related to the USA is very low right now. No surprise that investors chose to place their faith in Gold, a precious metal that has been bullish since 2016.
However, finding a suitable entry especially in a parabolic trend is not easy. I am hoping for a pullback, perhaps in the region between 3175-3153 as shown on my chart. This region has acted as resistance earlier this month and recently, price broke above it. A pullback has not occurred yet and I am hoping this will happen this week. In the event that it does, that will provide traders a good location for entry and stop placement. Price will also narrow the gap it currently has with the 20ema (mean reversion).
Initial target can be the current high of 3245.40, with the strong possibility that price will extend even higher.
This is not a trade recommendation; it’s merely my own analysis. Trading carries a high level of risk, so only trade with money you can afford to lose and carefully manage your capital and risk.
If you like my idea, please give a “boost” and follow me to get even more. Please comment and share your thoughts too!!
It’s not whether you are right or wrong, but how much money you make when you are right and how much you lose when you are wrong – George Soros
A Weekly Summary of Gold: Continuously Breaking New Highs! This week, the gold market has been performing remarkably. It has continuously broken through all - time highs within just two days. Spot gold opened at $3088.17 per ounce, and its price has been oscillating upwards all the way, reaching a high of $3248 per ounce.
The gold market has witnessed a significant rally under the combined effect of various factors. Geopolitical risks have continued to provide a safe - haven support for gold. Factors such as the impact of tariff policies at the economic policy level have promoted the rise in gold prices from different perspectives. Market sentiment has also shifted from the previous panic selling to positive buying.
In the future, the economic data released by the United States and the policy expectations of the Federal Reserve will have an impact on the price of gold. The market's expectations for the Federal Reserve's interest rate cuts are constantly changing, and we need to keep a close eye on the relevant information.
If you approve of my analysis, you can give it a thumbs-up as support. If you have different opinions, you can leave your thoughts in the comments.Thank you!

XAUUSD will it break through 3200?At present, the price of gold is just one step away from its all-time high. Will it break through to a new high?
3,168 is a strong resistance point. Once this level is broken through, gold may have a chance to surpass the 3,200 mark.
Leave your opinions in the comments, and let's discuss them together.

Gold Prices Continue Uptrend Short-Term Bullish Opportunity EmeSCurrently, gold prices are exhibiting an upward trend, fluctuating between $3230 and $3233. Based on market analysis, it is anticipated that gold prices will continue to rise. It is recommended to enter long positions near $3230, with a target profit around $3235 to secure short-term gains. Continue to monitor market developments, maintain profits, and adjust stop-profit levels as necessary to navigate potential market fluctuations.

Gold Prices Decline, Short Strategy Successfully Captures ProfitCurrently, gold prices are showing a clear bearish trend, previously fluctuating around $3240. Based on market predictions, there is a potential for further downward movement in gold. A short position was suggested around the $3240 level, and as the market corrected, gold prices have indeed dropped, allowing short-positioned investors to lock in profits. Congratulations to those who successfully capitalized on this short opportunity and secured gains. Stay alert to market developments and carefully adjust your stop-profit levels to ensure the stability of your returns.

Gold's safe-haven demand surgesThis week, concerns over a global economic slowdown have swept across Wall Street, becoming the dominant market sentiment. In this context, U.S. President Trump's erratic messaging on tariff policies has triggered a panic sell-off in U.S. stocks, bonds, and the dollar, highlighting gold's position as a safe-haven asset. Gold prices have surged sharply, breaking through all previous resistance levels and maintaining an upward trend. Given the ongoing risk-off sentiment, the bullish momentum in gold remains strong, and the market may continue to trend higher in the near term.
In this market environment, it is recommended that investors take long positions near $3220 and consider taking profits around $3230 to fully capitalize on the current uptrend in gold. For additional trading signals, Please stay tuned.

Gold Breaks $3240, Shorting Opportunity EmergesGold prices have now surged to around $3240, continuing the recent strong upward momentum. Based on the previous trading signal, a long position at $3220 was suggested; however, due to the high volatility, many investors may have missed the opportunity to go long at that level. At this point, with prices approaching $3240, it may be an opportune time to establish short positions, with a target profit around $3225. Please note that this is just personal advice, and actual trading decisions should be made with attention to changes in key price levels.

US tariffs have caused XAU/USD's continuous rise.Surge in Safe - haven Demand:US tariff hikes heighten trade tensions, stoking fears of global economic slowdown. Worried about rising corporate costs and supply - chain disruptions, investors flock to gold, a traditional safe - haven, to hedge risks, pushing its price up 📈.
Highlighted Anti - inflation Property:Higher tariffs may boost imported - goods prices, fueling inflation. Gold, with stable value in inflation, is favored by investors as a wealth - preserving asset, thus driving its price higher 💰.
Dollar Substitution Effect:Uncertain US tariff policies raise dollar credit risk, eroding market confidence. Some investors cut dollar - asset holdings and turn to gold, lifting gold demand and price. Also, expected Fed rate - cuts due to tariffs pressure the dollar, further pushing up gold price as low - rate environments benefit non - yielding gold 💴.
Once the trade war ignited by tariff disputes shows signs of improvement or when peace negotiations commence, XAU/USD is highly likely to witness a substantial decline ↓.
This upward movement has led to the clearing of many traders' accounts or significant losses 😫. You can follow my signals and gradually recover your losses and achieve profitability 🌟.
Traders, if you're fond of this perspective or have your own insights regarding it, feel free to share in the comments. I'm really looking forward to reading your thoughts! 🤗

Gold may face sharp fluctuations,The risk of downside increases!Technical analysis: Gold daily line rose by more than $100 on Thursday, creating a rare single-day increase in more than ten years. The cumulative increase in three days exceeded $200, and the technical indicators were overbought. The current gold price is in the stage of accelerating to the top. In the short term, pay attention to the resistance of the 3245-3250 area, and be alert to the risk of falling back after a high. Although the trend is still strong, the effectiveness of technical analysis is weakened under the guidance of news. It is recommended to focus on high altitude. This week is the fifth week of rising, and the probability of a change on Friday increases.
Ⅰ: The daily indicator macd golden cross is initially established, and the smart indicator sto quickly repairs upward, representing the bullish trend of the price. At present, because it is a historical high, there is no resistance point to judge, so we can only try it based on the small cycle indicators. The current support point of the daily line is located near the moving average MA5 and MA10, 3096-3088, and it is not considered to be far away from the candlestick chart.
Ⅱ: The current macd high golden cross in 4 hours is oscillating with large volume, and the smart indicator sto is overbought, which means that the price is oscillating at a high level. Because the indicators are at a relatively high level, they may face short-term peak signals at any time. Currently, we are focusing on the support line of 3176 near the MA5 moving average.
Ⅲ: The hourly MACD is currently oscillating with large volume, and the dynamic indicator STO is overbought, which means that the hourly line is still oscillating strongly. The current focus is on the 3220 line*. If it breaks through 3220 this hour, it will continue to look for a high point. Otherwise, a small cycle peak signal will be formed at this position. The current support below the hourly line is located at the MA5 and MA10 moving averages, and the focus is on the MA10 support line of 3185. Comprehensive thinking: The current price is oscillating at a high level, and the short-term focus is on the 3220 line*. If it breaks through, the price will continue to move upward. The current focus below is the support near 3190. If it falls below, the price may move to around 3150-3135.
Strategy: Refer to 3440-45 for short selling


GOLD (XAU/USD) Hits ATH – Discover the Market EdgeHi Guys,
I’ve been testing my edge for the past 5 months, and it’s been crazy what I’ve discovered so far. It might sound a little wild, but there’s a way to compare another market that leads 3–5 days ahead and gives clear trend signals for Gold Futures — which moves in tandem with XAU/USD, with only a few dollars' difference.
You can see a pullback here, but sometimes it shoots straight to an all-time high. Taking current geopolitics into consideration, the markets are extremely volatile. Before Trump started the trade wars, I opened an account with 1:500 leverage (starting capital $150, grew to $500) and made significant profits just by catching the moves and trends I was able to predict.
From a math standpoint, if it were just coincidence, I would’ve been liquidated a long time ago. I’ve been through everything — this isn’t luck. I remember one day, I was watching Bloomberg live and the news anchor said, “I can’t believe gold is dropping,” — but I had predicted that move days earlier, haha! That was triple confirmation that I have an edge and that algorithms are actually following it.
There were also days when I expected a small pullback the next day, but it happened during the NY session because of some news — and it couldn’t push lower. Sellers in the TradingView chat was going crazy. The next day, during the London session, it started reaching the ATH (as I predicted). The pressure was intense, but the algorithm didn’t allow it to go lower than the previous low — and that structure came from my leading market edge!
In this case, the pullback might not happen — and if it doesn’t, we’ll break the current ATH and easily go long after that. As I mentioned, in these volatile markets, with tariffs going back and forth, the buying pressure and constant news are so intense that the market sometimes doesn’t even have time to make a pullback! If you have good capital and trade with low leverage, you can easily go long now and keep adding to your position with every pullback until we hit the new ATH!
Now, gold is going to reach a new ATH again — that’s 110%. I believe we’ll easily hit $3200+, followed by a pullback to around $3100.
Next gold move:
ATH: $3200 – $3350
Pullback: ~$3100
Re-test of ATH area — consolidation in that zone until the next major news event.

Gold Shaking Hands with All-Time HighsSafe-haven assets caught a strong bid in recent trading, directing Spot Gold to all-time highs of US$3,220/troy ounce versus the US dollar (XAU/USD). The shift towards safe-haven markets was fuelled by softer demand for the USD as markets fled dollar assets, as well as escalating trade tensions between the US and China. Unsurprisingly, the Swiss franc (CHF) and Japanese yen (JPY) also attracted substantial bids, with the USD/CHF pair notching up losses of nearly 4.0% – its largest one-day drop since 2015!
Monthly Resistance and Oversold Conditions
Several desks are reportedly eyeing US$3,500 as the next upside objective for Gold; however, the monthly chart reveals it is considerably overbought according to the Relative Strength Index (RSI). You will note the RSI has remained within overbought territory since mid-2024 and recently touched gloves with familiar resistance between 87.31 and 82.20. This area boasts historical significance from as far back as 2006, and each time the Index has approached the resistance, a correction/pause typically followed in the yellow metal. Consequently, it raises the question about whether buying is set to moderate/pause at the monthly resistance area between US$3,264 and US$3,187 (made up of 1.618% and 1.272% Fibonacci projection ratios, respectively).
Daily Demand Zone; Dip-Buying?
Meanwhile, on the daily chart, price action came within a stone’s throw of testing support from US$2,942 at the beginning of the week before rallying to all-time highs noted above. What is interesting from a technical perspective is that the move left behind a demand area at US$3,000-US$3,058, which, in my opinion, represents a key technical zone.
With Gold firmly entrenched in a strong uptrend, dip-buyers could emerge from the daily demand area if a correction occurs. That said, given technical indicators on the monthly chart suggesting buyers could pump the brakes, any dip-buying activity would likely be approached with caution. Confirmation – such as a bullish candlestick signal or supporting price action on lower time frames – might be required before pulling the trigger. However, any movement below the mentioned demand area signals bearish strength from the monthly resistance zone, and potentially opens the door to short-term selling opportunities, targeting daily support at US$2,942, closely followed by support at US$2,865, and possibly US$2,790.
Written by FP Markets Chief Market Analyst Aaron Hill

Insight into the gold market situation and seize the opportunityHello everyone! After in-depth research and analysis of the recent market conditions, I believe that the current market has entered the stage of accelerating to the top.
From a technical point of view, such as the MACD top divergence sign, the KDJ indicator oversold, etc., all signs show that the market's upward momentum is gradually weakening, while the price is rising rapidly, which is often a typical feature of the peak stage.
The focus needs to be on the 3225-3235 area. This range has important resistance significance and has dense locked-in disks. On the other hand, through technical analysis tools such as the Fibonacci sequence, this range is also an important pressure range.
For investors with short trading rights, this is a rare opportunity to go high and short. When the price reaches the 3225-3235 area, it is a relatively ideal time to enter the short market. The one-hour moving average golden cross is formed, but after the upper rail of the Bollinger band is broken, the technical overbought risk increases, and the support near 3150 is effective. 80 points are also possible, so don't look at the current trend with a conventional perspective.

Gold bulls are rising higherGold's 1-hour moving average continues to spread upwards and bulls are spreading. Gold bulls are full of strength. Gold still has upward momentum. The pullback will continue to give opportunities to go long.
Trading idea: Go long near gold 3175, stop loss 3165, target 3210
The above is only a sharing of trading ideas and does not constitute investment advice. You need to be responsible for your own profits and losses.

Gold trading zones: 11-APRIL-2025Daily Gold trading zones: Identifying potential opportunities for informed traders.

GOLD WEEKLY CHART MID/LONG TERM ROUTE MAP UDPATEDWeekly GOLD Analysis – Quantum Trading Mastery
Hello Everyone,
Here’s the latest update on the GOLD weekly chart we’ve been diligently tracking and trading. Below is a comprehensive breakdown of the current range and key levels we’ve identified.
Recap of Last Week’s Analysis:
Last week, our predictions aligned perfectly with market movements:
* A strong resistance level at 2790 caused a short-term reversal near 2735.
* The FVG acted as dynamic support at 2735, sustaining the bullish momentum.
* The EMA5 crossed and locked above the key level at 2735, solidifying upward movement.
* As predicted, the resistance was broken, leading to a new all-time high of 2817.
Our analysis delivered precise predictions, allowing you to trade confidently and minimize risks.
What’s Next for GOLD This Week?
Key Level: 2735
Bullish Targets:
* TP1: 2877
* TP2: 3018
* TP3: 3160
Bearish Targets:
* 2735
* 2680
* 2595
This week, we have identified two critical GOLDTURN levels at 2735 and 2595. While we anticipate GOLD reaching TP1 at 2877, there may be short-term reversals around these key levels and GOLDTURN zones.
Recommendations:
To better understand the support structure and identify optimal dip-buying opportunities, review our smaller time-frame analyses (daily, 12H, 4H, and 1H). These insights will help you navigate the market with precision, keeping long-term gaps in perspective.
We’ll continue to provide daily updates and insights to keep you informed.
Thank you for your continued support! Don’t forget to like, comment, and share this post to help others benefit as well.
The Quantum Trading Mastery

growth - new ATH - gold hits 3246⭐️GOLDEN INFORMATION:
Trump announced Wednesday that tariffs would be temporarily reduced for dozens of countries, offering a short-term reprieve. However, he simultaneously hiked tariffs on Chinese imports to 125% with immediate effect, following Beijing’s retaliatory move to impose 84% duties on US goods. The escalating trade conflict between the world’s two largest economies has reignited concerns over global growth, prompting investors to seek refuge in safe-haven assets like Gold.
“Gold is reclaiming its safe-haven status and appears poised to chart fresh all-time highs,” said Nikos Tzabouras, Senior Market Analyst.
Meanwhile, scaled-back expectations for aggressive Federal Reserve rate cuts could lend support to the US Dollar, potentially limiting gains for the USD-priced metal. That said, traders still anticipate the Fed will begin easing in June, with markets pricing in a full percentage point of rate reductions by year-end.
⭐️Personal comments NOVA:
Gold price continues to increase greatly, the fomo market and attention are focused on the gold investment channel: safe, continue to find new ATH zones
⭐️SET UP GOLD PRICE:
🔥SELL GOLD zone : 3245- 3247 SL 3252
TP1: $3230
TP2: $3210
TP3: $3190
🔥BUY GOLD zone: $3168 - $3166 SL $3163 scalping
TP1: $3175
TP2: $3183
TP3: $3190
🔥BUY GOLD zone: $3134 - $3132 SL $3127
TP1: $3145
TP2: $3160
TP3: $3175
⭐️Technical analysis:
Based on technical indicators EMA 34, EMA89 and support resistance areas to set up a reasonable BUY order.
⭐️NOTE:
Note: Nova wishes traders to manage their capital well
- take the number of lots that match your capital
- Takeprofit equal to 4-6% of capital account
- Stoplose equal to 2-3% of capital account

Accurately capture the gold pullback, shorting is the right timeDuring this period, spot gold has been like a rocket, advancing all the way and firmly in the upward channel. I have repeatedly reminded everyone before that once the US tariff stick is swung, the gold price will definitely rush up like a chicken blood. No, the facts prove that our prediction is quite reliable!
Tonight, the market ushered in another "big news" - the release of CPI data. As soon as this data came out, it directly gave the gold price a "heart shot", and the gold price was instantly pushed to around US$3160. This rise is too crazy! Interpret this data as soon as possible and pay close attention to the reaction of the gold market.
However, when the gold price rose to the previous high of US$3158-3168, it was like hitting a wall and began to "struggle". From my technical analysis point of view, there is a relatively strong resistance level in this range. It's like a person climbing a mountain, climbing to a certain height, and encountering a steep cliff. If you want to continue to go up, you have to work hard. At present, the gold price is under pressure at this position, and there are some signs of a correction. This provides us investors with a small opportunity to consider trying a short position here and earn some spread profits. I also suggest that investors can properly seize this short-term opportunity.
For example, the current gold market is like a fierce football game. The long team is strong and has been attacking all the way, and is in a dominant position. The short team can only seize the opportunity occasionally and make a quick counterattack. We investors are like coaches, and we must arrange tactics reasonably according to the situation on the field. When the long side is dominant, we can use short selling to increase our profits in a timely manner. I hope everyone can accurately grasp the market rhythm like an excellent coach.

Gold: Sell@3188-3200Gold has continued its strong rally, hitting a new all-time high, with bullish sentiment running extremely hot.
However, we must approach this rationally — every new high is usually followed by a technical pullback.
Currently, the 3200 level is a significant psychological resistance, as well as a key threshold for short-term bullish momentum.
From a technical perspective, the sharp recent rally has shown signs of momentum exhaustion, with clear overbought signals emerging.
📌 Strategy Suggestion:
Consider building short positions around the 3188–3200 zone
If 3137 is broken, further downside could extend to 3112–3090
⚠️ Risk Management Notes:
The larger the rally, the stronger the pullback potential
Avoid chasing long positions at these levels to prevent getting trapped at the top
Keep position sizes under control and set stop-losses to guard against sudden volatility
Wishing everyone smooth trades and solid profits!

4/11 Gold Trading StrategyFresh High Above 3170 – Momentum Continues, but Chasing Longs Is Risky
Gold delivered a strong one-sided rally yesterday, rising from around 3078 to above 3170, setting a fresh short-term high. While CPI and jobless claims data were modestly bullish, most of the rally occurred before the data release, suggesting that the move was primarily technically driven rather than fundamentally triggered.
As we anticipated yesterday, the price did reach above 3170 , and as clearly stated, we did not recommend chasing long positions at those highs. This view remains unchanged today.
🔍【Technical Insights】
The recovery from 2955 back to 3160+ took just 2 sessions, versus 4 sessions for the prior drop from 3167 — a clear sign of momentum dominance.
The daily chart shows two strong bullish candles, typically a sign of follow-through potential.
However, new highs reached under this structure tend to attract profit-taking and possible pullbacks.
If a technical correction occurs, look to 3143–3128 as a meaningful support zone for long opportunities.
🎯【Today's Gold Trade Setup】
🔻Sell Zone: 3188 – 3215
Look for short entries near resistance after overextension
🔺Buy Zone: 3134 – 3112
Wait for a healthy pullback to consider long positions
🔄Range Zone: 3178 – 3143
Flexible trading range — favor quick in/out trades in the zone

Gold (XAU/USD) at a Major Decision Zone! Gold is trading inside a rising channel on the 15-minute timeframe, and we're now at a critical resistance level. This setup is giving us two potential trade opportunities:
📍 Scenario 1 – Bullish Breakout 📈
✅ If price breaks above the midline resistance, we could see a strong push towards the upper trendline at $3,120 - $3,140
✅ A confirmed breakout with momentum may even take price to fresh highs 🚀
📌 Bullish confirmation: A strong candle close above the midline with volume
📍 Scenario 2 – Bearish Rejection 📉
❌ If price fails to break above, we might see a drop back towards the lower trendline at $2,980 - $2,960
❌ A false breakout (wick above resistance but no strong close) could signal a reversal 📉
📌 Bearish confirmation: Rejection candle with increased selling pressure
🔎 Key Levels to Watch:
🔹 Resistance: $3,080 (midline), $3,120 (upper channel)
🔹 Support: $3,000 (psychological), $2,980 (lower channel)
📢 What’s your bias? Do you see Gold breaking out or pulling back? Drop a comment below! 👇🔥
#XAUUSD #Gold #Forex #TradingView #PriceAction #Breakout #TechnicalAnalysis

XAU/USD Gold Price Analysis – Bulls Reclaim Key Levels📊 Gold (XAU/USD) is showing bullish momentum after bouncing from a key demand zone. Will we see a breakout toward $3,141?
🔥 Key Technical Levels
🔹 Major Support Zone: $2,979 – $3,011 (Strong demand area, where buyers stepped in)
🔹 Mid-Range Resistance: $3,061 (Key reaction level; breakout here could fuel more upside)
🔹 Major Resistance Zone: $3,141 – $3,160 (Supply zone; strong seller interest in this area)
📉 Price Action Breakdown
✅ Gold recently dropped into a high-volume demand zone (orange area) around $2,979, where buyers aggressively pushed the price back up.
✅ Now, price is approaching $3,061, a key pivot level. If bulls break above this, a push toward $3,141 becomes highly likely.
✅ If price struggles to break $3,061, we could see a retest of $2,979 before another potential bounce.
📢 Trading Plan & Market Outlook
🔹 Bullish Scenario: A strong close above $3,061 could open the door for a rally toward $3,141 – $3,160. Traders may look for breakout buys above $3,061 with stop-losses below recent swing lows.
🔹 Bearish Scenario: If price fails to break $3,061, sellers could regain control and push gold back toward $2,979, making it a key decision point.
💬 What’s your bias? Are you buying the breakout or waiting for confirmation? Drop your thoughts in the comments! 👇
#gold #XAUUSD #forex #trading #supplyanddemand #pricetrading
