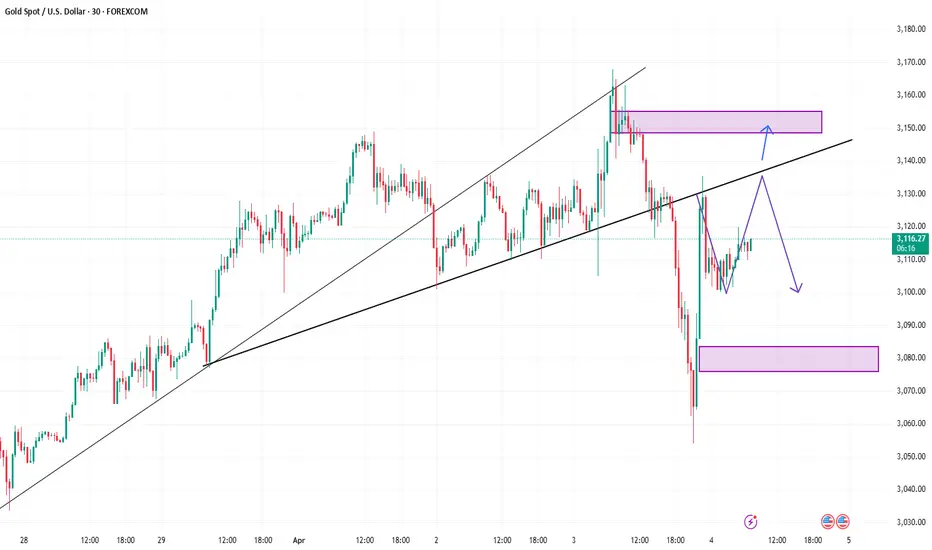
Gold Needs a upward correctionGold price crashed over 2.8% as Powell turns hawkish on tariffs and inflation. But right now gold needs a upward correction. There is a bell curve area and market left multiple sps.
Fundamental is also on gold side. Safe heaven movement is still on because of tariff and war situation.
Xauusdlong

DXY Breaking Down?The US Dollar Index (DXY) may be entering a strong bearish wave. After completing wave B, the market has started impulsive wave C to the downside. Currently, wave 3 might be ending, with a potential short-term bounce for wave 4, followed by a drop into wave 5.
Key Bearish Outlook:
Resistance Zone (Wave 4): 104.924 – 104.932
Invalidation Level: 106.505
Final Wave 5 Target: Near 93.422
If price stays below the invalidation level, more downside is expected. Watch for shorting opportunities if wave 4 completes and reverses.

Gold: Will Price Rebound from Demand Zone?On this wonderful collapse yesterday we saw that the price reached the demand zone, from which it can finally reach the level of 3200 and go higher. We are buying!

GOLD BUY SCALP EDUCATIONAL BREAK DOWN FOR LEARNERS LIVE TRADEGold prices are accelerating their daily decline, steadily approaching the critical $3,000 per troy ounce mark as the Greenback's rebound gains extra momentum and US yields tighten their retracement.

"Gold Approaching Key Support – Will Bulls Take Control?"🔹 Market Structure:
Gold is currently in a corrective phase after a strong bullish run, facing a pullback from recent highs around $3,160. The price has now approached a key horizontal support zone near $2,980 - $3,020.
🔹 Key Levels:
✅ Resistance: ~$3,160 (previous high)
✅ Horizontal Support: ~$2,980 - $3,020 (marked in blue)
✅ Target Level: ~$3,099 (potential bounce area)
🔹 Potential Scenarios:
1️⃣ Bullish Reversal: If the price finds support in the marked zone and forms bullish confirmation (e.g., hammer candle, bullish engulfing), we could see a retest of $3,099 and potentially higher levels.
2️⃣ Breakdown Scenario: If support fails, gold may see further downside towards $2,950 or lower.
🔹 Trading Plan:
📈 Buy Setup: Look for bullish confirmation near support (~$3,020) with a target of $3,099 - $3,120.
📉 Sell Setup: If support breaks, short positions could target $2,950 - $2,920.
🔸 Bias: Bullish above support, bearish below it.
🔸 Risk Management: Use a stop-loss below support (~$2,980) to manage risk.
Would you like me to refine this further or add any indicators like RSI, Moving Averages, etc.? 🚀

Gold market analysis, gold operation strategy and trend analysisGold early layout plan: intraday top and bottom capture is perfect! The strategy layout is truly presented, the strategy prompts shorting at 3135, accurately cashing in the high point, and falling sharply to 3070! Continue to arrange 3072 long positions to smoothly stop profit and exit at 3086.
Gold fell by 110 yesterday and rebounded by 80. Today it fell by 30 and rebounded by 50. The volatility is too big. However, the risk comes first. Strictly set a stop loss. Loss of $5-$20 makes no difference. It is not a big loss. Secondly, grasp the key points. Pay attention to a few points of non-agricultural data and cooperate with the five-minute entry on the right side. As for long and short, it is really not very important. What is important is the key position and starting point. After multiple cycles of quantification, pay attention to a few important points at night. After the operation is in place, enter the market with the resonance of one minute and five minutes. The loss is 5-6 points, and the target is 15-20 points.
Operation strategy 1: It is recommended to buy at 3018-3025, and the loss is 3005, and the target is 3035-3045

XAU/USD potential Longs from 2990 back up to 3,100This week, I’m considering both short- and long-term opportunities on gold. We’ve recently seen a change of character to the downside, and there’s a clean 1-hour supply zone that could trigger a short-term bearish reaction.
That said, there’s also a lot of nearby liquidity resting below, which I expect price to sweep first. If that happens, I’ll be watching the 20-hour demand zone—a strong area that could spark a new bullish rally from the lows.
Confluences for GOLD Buys:
- Price has recently cleared a new all-time high (ATH), indicating continued bullish strength.
- Market structure remains overall bullish, suggesting this move down may be a temporary correction.
- The 20-hour demand zone sits just below key liquidity and looks highly valid.
- Untouched Asia session highs remain above, which price is likely to target.
- The DXY is moving bearish, aligning with a bullish outlook on gold due to their inverse correlation.
Note: If price reacts from the current demand zone (which is also valid), we could see Scenario B play out first—a rally followed by a short move to clear liquidity before heading higher.
Stay patient and trade safe, everyone!

Gold ( XAUUSD ) Forecast for the next weekIf Gold stay at 3020 today than it will move up side again otherwise it will hit strong support of 3000 and than Gold start its rally again upside. Be patience and watch closely.

Gold Rebound Looms: Don’t Miss the $50 OpportunityDuring his ongoing speech, Powell mentioned that tariffs may push inflation higher in the coming quarters. While inflation is currently close to the 2% target, it still remains above it. The market has already begun to anticipate a Fed rate cut, which is a potential bullish signal for gold.
From a technical perspective, the recent drop has partially corrected the previous bearish divergence. However, the divergence on the 1D chart still requires more time to be fully resolved.
At the current level, gold appears oversold. I do not recommend chasing short positions here. A short-term rebound is very likely, with a potential upside target between 3078-3096. If you manage the trade well, there’s an opportunity to capture at least $50 in profit.
If you’re currently holding long positions that are under pressure, stay strong. Don’t give up before the dawn — yesterday was a great example of why persistence matters.

Gold's Next Big Move? Don't Miss This Trade!Hi traders!, Analyzing XAU/USD on the 1H timeframe, spotting a potential long entry:
🔹 Entry: 3,027.23
🔹 TP: 3,064.31
🔹 SL: 2,990.15
Gold is testing a key support level near 3,027, coinciding with the 200 EMA. If buyers step in, we could see a bounce toward 3,064. RSI is approaching oversold levels, suggesting a possible reversal.
⚠️ DISCLAIMER: This is not financial advice. Every trader makes their own decision.

#XAUUSD: Last Sell Idea Dropped +300 Pips, Bias Changed? XAUs price behaviour has deviated from previous analysis, which had anticipated a +300 pips increase. However, we now anticipate the price to continue its upward trend, potentially reaching another record high. Our next target price range is estimated to be between 3170$ and 3200$.
We extend our best wishes for your successful trading endeavours. To enhance your trading outcomes, we strongly recommend employing accurate risk management techniques.
Team Setupsfx_
🚀❤️

4/4 Gold Trading StrategiesAfter yesterday’s sharp drop, gold quickly rebounded, and by the end of the session, prices had returned close to the opening level. I’m not sure if anyone is currently stuck in unfavorable positions. Under normal circumstances, if your account has sufficient margin and risk tolerance, such volatility shouldn’t cause major damage. However, for those with weak positions or who bought at the top or sold at the bottom, losses may have occurred—especially common among newer traders who are often influenced by emotions.
If you are currently holding short positions and hoping to wait for a price pullback, you'll need both time and sufficient margin. Based on current candlestick patterns, gold may attempt to test the 3128–3136 resistance zone again. Whether it moves higher will depend on the strength of the bulls.
Importantly, there are several key U.S. economic data releases during the New York session today. Based on preliminary expectations, the data appears to favor the bears, which could put additional pressure on gold prices.
📉 Today’s Trading Strategy:
Sell within the 3133–3152 zone
Buy within the 3065–3032 zone
📊 Scalping/Short-Term Trades:
Be flexible in the 3128–3088 range

XAUUSD / GOLD | 15M | BULL | SCALPING TIMEHey There My Friend
SIGNAL ALERT
🚨BUY ( GOLD & XAUUSD ) 3091,0 / 3078,0 / 3066,0 / 3053,0
🟢TP1: 3093,0
🟢TP2: 3096,0
🟢TP3: 3156,0
🔴SL: 3043,0
High Risk - Yüksek Risk
Hey Guys, Please don't forget to like 🙏🏻

Tariffs and large-scale non-agricultural affairs are comingGold experienced violent fluctuations yesterday, and technical analysis faced challenges. Luck factors were prominent in extreme market conditions. However, from the perspective of multi-period technical analysis, the gold price is still above the weekly, monthly and daily support, and the long-term bullish pattern has not changed. In the future, we need to focus on the 3054 support level, and the gains and losses of this position will directly affect the future market trend. The 3115 area resistance on the four-hour chart is significant, which is a key watershed in the short-term market. If the gold 1-hour moving average forms a dead cross, the short position will be more dominant. The current upper resistance is 3105-3111, and the lower support is 3054-3046. The operation is recommended to rebound short.
Operation strategy: It is recommended to rebound 3097-3105 short, stop loss 3115, target 3065-3046.

XAUUSD:Wait for Nonfarm Payrolls to boost upward trendOn Thursday, the price of gold plummeted by $110 initially. Subsequently, it rebounded from $3,054 to $3,135, surging by nearly $80. This was a typical market scenario of a double whammy for both bulls and bears in a washout. Whether it was those who chased long positions at high levels or those who chased short positions expecting a pullback, they all suffered losses. The level of $3,054 witnessed a perfect conversion from a top to a bottom.
Today, when it comes to the resistance levels of gold, there are two key positions to focus on. One is the morning's high point at $3,120, and the other is the high point of the pullback at $3,135. As for the support levels below, we should pay attention to $3,080 and $3,065. There will be a market movement influenced by the Nonfarm Payrolls data tonight. It is expected that before the release of the data, the price will fluctuate within a range above and below $3,100, which serves as the demarcation line. When the price surges, look for a pullback towards $3,100; when it dips, look for a rebound towards $3,100. It is recommended to mainly take long positions at low levels. Tonight, we need to pay attention to whether the Nonfarm Payrolls data will help gold prices rise again.
Here, I would like to caution all traders once again to protect their accounts. Wait until the washout of both bullish and bearish forces is over before resuming trading!
Trading Strategy:
buy@3080
TP:3110
Sell@3135
TP:3100
Get daily trading signals that ensure continuous profits! With an astonishing 90% accuracy rate, I'm the record - holder of an 800% monthly return. Click the link below the article to obtain accurate signals now!

Gold trading insights: 04-APRIL-2025Gold trading insights: Not signals, but informative zones to aid your decision-making. Please note: These zones are not trading advice. Use them as a starting point for your own analysis.

Structural analysis and operation suggestions after gold washAnalysis of gold market trend: Gold fluctuated quite a lot yesterday. It rose at the opening yesterday, rising to nearly 60 US dollars, and then fell back after being blocked at the 3167 line. However, it fell below 3100, and the lowest to the top and bottom conversion was around 3054, a drop of nearly 114 US dollars. Beyond expectations, it pulled back to 80 US dollars, and the daily line finally closed with a cross Yin line. The rapid roller coaster is too scary. The market volatility is too large, so you can only watch more and do less. If you encounter non-agricultural data, according to yesterday's trend, the market may not be so big today. After all, it has already ended yesterday. When the price fell sharply, and then there was a sharp rebound to stand firm at 3100, the market of gold yesterday was thrilling, a super roller coaster, and the difficulty of gold operation has increased a lot. However, this kind of market is rare after all. After the ups and downs of gold, it will return to normal. Although today's non-agricultural data, I personally tend to fluctuate in a large range. It is estimated that it will not break yesterday's high point or yesterday's low point. If combined with silver, gold is still oscillating and bearish. At present, it should peak in the short term, and it will choose a direction after a correction.
Gold technical analysis: Therefore, gold is not as strong as before, so it is possible for gold to rise or fall in this state. Pay attention to the previous high of 3150 on the upside, and pay attention to the gains and losses of 3055 on the downside. The 4-hour cycle has cleverly entered the oscillation range. Although the market has gone out of the big drop space, the 4-hour cycle Bollinger has not opened, and the moving average system has not diverged. The effective range for the time being is within 3085/3135. Therefore, if there is no large fluctuation on Friday, you can refer to the range of the 4-hour cycle to do high-altitude and low-multiple transactions. The 1-hour moving average of gold still shows signs of turning downward, but the rise of gold in the US market has not allowed the 1-hour moving average of gold to enter the dead cross pattern, but the gold bulls are not very strong. Of course, there is also the impact of non-agricultural data. It is expected that after the big rise and fall on Thursday, the impact of Friday's data will not be great. Before the release of non-agricultural data, we should operate in the range of 3120-3066. On the whole, the short-term operation strategy of gold today is to short on rebound and long on pullback. The short-term focus on the upper side is 3120-3125 resistance, and the short-term focus on the lower side is 3054-3066 support. Friends must keep up with the rhythm. We must control the position and stop loss, set stop loss strictly, and do not resist single operation. The specific points are mainly based on real-time intraday. Welcome to experience, exchange real-time market conditions, and follow real-time orders.
Gold operation strategy: Short order strategy: Strategy 1: Short gold rebound near 3120-3125, stop loss 6 points, target near 3100-3085, break to see 3065 line;
Long order strategy: Strategy 2: Long gold pullback near 3070-3065, stop loss 6 points, target near 3100-3090, break to see 3110 line;

NFP - Shorting GoldThe gold market experienced huge fluctuations on Thursday, which created very good profits for us. During the entire trading process, we seized the profits of fluctuations of more than $50.
The unemployment rate and NFP data during the US trading session on Friday, as well as Powell's speech on the economic outlook, are the focus of Friday's trading.
Judging from the data released in March, the unemployment rate and NFP are more likely to be bearish for gold, so when trading data, my plan is to focus on short positions.
At present, in terms of technical form, the indicators show that the bulls have not ended. In this case, the transaction needs to pay attention to the 3123/3136 resistance. If it cannot break through, the price is expected to fall again to 3103 or even 3086.
Overall, today's trading focus is to sell at high levels.
GOLD Bullish Trend Continues After FVG Test🟢 GOLD is maintaining strong bullish momentum after successfully testing a Fair Value Gap (FVG). A Break of Structure (BOS) confirms the uptrend, with higher lows forming—a clear sign of continuation.
📊 Analysis:
✅ Bullish Trend: The price structure confirms an uptrend with higher highs and higher lows.
✅ Fake Reversal Break of Structure (BOS): A key level has been broken, signaling reversal but based on current momentum that follows it shows Buyers continued strength.
✅ FVG Test Success: Price respected the Fair Value Gap, reinforcing buying pressure.
✅ 🎯 Target: , aligning with .
✅ 📈 Momentum: Strong upward drive suggests further gains ahead.
🔮 Potential Scenario:
The price is likely to continue climbing, forming a new higher high toward the target level.
📢 Confirmation Signals to Watch:
📌 Volume: Increasing volume on bullish moves.
📌 Candlestick Patterns: Bullish signals at key support levels.
📌 Moving Averages: Price holding above critical moving averages.
📌 🚨 Disclaimer: This is not financial advice. Trade responsibly and conduct your own research.
🔗 Tags:
#GOLD #XAUUSD #Bullish #TechnicalAnalysis #TradingView #FVG #BreakOfStructure #TrendAnalysis #PriceAction #MarketAnalysis

XAU/USD: 5th Wave Rally After CorrectionOn the 1-hour timeframe, XAU/USD has formed an Elliott Wave corrective structure. This is an expanded flat correction, typically seen in the 4th wave. The correction seems to have been completed at 3,054, suggesting that the 5th wave may be in progress.
For bullish traders, a potential long position can be considered around the 0.236 retracement level as a pullback entry point.
The 5th wave has the potential to reach the following upside targets: 3,110, 3,145, 3,165
However, this bullish outlook remains valid only if the low of Wave IV holds. A breakdown below this level would invalidate the bullish scenario.

Is gold going to be eclipsed?
-------------------------
Timeframe: 240 Min
-------------------------
The price action suggests a completed impulse structure originating from the 2833 low, with gold now trading at an all-time high. Based on cluster zones and Fibonacci extensions, wave (5) still has the potential to extend toward the 3150-3200 range. This zone represents a key resistance level where buying momentum may slow down, signaling an impending shift in market dynamics.
Once wave (5) completes, it will mark the end of wave ((3)) of a higher degree, setting the stage for a corrective move. A retracement toward the previous wave (4) level is expected as wave ((4)) develops, aligning with historical corrective behavior after extended rallies. This phase will provide crucial insights into the market’s next major move. Stay tuned for further updates.

Is the golden large-scale "roller coaster" near miss?Gold took a large "V"-shaped reversal pattern on Thursday, with the highest hitting 3167 in the Asian session, and continued to fluctuate and fall in the European session. It successfully fell to the lowest 3054 before the US session and then rebounded. As of now, gold has deeply bottomed out and rebounded to 3135. It has now started the oscillation mode. Gold continues to fluctuate in the range of 3100-3135, waiting for the release of the initial jobless claims data in the US session. The data is bearish, and the shorts broke through the 3080 line. After all, the technical adjustment is almost done, and everyone can find opportunities to go long. Later, gold hit the 3054 line and rebounded quickly, and the long orders also recovered the losses. This process is full of thrills and excitement. After all, such a large bottoming rebound is relatively rare. If your current gold operation is not ideal, I hope I can help you avoid detours in your investment. Welcome to communicate with us!
From the 4-hour analysis, pay attention to the short-term suppression of 3130-35 on the upper side, and pay attention to the short-term support around 3100-3106 on the lower side. Pay attention to the support of 3083-3087. After stabilizing above this position, continue to follow the low-long rhythm, and stick to the idea of going long after stepping back. I will remind you of the specific operation strategy during the trading session, so pay attention to it in time.
Gold operation strategy: Go long at 3105-3095

The golden large-scale "roller coaster" has near misses and no dFrom the 4-hour analysis, pay attention to the short-term suppression at the 3130-35 line on the top, and the short-term support at the bottom is around 3100-3106, with a focus on the support at 3083-3087. Continue to maintain the rhythm of low-long positions above this position, and stick to the idea of buying more on pullbacks. Go long with the trend to hold the long space, and try not to go against the trend.
Gold operation strategy:
Gold retreats to the 3100-3106 line for more, and retreats to the 3083-3087 line to cover more positions, stop loss 3077, target the 3130-3135 line, and continue to hold if the position is broken;
