XAUUSD Analysis todayHello traders, this is a complete multiple timeframe analysis of this pair. We see could find significant trading opportunities as per analysis upon price action confirmation we may take this trade. Smash the like button if you find value in this analysis and drop a comment if you have any questions or let me know which pair to cover in my next analysis.
Xauusdlong

Gold continues to surgeFrom the technical indicators, the daily line has deviated too far from the 100-day moving average, and a deep correction is needed to repair it. The four-hour cycle also shows a divergence signal, forming a double-top structure of the indicator. Therefore, above 3000, we must be careful of a large retracement and decline.
For gold today, the high sideways trading in the morning directly stood on 3000, reaching a high of 3015. Then the afternoon retracement can be seen as a second rise. Focus on the 3005 first-line support, and the upper pressure is 3020-3030!

Gold operation analysis suggestionsGold needs to focus on the low point of 2980-2975 formed last Friday. If the gold price can hold this area, the strong bullish pattern will continue; if the 2980-2975 area is lost, the next opportunity for gold price to rise again after falling back to the previous top-bottom conversion area of 2950-2956 can be paid attention to. However, if this area is also broken, the market is likely to face the risk of peaking. Before this area is broken, the gold market will still be dominated by a bullish trend.
From the perspective of the upper resistance level, we should first focus on whether it can break through $3005. The further resistance level is at $3015-3020, followed by $3044-3048, $3065-3070 and $3090-3100. These points are the target positions for bullish rises, and they may also cause gold prices to fall at any time due to strong resistance. It should be noted that if the gold price falls before reaching a new high, the strategy of falling back and buying on dips should be the main strategy; if the gold price does not adjust and directly starts a large-scale rise mode, we can pay attention to the short-selling opportunities near the resistance level, and if the gold price falls again in the future, the long orders originally planned to be arranged above $2950-2956 will be closed.

XAUUSD BULLISH PENNANT PATTERN IS HEREHello Guys Here Is Chart Of XAUUSD in 1-H AT
Entry Level: BUY Around 2997
Support: Lower Level of Pennant 2990 -2985
Target Will Be : 3020 ALL TIME HIGH
XAUUSD already breaks resistance level, The Pennant pattern is Actived Gold touch around new higher level.

Today's Strategy Analysis for XAUUSDThe current global landscape is highly complex, significantly impacting XAUUSD dynamics. Recently, the unpredictable tariff policies of the United States have heightened tensions in international trade, leading to a surge in economic uncertainty. Simultaneously, ongoing instability in the Middle East and the lack of progress in Russia-Ukraine peace negotiations are amplifying risk aversion in financial markets.
From a fundamental perspective, trade tensions have severely disrupted global economic growth. In response, investors are increasingly turning to safe-haven assets, driving the demand for gold to unprecedented levels.
XAUUSD
buy@2995-2985
tp:3010-3015
sell@3010-3020
tp:2995-3000
Traders, if this concept fits your style or you have insights, comment! I'm keen to hear. For those pursuing financial goals, click below for daily strategy updates.
For those who are seeking professional guidance in trading trend analysis, strategy formulation, and risk management, please click below to get the daily strategy updates.

Gold trading zones: 18-Mar-2025Today's Gold trading zones: Identify potential opportunities and plan your strategy.

XAUUSD Today's strategyYesterday, the price of gold fluctuated within our marked range, so in the short term, both bulls and bears are feasible. However, you must be careful to set the SL level and not take excessive risks.
Today's xauusd trading strategy
buy@2985-2990
SL:2980
tp:3000-3010
sell@3010-3000
SL:3015
tp:2990-2985
If you don't know how to do it, you can refer to my transaction.

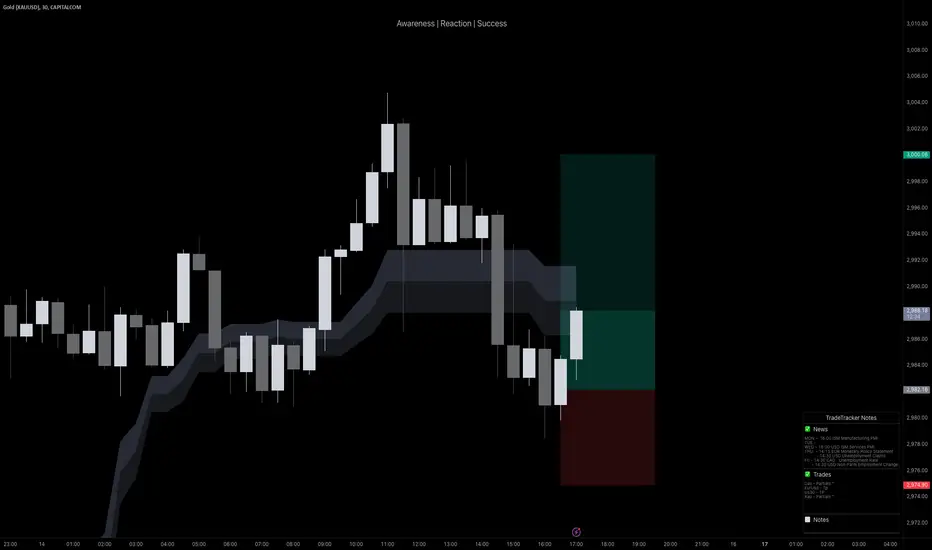
Excellent window for gold-------News---
The U.S. inflation data for February was released, and the data showed that the U.S. inflation in February fell across the board, exceeding expectations. The decline in inflation also gave the Federal Reserve more room and possibility for interest rate cuts, and also slightly reduced the concerns originally caused by tariffs. However, with the full implementation of tariffs on Europe, retaliation from Europe also followed, and concerns about the global economic downturn also intensified. The U.S. dollar index rebounded slightly and then fell again.
Gold hourly line pattern chart;
Spot gold; Previously, the gold market continued its strong upward trend, and the bulls performed extremely well. On Wednesday, gold successfully broke through the key resistance level of 2930, breaking the previous confinement and opening the upward channel. On Thursday, the rally not only continued, but also entered a large-volume stage, directly breaking through the previous high of 2956, and without any stop, the highest impact reached 2990. The daily line closed with a long positive line, showing a strong pattern of three consecutive positive attacks. On Friday night, it even reached above 3000. You can short sell near 3000 above, and continue to hold the short positions at the previously arranged points. Reduce positions at the target area of 2970, and exit all positions when it reaches 2950.
You can read bottom signals, interpret daily market trends, share real-time strategies, and no longer blindly follow the trend.

Gold's strong sideways correction continues to be bullishThe 1-hour moving average of gold crosses upwards and the support of the 1-hour moving average of gold has now moved up to around 2985. Gold fell back to the support near 2985 in the US market and continued to buy on dips. The gold bull market has not ended yet. Gold continues to try to break through the new high resistance above. As long as there is no sharp correction, there is a high probability that gold will continue to break through the new high after accumulating momentum.
Gold strategy: It is recommended to buy at 2995, stop loss at 2985, and target at 30010-3020;

Gold operation analysis suggestionsGold needs to focus on the low point of 2980-2975 formed last Friday. If the gold price can hold this area, the strong bullish pattern will continue; if the 2980-2975 area is lost, the next opportunity for gold price to rise again after falling back to the previous top-bottom conversion area of 2950-2956 can be paid attention to. However, if this area is also broken, the market is likely to face the risk of peaking. Before this area is broken, the gold market will still be dominated by a bullish trend.
From the perspective of the upper resistance level, we should first focus on whether it can break through $3005. The further resistance level is at $3015-3020, followed by $3044-3048, $3065-3070 and $3090-3100. These points are the target positions for bullish rises, and they may also cause gold prices to fall at any time due to strong resistance. It should be noted that if the gold price falls before reaching a new high, the strategy of falling back and buying on dips should be the main strategy; if the gold price does not adjust and directly starts a large-scale rise mode, we can pay attention to the short-selling opportunities near the resistance level, and if the gold price falls again in the future, the long orders originally planned to be arranged above $2950-2956 will be closed.

Gold fluctuates sideways and still has highs From the perspective of gold 1-hour level, the gold price is running sideways above 2978 and is currently in a strong bull correction.On the whole, today's short-term operation strategy for gold is to focus on long positions on pullbacks and short positions on rebounds.
Gold operation strategy reference:
Short order strategy:
Strategy 1: Short 20% of the gold position in batches when gold rebounds to around 3004-3008, stop loss 8 points, target around 2995-2990, break to see 2985.
Long order strategy:
Strategy 2: Long 20% of the gold position in batches when gold pulls back to around 2982-2985, stop loss 8 points, target around 2995-3000, break to see 3005;

XAUUSD Analysis of TodayToday, the price of gold has been fluctuating between the support and resistance levels I analyzed.
Therefore, in the short term, both long and short positions are viable. However, you must pay attention to setting the SL level and must not take excessive risks.
XAUUSD
🎁 Buy@2983 - 2985
🎁 SL 2980
🎁 TP 2993 - 2995
🎁 Sell@3000 - 2997
🎁 SL 3002
🎁 TP 2988 - 2985
Traders, if you liked this idea or if you have your own opinion about it, write in the comments. I will be glad
If you also aspire to achieve financial freedom,Follow the link below to get my daily strategy updates

Today's Gold Trading StrategyThe gold correction is not large, indicating that the gold bull trend is still relatively strong. The smaller the correction, the stronger the gold bull trend.
Operation ideas:
Gold more than 2990, stop loss 2980, target 3020-3040;

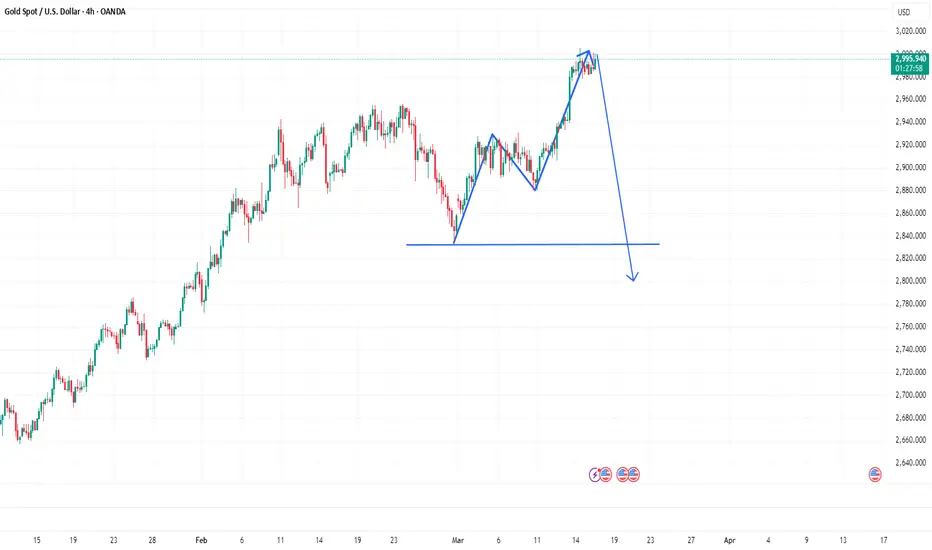
Gold is testing the barrier again! About to plungeGold hit a new record high again on Friday, reaching 3005 at one point, and also perfectly reaching 3000 points. Obviously, the bulls' goal has been basically achieved. The current K-line must fall back. Moreover, Trump imposed sanctions on the Middle East at the weekend, but the gold price did not rise. Obviously, the bulls are also weak.
From the perspective of gold trend, the situation between Russia and Ukraine has become confusing again under the background of the originally expected clear situation, so the risk aversion sentiment has heated up again. In addition, the global trade concerns caused by Trump's tariff policy have led to the intensification of the risk of global economic recession. The uncertainty of the market has also increased again. At this time, gold has become the most sought-after product in the market. From a technical point of view, gold has repeatedly rushed to the 3000 mark last week. On Friday, it pulled out a Yin cross star at a historical high. There is a need for adjustment in the short term. Don't watch it blindly for the time being.
There is an obvious bearish engulfing at the top of the gold four-hour line, that is, the big Yin line entity directly covers the Yang line entity, forming a top signal. At the same time, the K-line is also seriously deviated from the moving average. It is an abnormal trend again. The decline is inevitable, and returning to the moving average is also a certain short selling.
You can read bottom signals, interpret daily market trends, share real-time strategies, and no longer blindly follow the trend.
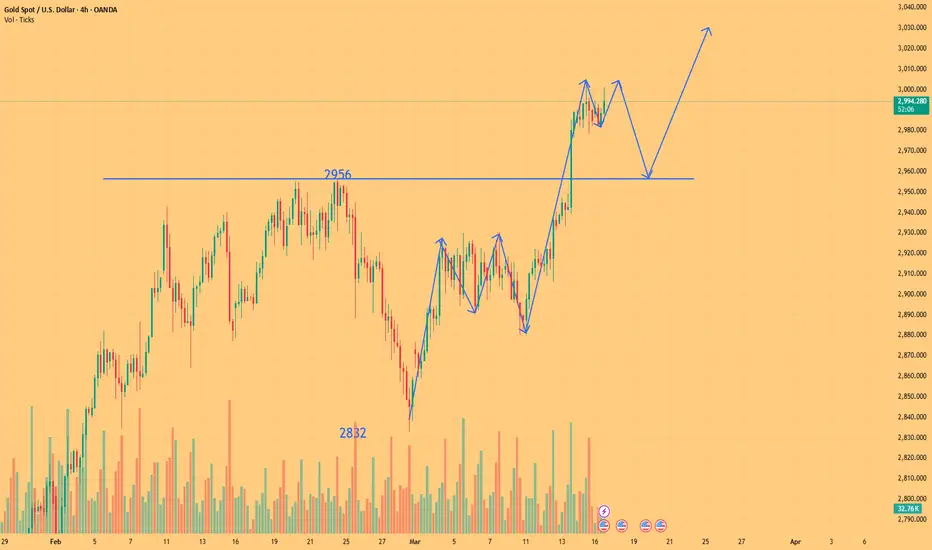
Currently in a correction, the rise will continueThe flag trend will end at the end of the triangle. With this 4h view market trend, gold is likely to continue to rise.
Trading strategy, buy2994-2990 SL2985 TP3010-3020

The 3000 mark falls back, continue short-term operationsAfter gold tested the 3000 mark again, it fell back and is currently hovering around 2990. It failed to test 3000 again in the short term. This position is obviously suppressed in the short term. The second upward test quickly fell back. The gold price may fall further. The idea is to follow the trend and short-sell. Pay attention to the short position near 2990, and the target area is 2980-2970. If it falls below 2980, you can directly look at the position of 2955-2940.
You can read bottom signals, interpret daily market trends, share real-time strategies, and no longer blindly follow the trend.

XAUUSD:Wait for retracement, continue longAs we mentioned during the early trading session today, the correction range of gold was not significant. This indicates that the bullish trend of gold remains relatively strong. The smaller the correction, the stronger the bullish momentum of gold.
A trading strategy suggesting long positions was also published in the article. Currently, gold is still in a bullish trend. We should wait for a retracement and then go long again.
The latest trading strategy:
buy@2975-2980
SL:2965
TP1:2990
TP2:3000
I always firmly believe that profit is the sole criterion for measuring strength. I will share accurate trading signals every day. Follow my lead and wealth will surely come rolling in. Click on my profile for your guide.

trendline H1, gold price follows the main trend of increasing⭐️Smart investment, Strong finance
⭐️GOLDEN INFORMATION:
Gold (XAU/USD) consolidates near its record high from the Asian session on Friday, trading within a narrow range. Investor concerns over President Donald Trump's aggressive trade policies and their potential global economic impact sustain demand for the safe-haven metal. Additionally, growing expectations of further monetary easing by the Federal Reserve (Fed) provide additional support to the non-yielding bullion.
⭐️Personal comments NOVA:
Sideway and accumulation continue the uptrend back to the $3000 price zone
⭐️SET UP GOLD PRICE:
🔥SELL GOLD zone: $3021 - $3023 SL $3028
TP1: $3010
TP2: $3000
TP3: $2990
🔥BUY GOLD zone: $2940 - $2942 SL $2935
TP1: $2950
TP2: $2960
TP3: $2970
⭐️Technical analysis:
Based on technical indicators EMA 34, EMA89 and support resistance areas to set up a reasonable BUY order.
⭐️NOTE:
Note: Nova wishes traders to manage their capital well
- take the number of lots that match your capital
- Takeprofit equal to 4-6% of capital account
- Stoplose equal to 2-3% of capital account

Gold operation analysis suggestionsGold needs to focus on the low point of 2980-2975 formed last Friday. If the gold price can hold this area, the strong bullish pattern will continue; if the 2980-2975 area is lost, the next opportunity for gold price to rise again after falling back to the previous top-bottom conversion area of 2950-2956 can be paid attention to. However, if this area is also broken, the market is likely to face the risk of peaking. Before this area is broken, the gold market will still be dominated by a bullish trend.
From the perspective of the upper resistance level, we should first focus on whether it can break through $3005. The further resistance level is at $3015-3020, followed by $3044-3048, $3065-3070 and $3090-3100. These points are the target positions for bullish rises, and they may also cause gold prices to fall at any time due to strong resistance. It should be noted that if the gold price falls before reaching a new high, the strategy of falling back and buying on dips should be the main strategy; if the gold price does not adjust and directly starts a large-scale rise mode, we can pay attention to the short-selling opportunities near the resistance level, and if the gold price falls again in the future, the long orders originally planned to be arranged above $2950-2956 will be closed.
XAUUSD Today's Strategy AnalysisLast Friday, after consolidating around the 2980 level, bullish momentum finally broke higher, driving prices to accelerate during European trading hours. Gold pierced the psychological 3000 resistance level but was rejected and pulled back into a choppy consolidation phase. The session closed near 2985 with a doji candlestick, maintaining the strong bullish trend with unidirectional momentum.
From a 4-hour technical perspective, today's downside support levels are focused on the vicinity of 2975-80. Particular attention should be paid to the critical bull-bear dividing line support at 2960-2963. Intraday pullbacks should maintain a bullish bias initially while holding above the 2975-80 support zone. Upside targets remain focused on breaking above recent highs.
Gold trading strategy:
sell @:3000-3005
buy @:2975-2980 , 2960-2963
If you are currently not satisfied with your gold trading performance, and if you also need to obtain accurate trading signals every day, you can check the information in my profile. I hope it can be of some help to you.

Gold’s Big Moment: $3,000 in Play – Can Bulls Hold It?Gold has finally reached the psychological $3,000 level, triggering the first round of sell-offs as traders take profit. The question now is whether this move can sustain itself or if we are set for a deeper pullback. Given the rapid move up, I remain cautious, ready to cut the trade quickly if I see signs of weakness in the continuation.
Fundamentals:
• Market Sentiment: Bullish drivers remain strong as gold benefits from rising inflation expectations and the Fed’s rate pause, which has fueled demand for safe-haven assets.
• Geopolitical & Economic Factors:
• President Trump’s aggressive tariff agenda is fanning concerns about global trade, increasing risk aversion and driving flows into bullion-backed assets.
• Chinese jewelry stocks are soaring, signaling growing demand for gold in the region.
• The CME FedWatch Tool indicates a 97% probability that the Fed will hold rates steady at its next meeting, reinforcing gold’s appeal.
• Technical Considerations:
• Gold hit a fresh all-time high of $2,993, putting the psychological $3,000 mark in focus.
• Above $3,000, there is little historical price action to guide resistance levels, making price discovery uncertain.
• On the downside, $2,970 acts as a key pivot, with $2,951 and $2,914 serving as strong support zones if a deeper retracement occurs.
Risk Management:
• The first sell-off at $3,000 indicates short-term profit-taking.
• I am monitoring price action closely and will exit quickly if the move proves unsustainable.
Let’s see if gold can hold above $3,000 or if we are in for a correction!
Note: Please remember to adjust this trade idea according to your individual trading conditions, including position size, broker-specific price variations, and any relevant external factors. Every trader’s situation is unique, so it’s crucial to tailor your approach to your own risk tolerance and market environment.
The current price is around 3000 and short position is opened!Short-term strategy: Continue to short around 3000, stop loss at 3006, target at 2991-2980-2970

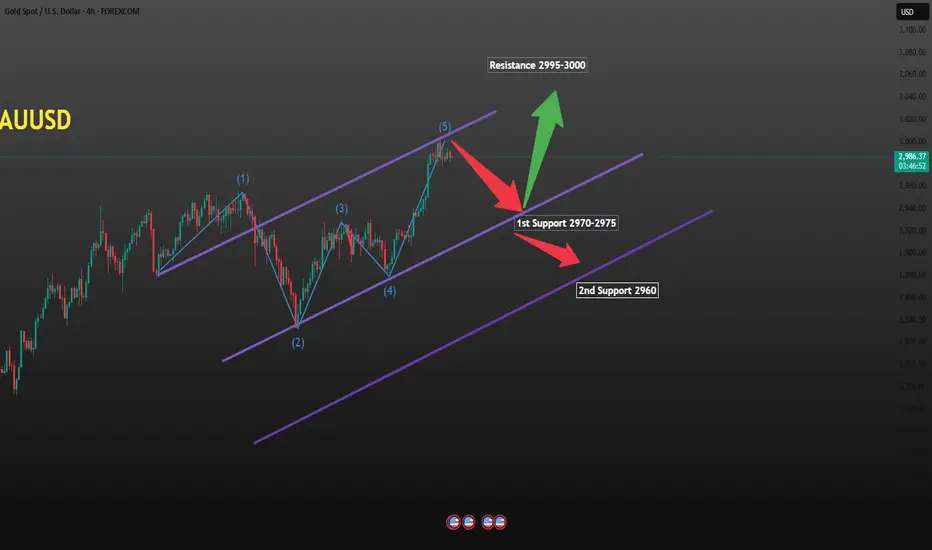
XAUUSD Analysis on MondayAfter the XAUUSD index broke through the 3000-point mark last week, today's situation is just as I wrote over the weekend. It directly and strongly rushed up to the resistance level of 2995, and then fell back.
If you read my analysis last weekend and chose to believe it, congratulations, you've already made a big profit.
Currently, XAUUSD is fluctuating around 2985 and has not reached the support level of 2970-2960. During this period, you can consider selling short when the price is high and buying when the price is low.
XAUUSD
🎁 Buy@2980-2982
🎁 SL 2975
🎁 TP 2995-3000
Traders, if you liked this idea or if you have your own opinion about it, write in the comments. I will be glad
If you also aspire to achieve financial freedom,Follow the link below to get my daily strategy updates