Gold's trend has too many friendsThere’s a well-known saying in trading: “The trend is your friend.”
I firmly believe in this principle. However, when price movements become too extreme—too fast and too far—it’s wise to exercise caution, even if you’re not ready to take the opposite side of the trade.
And right now, I believe that’s exactly the case with Gold.
________________________________________
Why a Major Gold Correction is Likely
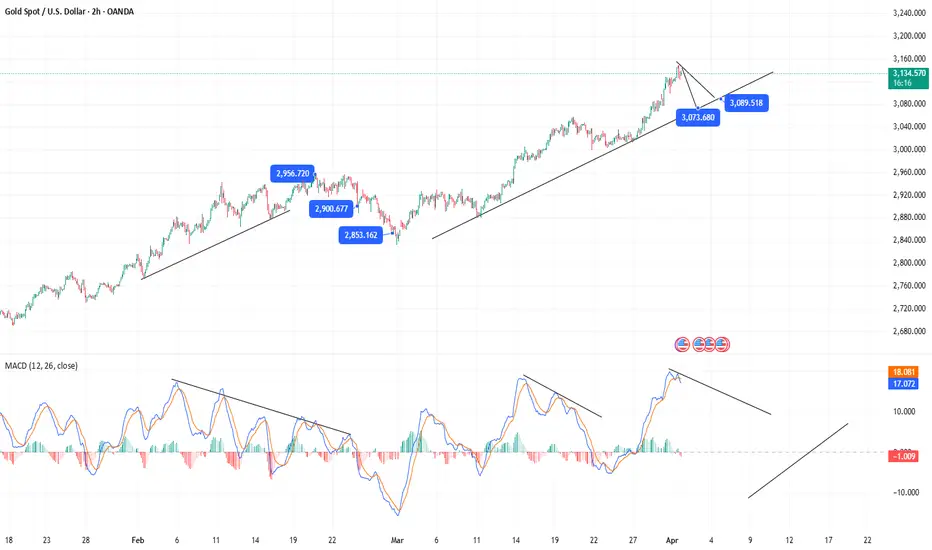
As I’ve been repeating like a broken record since Monday, Gold’s price is severely deviated from the mean, signaling that a brutal correction is on the horizon.
After reaching a new all-time high of 3,150, Gold retraced yesterday, dropping to 3,100—a support level formed earlier in the week. A rebound followed, but as I’ve explained in an educational article, this price action looks more like a stepwise distribution rather than true buying strength.
The key point?
➡️ Support isn’t holding because buyers are stepping in—it’s holding because big sellers have paused selling.
________________________________________
Still Bullish, But a Drop is Coming
There’s no doubt that Gold is in a strong uptrend. But even if it drops 1,000 pips, the overall bullish trend would still be intact.
Key Technical Signs of Weakness
📉 Trendline Break – Yesterday, Gold broke below the rising trendline, marking the first sign of weakness.
📉 Failed Rebound – Despite a short-term bounce, the price is now more likely confirming the break rather than invalidating it.
📉 Lower High in Progress? – The next minor support sits at 3,120. If Gold breaks below this level, we’ll have confirmation of a lower high, which strengthens the bearish case.
________________________________________
Targeting the Correction
If Gold breaks below 3,120, I expect a move below 3,100, targeting:
🎯 Soft target: 3,080
🎯 Likely target: 3,030 – 3,040
I believe it’s only a matter of time before this brutal correction plays out.
Let’s see how it unfolds! 🚀
Disclosure: I am part of Trade Nation's Influencer program and receive a monthly fee for using their TradingView charts in my analyses and educational articles.
Xauusdsetup

GOLD: May fall below 3100So far, gold has continued to fluctuate in the 3110-3136 range. Although the candle chart has many long lower shadows, the high point is moving down. If this trend is not broken, the probability of falling below 3100 today is very high, so when trading, everyone must be cautious. Personally, I suggest selling as the main method.

4/1 Gold Analysis & Trading SignalsThe combination of fundamental influences and technical patterns led to a sharp surge in gold prices after the market opened yesterday. The upward momentum only slowed during the New York session, but prices remained above 3100. However, after this rally, the technical setup is not particularly favorable for bulls. That said, if fundamental factors continue to support the market, any technical pullback could provide another buying opportunity for bulls.
Key Considerations:
🔸 Besides technical factors, we need to monitor geopolitical tensions—if the situation eases, demand for gold as a safe haven could decrease.
🔸 If tensions escalate further, gold is likely to rise, making it unwise to blindly short the top. Instead, we should adjust our trading strategy based on market developments while using technical patterns for entry and exit points.
🔸 If a pullback occurs, support is seen around 3109.
🔸 If the price continues upward, given current market conditions, a single rally is unlikely to exceed $30, so the first resistance zone is estimated at 3136-3145.
Trading Strategy for Today:
📈 Buy in the 3111-3101 range
📉 Sell in the 3135-3145 range
Stay flexible, follow the market closely, and adjust strategies accordingly. Let me know if you need further insights!

XAUUSD/GOLD RESISTANCE R1 & NEW ATH PROJECTION 01.04.25The green area represents the profit target (TP1).
The red area below indicates the stop-loss level.
The black zig-zag line suggests an expected price movement.

GOLD: Potential RisksIf the price reaches the 3136-3148 range, there is no need to hesitate, just sell. This is the gold trading strategy for today provided to you before yesterday's closing. I wonder if any friends have grasped this profit?
After getting support near 3125, the price rebounded again. It is still in the rising stage. The resistance continues to focus on the vicinity of 3148.
Here is a reminder for everyone: During the trading process, the technical pattern of the 2H and above cycle level has a turning point. This is not a joke, so everyone must be cautious when chasing highs.
Even if there is news supporting the market now, news is something we cannot control. Once there is news of easing the situation, the risk aversion of gold will subside, and the decline will definitely not be small.
So while we follow the trend, we must also learn to think against the trend!
#XAUUSD: Smaller Time Frame With More Accurate Entry Areas! We currently have several active ideas in the Gold analysis section. However, we would like to share a comprehensive chart analysis that clearly demonstrates a market trend and potential entry points. The analysis identifies two entry types: “safe” and “risky.” A “safe” entry is only valid if the “risky” entry is invalidated. You may choose to take either entry if it aligns with your trading bias and chart analysis.
If you find this analysis valuable, please consider liking and commenting on it, as this feedback will help us post more detailed analyses in the future.
As always, we express our sincere gratitude for your unwavering support.
Team Setupsfx_

3/31 Gold Trading StrategiesThe five-wave upward movement in gold has been completed. Next, we expect a period of consolidation around 3130, forming a short-term top before a potential pullback. However, during this consolidation phase, there is a possibility of a price surge, though the probability is low.
Trading Suggestions:
For conservative traders: Avoid rushing into positions. It’s better to wait for a pullback and the confirmation of a secondary top before entering trades.
For aggressive traders: You may enter at the current price, but be cautious with your position sizing and leave room for potential additions.
Based on the magnitude of the previous upward movement, the expected retracement zone is around 3110-3096, where a minor support level may form.
Trading Strategy:
📉 Sell in the 3121-3131 range
📈 Buy in the 3105-3090 range
Trade carefully

XAUUSD Analysis with Market Timing Projection line till April 03XAUUSD (Gold Spot/USD) has reached its 360-degree target of 3128. A breakout above this level could push it toward the next target of 3241. Our Market Timing projection indicates a bullish trend continuing until April 3, 2025.

GOLD:Short positions are dominant in New York sessionToday, gold jumped higher and opened higher. After filling the gap, it continued to rise, breaking through the 3100 mark and approaching 3130. The excessive and rapid rise caused the MACD indicator to diverge, giving us the opportunity to short this time, from which we gained 1000+ points of profit. Together with the profit of nearly 2000 points in the Asian session, we have gained more than 3000 points of profit today.
At present, the price is still falling, with weak support roughly around 3107 and strong support around 3098. Before the start of the US session, the price is expected to fluctuate in the 3100-3130 area. There will be large fluctuations after the opening, and the possibility of falling from a high position is greater, so the US session can pay more attention to the opportunity to short at a high position.

GOLD Price Analysis: Key Insights for Next Week Trading DecisionGold surged to a record high of $3,086 last week as investors dumped Equities and Crypto for safe-haven assets. With rising inflation concerns and uncertainty surrounding Trump’s tariffs, fears of a US recession or stagflation are driving the market.
📈 Will Gold continue its rally, or is a pullback coming? In this video, I break down my thought process and how I’m strategically positioning for the next big move.
#GoldPrice #XAUUSD #MarketAnalysis #GoldTrading #Forex #Inflation #SafeHaven #TradingStrategy
Disclaimer:
Forex and other market trading involve high risk and may not be for everyone. This content is educational only—not financial advice. Always assess your situation and consult a professional before investing. Past performance doesn’t guarantee future results.

GOLD: SELL@3096-3102 TP3083-3078Gold opened higher today, and the price once approached 3100. It will fall back in a short time. It is recommended to sell in the range of 3096-3102, tp3083-3078, sl3107

3/31 Gold Trading StrategiesThis seems to be a 5-wave upward trend, and GOLD is currently in the final phase of the upward movement. Given the strength of the bullish momentum, a rise towards the 3100 level is highly probable. Therefore, in tomorrow's trading, it would be reasonable to continue buying with a take-profit target in the 3095-3105 zone. Once the take-profit area is reached, consider switching to a short position.

#XAUUSD:$3200 Next Big Move, Bulls Are Like to DominatePrice has been bullish since many months as US Dollars continue to decline, the fear of further decline in dollar value is triggering the gold market to go all time high. There is a big possibility that price is likely to go upwards of region of 3200$. We will have to monitor the market next week since we have big news week coming up.
Like and Comment to Show us the support 🚀❤️
Team Setupsfx_

Gold (XAU/USD) Breakout & Retest: Next Stop $3,080?🔍 Key Observations:
🔹 Ascending Triangle Breakout:
📈 Price was consolidating in an ascending triangle (🔺) and has broken out above resistance.
🚀 Bullish momentum is in play.
🔹 All-Time High (ATH) Resistance Zone:
🛑 Resistance Area (🔵) is where price has struggled before.
🔵🔵 Rejection signs at this level indicate a possible pullback.
🔹 Fair Value Gap (FVG) Retest:
🔽 Price may pull back into the Fair Value Gap (FVG) (📦) before moving higher.
🎯 This zone ($3,030 - $3,040) could act as a buying area.
🔹 Target Point at $3,080:
🎯 Main target for bulls is $3,080 (📈).
🔝 Price could retest the ATH zone before a push
🔹 Dynamic Support (DEMA 9):
📊 DEMA 9 (📉) at $3,052.80 is acting as support.
🔮 Expected Price Action:
⚫ Scenario 1 (Bullish) 🚀
➡️ Pullback into FVG zone (📦) → Buyers step in → Move toward $3,080 🎯
⚫ Scenario 2 (Bearish) 📉
❌ If price breaks below FVG → Further downside risk
✅ Conclusion:
🟢 Bullish bias remains strong unless price falls below FVG.
📌 Traders may look for entries in the FVG zone for a move to $3,080 🎯.
🔥🚀 Gold could be setting up for another push!

XAUUSD – Refined Daily Plan w/ Sniper Entries🔹 HTF Bias (D1 + H4)
🔼 Overall trend: Bullish
Price is inside a Premium HTF zone (3065–3090)
Daily and H4 structure are bullish, but price is testing a major liquidity zone
Reaction expected either:
✅ Bullish continuation on breakout
🔁 Short-term rejection for retracement ➤ sniper setups engage
🧠 Current Setup Situation (M15–H4 Context)
📍 Price is consolidating below 3065, forming equal highs ➤ liquidity sitting above
M15 + M30 show clear FVG + OB confluence zones
H4 has no CHoCH yet — structure intact
Strategy: reactive entries based on smart money reaction
🔻 SNIPER SELL SETUP (Scalp to Retrace)
🎯 Sell Plan:
Entry Zone: 3064.5 – 3066
SL: Above 3070 (above wick + LQ)
TP1: 3041 → M30 FVG
TP2: 3020 → H1 bullish OB
TP3: 3008 → large imbalance (LTF)
⚠️ Entry Conditions:
Price must:
Sweep liquidity above equal highs
Show M15 or M5 bearish BOS / engulfing
Ideally with shift in order flow (CHoCH)
✅ Confluences:
D1 & H4 Premium zone
M15 OB + FVG
Liquidity resting above 3065
🔺 SNIPER BUY SETUP (Continuation)
🎯 Buy Plan:
Entry Zone: 3016–3020
SL: Below 3010
TP1: 3035
TP2: 3055
TP3: 3065 (liquidity revisit)
⚠️ Entry Conditions:
Clean rejection from OB zone
Bullish candle (M15/M30) or LTF BOS
No full break below 3008 – that invalidates buy
✅ Confluences:
Clean OB + FVG (M30 / H1)
Sits in discount zone after potential rejection
H4 demand & D1 continuation zone
🧭 Decision Tree
→ If price breaks 3065 + holds → wait for retest → long continuation
→ If price sweeps 3065 + shows rejection → sniper sell
→ If price drops to 3020 → look for long
→ If price breaks 3008 → wait for structure to reset
🧼 Summary:
HTF = Bullish
Active zone = 3065 (reaction zone)
Trade reaction, not prediction
Let price come to your zone. Then strike like a sniper 🧠⚔️
Sniper setups only execute after LTF confirmation
🧠 Structure > Emotion
🎯 Setup > Impulse
💬 If this breakdown helped you, support the post:
🔁 Boost / Like to help more traders see it
✅ Follow for clean daily plans, sniper setups & SMC flow
Let’s grow together, one smart trade at a time 📈

XAUUSD – H4 Trading Plan📍 Structure
✅ Market structure: Bullish
🔼 Recent BOS confirms continuation
📈 Price is pushing into resistance zone @ 3065
⚠️ No CHoCH yet = no shift, but signs of potential slowing momentum
🧩 Zones of Interest
🔵 3065–3090 → Supply / Premium zone
– Major liquidity draw
– Inside weekly imbalance → potential reversal zone
🔵 2955 → Prior range high + FVG
– Ideal first mitigation target
🔵 2790–2800 → OB zone + consolidation base
– Swing target if breakdown continues
🎯 Trade Scenarios
🔼 Bullish Breakout
Break & retest of 3065 (clean H4 close above)
LTF entry (M15–H1) on pullback
🎯 Target: ATH sweep (3100+)
🛡️ SL: Below HL or valid OB
🔽 Bearish Rejection
Strong reaction from 3065–3090 zone
Wait for H4 CHoCH → then Lower High
🎯 TP1: 2955
🎯 TP2: 2800
🛡️ SL: Above rejection wick
📌 Notes
✋ No short without H4 CHoCH confirmation
🧠 Structure is king – reaction first, entry second
Premium zone = decision zone → be reactive, not predictive

Gold (XAU/USD) Breakout & Retest: Next Stop $3,080?🔍 Key Observations:
🔹 Ascending Triangle Breakout:
📈 Price was consolidating in an ascending triangle (🔺) and has broken out above resistance.
🚀 Bullish momentum is in play.
🔹 All-Time High (ATH) Resistance Zone:
🛑 Resistance Area (🔵) is where price has struggled before.
🔵🔵 Rejection signs at this level indicate a possible pullback.
🔹 Fair Value Gap (FVG) Retest:
🔽 Price may pull back into the Fair Value Gap (FVG) (📦) before moving higher.
🎯 This zone ($3,030 - $3,040) could act as a buying area.
🔹 Target Point at $3,080:
🎯 Main target for bulls is $3,080 (📈).
🔝 Price could retest the ATH zone before a push
🔹 Dynamic Support (DEMA 9):
📊 DEMA 9 (📉) at $3,052.80 is acting as support.
🔮 Expected Price Action:
⚫ Scenario 1 (Bullish) 🚀
➡️ Pullback into FVG zone (📦) → Buyers step in → Move toward $3,080 🎯
⚫ Scenario 2 (Bearish) 📉
❌ If price breaks below FVG → Further downside risk
✅ Conclusion:
🟢 Bullish bias remains strong unless price falls below FVG.
📌 Traders may look for entries in the FVG zone for a move to $3,080 🎯.
🔥🚀 Gold could be setting up for another push!

Risk aversion pushes gold higher againFrom the perspective of gold trend, after three trading days of shocks and consolidation, this trading day also chose to break upward. After breaking through the pressure near 3030/32, it inertially rushed up to 3056, which is only one step away from the historical high.
Gold broke out of the upward trend mainly driven by risk aversion. Russia, Ukraine and Gaza opened fire again. The originally planned peace talks did not achieve substantial results, so the current market risk aversion pushed gold upward again. Gold strengthened again after breaking through the convergence triangle.
Gold can be shorted in the short term, sl: 3063 tp: 3042

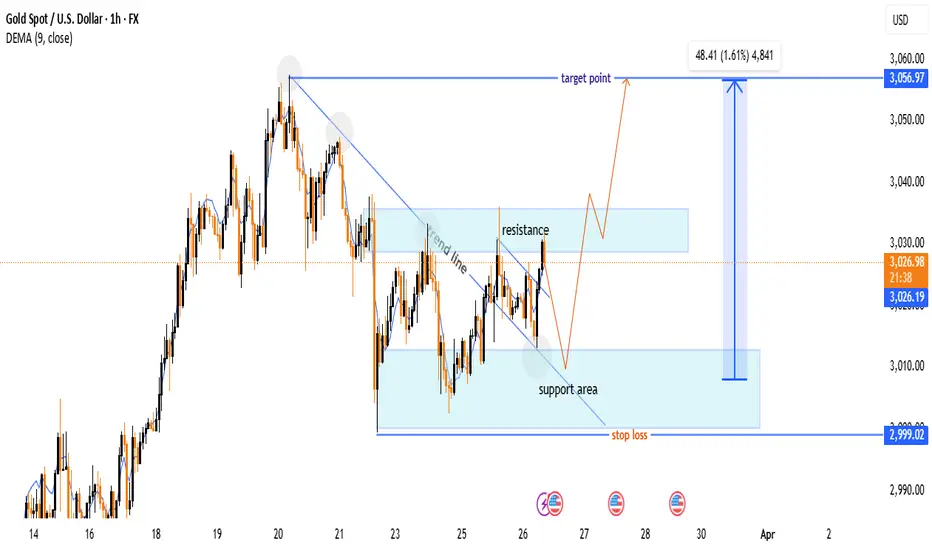
Gold (XAU/USD) Bullish Breakout – Trade Setup & Key Levels🔍 Key Observations:
🔹 Trend Line Breakout:
📉⬇️ A downward trend line was broken, signaling a potential bullish reversal.
📈✅ The price has moved above the trend line, confirming the breakout.
🔹 Support & Resistance Zones:
🟦 Support Area: $3,000 - $3,010 (Buy Zone)
🟥 Resistance Area: $3,030 - $3,040 (Sell Pressure)
📊 Trade Setup:
✅ Buy Plan:
🔄 Wait for a pullback to the support zone (🟦 light blue area) before entering.
🎯 Target: $3,056.97 📈🏁
🛑 Stop Loss: $2,999.02 ❌🚨
📈 Indicators & Confirmation:
📊 DEMA (9-period) = $3,026.48 (near the current price, suggesting a neutral-to-bullish trend).
🔥 Conclusion:
🔵 Bullish Setup Active 🚀
⚠️ Wait for price reaction at support before entering.
❌ If price drops below $2,999, the setup is invalidated.
📌 Final Tip: Watch for a bullish candlestick pattern 📊 at support before executing the trade! 🎯
XAU/USD 27 March 2025 Intraday AnalysisH4 Analysis:
-> Swing: Bullish.
-> Internal: Bullish.
Bias and analysis remains the same as analysis dated 23 March 2025.
Price has printed a bearish CHoCH following printing further all time highs.
Price is now trading within an established internal range. I will however continue to monitor price.
Intraday Expectation:
Price to trade down to either discount of internal 50% EQ, or nested Daily and H4 demand levels before targeting weak internal high priced at 3,057.590.
Note:
With the Federal Reserve's dovish stance and persisting geopolitical uncertainties, heightened volatility in Gold is expected to continue. Traders should proceed with caution and adjust risk management strategies in this high-volatility environment.
Price could also be driven by President Trump's policies, geopolitical moves and economic decisions which are sparking uncertainty.
H4 Chart:
M15 Analysis:
-> Swing: Bullish.
-> Internal: Bearish.
Analysis and bias remains the same as analysis dated 24 March 2025.
As per analysis dated 19 March 2025 whereby I mentioned as an alternative scenario that internal range has significantly narrowed. All HTF's require a pullback, therefore, it would be completely viable if price printed a bearish iBOS.
This is how price printed, by printing a bearish iBOS.
Price has yet to print a bullish CHoCH to indicate bullish pullback phase initiation, however, price has traded into premium of 50% internal EQ, therefore, I am happy to confirm internal range.
Intraday Expectation:
Price has traded in to premium of 50% EQ and has mitigated M15 supply zone.
Technically, price to target weak internal low priced at 2,999.465.
Note:
With the Federal Reserve maintaining a dovish stance and ongoing geopolitical tensions, volatility in Gold prices is expected to remain elevated. Traders should exercise caution, adjust risk management strategies, and stay prepared for potential price whipsaws in this high-volatility environment.
M15 Chart:

GOLD: Bullish pattern, Short first then LongIn the 4H chart, the bulls have not completely unloaded their strength. From the perspective of the pattern, it should be possible to reach the area around 3050-3058.
In the 30M chart, it is currently near resistance, focusing on the resistance of the 3037-3044 range. You can consider shorting around 3043, and the target is temporarily set around 3033.
Today there is initial jobless claims data, and I personally expect it to be bullish for gold, so I plan to hold long positions when the data is released.

GOLD Bullish Breakout!
HI,Traders !
GOLD was trading
Beneath the falling
Resistance line but now
We are seeing a bullish
Breakout, pullback and a
Rebound so we are locally
Bullish biased now and we
Will be expecting a further
Local bullish move up !
Comment and subscribe to help us grow !

