Gold's Next Big Move? Don't Miss This Trade!Hi traders!, Analyzing XAU/USD on the 1H timeframe, spotting a potential long entry:
🔹 Entry: 3,027.23
🔹 TP: 3,064.31
🔹 SL: 2,990.15
Gold is testing a key support level near 3,027, coinciding with the 200 EMA. If buyers step in, we could see a bounce toward 3,064. RSI is approaching oversold levels, suggesting a possible reversal.
⚠️ DISCLAIMER: This is not financial advice. Every trader makes their own decision.
Xauusdsignal

Gold’s Rally Pauses – Correction Incoming!!!Gold ( OANDA:XAUUSD ) started to correct at the Potential Reversal Zone(PRZ) and near the upper line of the Ascending Channel . The question is, will we have a minor correction or a major correction(main)?
Gold is moving near Resistance lines and Fibonacci levels and was able to breaks the Uptrend lines . I view the upward movement of the last few hours as an upward correction , which will likely cause gold to fall again.
In terms of Elliott waves , it looks like Gold has completed a major wave 5 and I expect Gold to start a major corrective wave . In Gold's history , major impulse waves have completed precisely near the upper lines of ascending channels .
I expect Gold to decline at least to the Support zone($3,100-$3,085) , if gold can break the lower line of the ascending channel, we can be more confident that we are in the main corrective waves .
Do you think Gold can create a new All-Time High(ATH) again?
Note: If Gold goes above $3,130, we can expect more pumps and a new All-Time High(ATH).
Gold Analyze ( XAUUSD ), 1-hour time frame.
Be sure to follow the updated ideas.
Do not forget to put a Stop loss for your positions (For every position you want to open).
Please follow your strategy; this is just my idea, and I will gladly see your ideas in this post.
Please do not forget the ✅' like '✅ button 🙏😊 & Share it with your friends; thanks, and Trade safe.

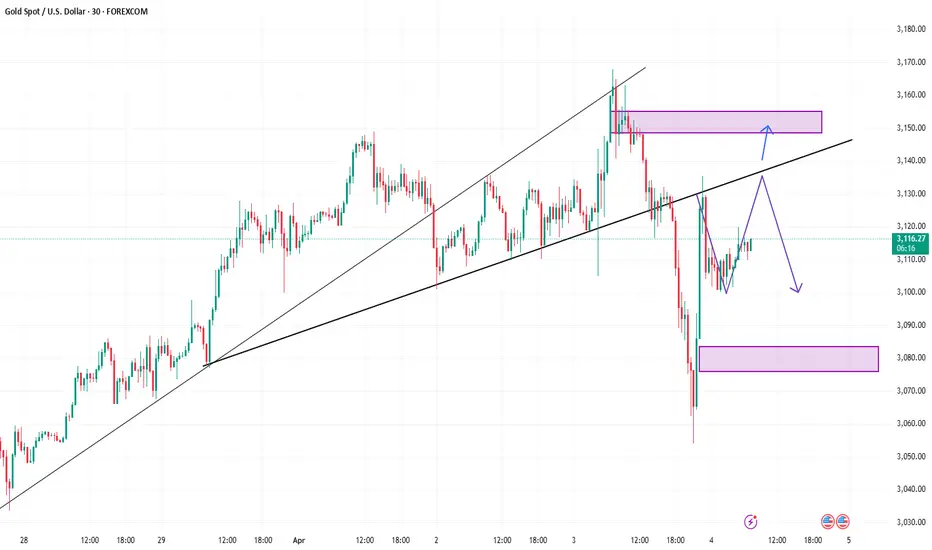
#XAUSUD: Small Time Bearish Correction With Three Take Profit! After reaching a record high of $3,150, the XAUUSD currency pair has experienced a decline. Analysis conducted over the past few hours has led us to anticipate that the price may experience minor corrections within a short time frame.
Upon analysing the data and price movements, we have identified three distinct zones or targets that could serve as potential price levels for the XAUUSD pair.
For further insights into chart analysis, please consider liking and commenting on our content. We appreciate your continuous support.
Sincerely,
Team Setupsfx_

#XAUUSD: Last Sell Idea Dropped +300 Pips, Bias Changed? XAUs price behaviour has deviated from previous analysis, which had anticipated a +300 pips increase. However, we now anticipate the price to continue its upward trend, potentially reaching another record high. Our next target price range is estimated to be between 3170$ and 3200$.
We extend our best wishes for your successful trading endeavours. To enhance your trading outcomes, we strongly recommend employing accurate risk management techniques.
Team Setupsfx_
🚀❤️

4/4 Gold Trading StrategiesAfter yesterday’s sharp drop, gold quickly rebounded, and by the end of the session, prices had returned close to the opening level. I’m not sure if anyone is currently stuck in unfavorable positions. Under normal circumstances, if your account has sufficient margin and risk tolerance, such volatility shouldn’t cause major damage. However, for those with weak positions or who bought at the top or sold at the bottom, losses may have occurred—especially common among newer traders who are often influenced by emotions.
If you are currently holding short positions and hoping to wait for a price pullback, you'll need both time and sufficient margin. Based on current candlestick patterns, gold may attempt to test the 3128–3136 resistance zone again. Whether it moves higher will depend on the strength of the bulls.
Importantly, there are several key U.S. economic data releases during the New York session today. Based on preliminary expectations, the data appears to favor the bears, which could put additional pressure on gold prices.
📉 Today’s Trading Strategy:
Sell within the 3133–3152 zone
Buy within the 3065–3032 zone
📊 Scalping/Short-Term Trades:
Be flexible in the 3128–3088 range

Gold Price Analysis:Key Supply & Demand Zones with Potential Bkl🔥 Key Levels & Zones
🔵 Supply Zone (3,135-3,140 USD) 📉
Acts as resistance where selling pressure increases.
If price reaches here, expect a potential pullback.
🟢 Demand Zone (3,085-3,095 USD) 📈
Strong support area with buying interest.
Price has tested this zone multiple times = accumulation.
🎯 Target Point (~3,167 USD) 🚀
If price breaks out, it may rally towards this level!
❌ Stop Loss (~3,080 USD) ⛔
Marked below demand zone to limit risk.
---
📊 Trend Analysis
🔹 Trend Line Break ⚡
The price broke the previous uptrend = potential reversal or deeper correction.
🔹 Market Structure 🏗️
Price consolidating inside the demand zone = possible bullish move ahead.
🔹 Double Bottom Formation (DBF) at Supply Zone 🔄
Shows failed breakout attempts = strong resistance.
---
🔍 Indicators & Insights
📌 DEMA (9 close) at 3,099 USD 📈
Price hovering around this moving average = market indecision.
---
🚦 Possible Scenarios
✅ Bullish Scenario:
If price holds the demand zone & breaks above 3,110 USD, it could rally to supply zone (~3,135 USD).
A breakout above 3,140 USD could lead to the target zone (~3,167 USD) 🚀.
❌ Bearish Scenario:
If price breaks below 3,085 USD, it may hit stop loss (3,080 USD) and continue lower.
---
🎯 Trading Plan
🟩 Long Entry ➡️ Around 3,090-3,100 USD 📊
🛑 Stop Loss ➡️ Below 3,080 USD 🚨
🎯 Target ➡️ 3,135-3,167 USD 🎉

Attention: If the price continues to rise frome HERETimeframe: 15m
It’s simple. If grow up my zone. It will go 3119.88. If down from my zone it will go 3078.37. Goodluck.

XAUUSD:Wait for Nonfarm Payrolls to boost upward trendOn Thursday, the price of gold plummeted by $110 initially. Subsequently, it rebounded from $3,054 to $3,135, surging by nearly $80. This was a typical market scenario of a double whammy for both bulls and bears in a washout. Whether it was those who chased long positions at high levels or those who chased short positions expecting a pullback, they all suffered losses. The level of $3,054 witnessed a perfect conversion from a top to a bottom.
Today, when it comes to the resistance levels of gold, there are two key positions to focus on. One is the morning's high point at $3,120, and the other is the high point of the pullback at $3,135. As for the support levels below, we should pay attention to $3,080 and $3,065. There will be a market movement influenced by the Nonfarm Payrolls data tonight. It is expected that before the release of the data, the price will fluctuate within a range above and below $3,100, which serves as the demarcation line. When the price surges, look for a pullback towards $3,100; when it dips, look for a rebound towards $3,100. It is recommended to mainly take long positions at low levels. Tonight, we need to pay attention to whether the Nonfarm Payrolls data will help gold prices rise again.
Here, I would like to caution all traders once again to protect their accounts. Wait until the washout of both bullish and bearish forces is over before resuming trading!
Trading Strategy:
buy@3080
TP:3110
Sell@3135
TP:3100
Get daily trading signals that ensure continuous profits! With an astonishing 90% accuracy rate, I'm the record - holder of an 800% monthly return. Click the link below the article to obtain accurate signals now!

NFP - Shorting GoldThe gold market experienced huge fluctuations on Thursday, which created very good profits for us. During the entire trading process, we seized the profits of fluctuations of more than $50.
The unemployment rate and NFP data during the US trading session on Friday, as well as Powell's speech on the economic outlook, are the focus of Friday's trading.
Judging from the data released in March, the unemployment rate and NFP are more likely to be bearish for gold, so when trading data, my plan is to focus on short positions.
At present, in terms of technical form, the indicators show that the bulls have not ended. In this case, the transaction needs to pay attention to the 3123/3136 resistance. If it cannot break through, the price is expected to fall again to 3103 or even 3086.
Overall, today's trading focus is to sell at high levels.
XAU/USD: 5th Wave Rally After CorrectionOn the 1-hour timeframe, XAU/USD has formed an Elliott Wave corrective structure. This is an expanded flat correction, typically seen in the 4th wave. The correction seems to have been completed at 3,054, suggesting that the 5th wave may be in progress.
For bullish traders, a potential long position can be considered around the 0.236 retracement level as a pullback entry point.
The 5th wave has the potential to reach the following upside targets: 3,110, 3,145, 3,165
However, this bullish outlook remains valid only if the low of Wave IV holds. A breakdown below this level would invalidate the bullish scenario.

4/3 Gold Trading StrategiesTariff concerns and inflation have once again triggered significant volatility in gold. After yesterday’s price surge following news announcements, today’s market opened with continued bullish momentum, reaching around 3170.
For traders who managed to keep up with the market rhythm, this was a golden opportunity—but for those caught on the wrong side, it was a disaster. The persistent price rally has put short sellers under significant pressure. While I hope most of you are in long positions, I also understand that’s not always the case. For those stuck in short trades, the key now is to minimize losses or even turn the situation into a profit.
Based on the current price structure, I expect a high-level pullback. If your short position isn't causing serious damage to your account, holding on could be a viable strategy.
The expected trading range includes a high point at 3166-3178 and a low point at 3138-3123. Additionally, several key technical levels need to be monitored for potential reversals.
Trading Recommendations:
📌 Main Trades:
Sell in the 3166-3182 range
Buy in the 3136-3121 range
📌 Short-Term Scalping:
Be flexible in the 3147-3158 range
Manage your risk carefully and adjust your trades based on market movements! 🚀

Gold new ATH at 3,168: A Final Push Before the Drop?Yesterday was a high-volatility day, and we all know why.
Gold surged to yet another all-time high at 3,168, and luckily, I had already closed my sell trade around break-even—otherwise, my stop loss would have been triggered.
________________________________________
Gold Still Set for a Hard Drop?
Despite the rally, my outlook remains unchanged—I still believe Gold is due for a significant correction.
📉 3,100 Held as Support – But buyers are struggling to hold onto gains around 3150
📉 Every New High is a Selling Opportunity – So far, Gold has failed to sustain its breakouts, reinforcing a potential distribution phase.
________________________________________
Trading Plan: Selling the Rallies
🔻 Target: At least 3,080
🔻 Preferred Strategy: Continue selling into rallies
For now, I remain bearish and will keep looking for opportunities to short the market. 🚀
Disclosure: I am part of Trade Nation's Influencer program and receive a monthly fee for using their TradingView charts in my analyses and educational articles.

Data will be Bearish for GOLDAffected by tariffs and inflation news, gold fluctuated sharply before the market closed. The market was in a situation of double kills for both long and short positions, and the sentiment was still fermenting. At present, the bulls also took this opportunity to successfully break through the resistance, and the price returned to above 3140 again. From the perspective of the pattern, there is still room for growth in the short term.
Before the US market, you can look for trading opportunities in the 3158-3123 range. The unemployment benefit data will be released during the US market, and the data is expected to be bearish for gold. Therefore, within 30 minutes before the data is released, if you hold a long order, please be cautious. At that time, I will also send you the latest trading plan based on the market situation.
If you are currently in trouble and need help, you can leave me a message.

Gold (XAU/USD) Bullish trend Demand Zone –Trend Analysis & ts🔵 Demand Zone (Support Area):
This blue zone represents a strong buying area where buyers are expected to step in.
If the price touches this zone and bounces, it confirms bullish strength.
📉 Trend Line Break:
The previous trendline has been broken ⛔, signaling a possible retest before a move up.
🛑 Stop Loss (Risk Management):
Positioned at 3,108.52 🔴, meaning if the price drops below this, the trade setup becomes invalid.
🎯 Target Point (Take Profit Level):
3,167.77 ✅ is the potential profit zone if the price moves upward from the demand area.
🟠 Expected Price Movement:
The orange dotted line 🔶 suggests a likely move:
1. Price dips into the demand zone (🔵).
2. Bounces back up 🔄.
3. Breaks minor resistance 🟦.
4. Rallies to the target zone 🎯.
Overall, bullish movement 📈 is expected if the demand zone holds! 🚀

Gold (XAU/USD) : Bullish Setup with Key Demand Zone🔹 Trend Line & Demand Zone 📈
* The trend line shows an upward trend. 🚀
* The demand zone 🟦 acts as strong support, where buyers are likely to step in.
🔹 Price Action 🔍
* Price is bouncing off the demand zone ➡️ Bullish Signal 📊🔥
* Higher lows forming, indicating potential upward momentum.
🔹 Trade Setup 🎯
✅ Entry Point: Near the demand zone 🟦
❌ Stop Loss: 🔽 3,099.26 (Below demand zone)
🎯 Target Point: ⬆️ 3,148.58 (Key resistance area)
🔹 Expected Movement 🏆
* A slight pullback 📉 before a strong push up 📈💪
* If price holds the demand zone, 🚀 potential rally ahead!
🔹 Risk-to-Reward Ratio ⚖️
* Favorable trade setup ✅ High reward, controlled risk 🎯
🔹 Final Verdict 🔥
📊 Bullish Bias ✅ As long as demand zone holds!
🚨 Warning: If price breaks below 3,099.26, expect further downside!

XAUUSD Analysis: Why I’m Not Buying Gold at the Highs!Gold’s Rally: A Strategic Plan for the Next Buy Setup!
✨ Gold (XAUUSD) has experienced a strong rally recently, fueled by the stock market sell-off. However, I’m waiting for a better entry point rather than buying at the current highs, as price is trading at a premium. 📉 My focus is on a potential retracement on the daily and 4-hour timeframes, targeting a pullback into the swing low-to-high range. Specifically, I’m watching for price to return to the equilibrium zone around the 50% Fibonacci retracement level. 🔄 If price pulls back and we see a bullish break of market structure in this area, it could present a solid buying opportunity. Until then, patience is key! 🛠️
⚠️ This is not financial advice. Always trade responsibly and conduct your own analysis.

XAUUSD 1H, 03/04/2025, 11:20AM.XAUUSD this trade is going good, almost 60% target done. Still holding this trade with breakeven.

Gold prices cool after tariff announcement⭐️GOLDEN INFORMATION:
Gold prices (XAU/USD) surged to a new all-time high during the Asian session on Thursday as investors flocked to safe-haven assets amid heightened risk aversion. Market sentiment took a sharp downturn after US President Donald Trump unveiled sweeping reciprocal tariffs on Wednesday evening, igniting fears of a global economic slowdown and a potential US recession.
The announcement triggered a broad sell-off in equity markets, reinforcing the risk-off mood and further fueling demand for gold as a traditional store of value.
⭐️Personal comments NOVA:
Gold hits 3167 peak, buying pressure gradually decreases. Adjustment waiting for new moves from other countries on Trump's tariff policy
⭐️SET UP GOLD PRICE:
🔥 SELL 3165 - 3168 SL 3172
TP1: $3160
TP2: $3150
TP3: $3140
🔥BUY GOLD zone: $3108 - $3110 SL $3103
TP1: $3115
TP2: $3130
TP3: $3140
⭐️Technical analysis:
Based on technical indicators EMA 34, EMA89 and support resistance areas to set up a reasonable SELL order.
⭐️NOTE:
Note: Nova wishes traders to manage their capital well
- take the number of lots that match your capital
- Takeprofit equal to 4-6% of capital account
- Stoplose equal to 2-3% of capital account

XAUUSD 1H, 03/04/2025, 07:00AM.I believe it's a great opportunity to capitalize on the recent upward movement in XAUUSD and to take advantage of a favorable selling setup in the near future.

Trade Idea: XAUUSD (Gold 15m Chart)Trade Idea: XAUUSD (Gold 15m Chart)
Price is holding above the short-term FVG and showing bullish intent after reacting from a higher timeframe zone. A continuation move is likely if this zone holds, targeting the next premium zone above.
Bias: Bullish
Context: Market structure is bullish; price is building a base for a potential expansion toward the upper inefficiency. A clean liquidity run is expected toward the premium zone.
Wait for confirmation before entry. Trade with proper risk management.

Gold's trend has too many friendsThere’s a well-known saying in trading: “The trend is your friend.”
I firmly believe in this principle. However, when price movements become too extreme—too fast and too far—it’s wise to exercise caution, even if you’re not ready to take the opposite side of the trade.
And right now, I believe that’s exactly the case with Gold.
________________________________________
Why a Major Gold Correction is Likely
As I’ve been repeating like a broken record since Monday, Gold’s price is severely deviated from the mean, signaling that a brutal correction is on the horizon.
After reaching a new all-time high of 3,150, Gold retraced yesterday, dropping to 3,100—a support level formed earlier in the week. A rebound followed, but as I’ve explained in an educational article, this price action looks more like a stepwise distribution rather than true buying strength.
The key point?
➡️ Support isn’t holding because buyers are stepping in—it’s holding because big sellers have paused selling.
________________________________________
Still Bullish, But a Drop is Coming
There’s no doubt that Gold is in a strong uptrend. But even if it drops 1,000 pips, the overall bullish trend would still be intact.
Key Technical Signs of Weakness
📉 Trendline Break – Yesterday, Gold broke below the rising trendline, marking the first sign of weakness.
📉 Failed Rebound – Despite a short-term bounce, the price is now more likely confirming the break rather than invalidating it.
📉 Lower High in Progress? – The next minor support sits at 3,120. If Gold breaks below this level, we’ll have confirmation of a lower high, which strengthens the bearish case.
________________________________________
Targeting the Correction
If Gold breaks below 3,120, I expect a move below 3,100, targeting:
🎯 Soft target: 3,080
🎯 Likely target: 3,030 – 3,040
I believe it’s only a matter of time before this brutal correction plays out.
Let’s see how it unfolds! 🚀
Disclosure: I am part of Trade Nation's Influencer program and receive a monthly fee for using their TradingView charts in my analyses and educational articles.

XAUUSD:Short at highs primarily, long on pullbacks secondarilyThe 4-hour chart shows that the short-term moving averages of gold are converging, and the lower shadows of the K-lines appear frequently. The downward momentum is weakening, which may indicate a technical correction after a period of sideways consolidation, and there is a possibility of a second upward pull.
The hourly chart shows that the price range is narrowing, and the technical pattern is gradually being adjusted into place. Currently, the upper resistance levels are between 3137 and 3142, and the lower support levels are between 3111 and 3107.
In terms of trading operations, I suggests mainly taking short positions near the end of the trading session, with going long on the pullback as a secondary strategy.
XAUUSD Trading Strategy:
sell@3130-3135
TP:3120-3110
buy@3110-3115
TP:3125-3130
Get daily trading signals that ensure continuous profits! With an astonishing 90% accuracy rate, I'm the record - holder of an 800% monthly return. Click the link below the article to obtain accurate signals now!

Tariff highlights, gold price up or down ?⭐️GOLDEN INFORMATION:
Gold prices (XAU/USD) find support from dip-buyers during the Asian session on Wednesday, pausing the previous day’s pullback from a fresh record high. Investors continue to seek shelter in safe-haven assets amid uncertainty surrounding US President Donald Trump’s sweeping reciprocal tariffs and their potential repercussions on the global economy.
Additionally, escalating geopolitical tensions provide further support for bullion. Mounting concerns over a potential US recession, coupled with growing expectations of additional Federal Reserve (Fed) rate cuts, fuel demand for the non-yielding yellow metal.
⭐️Personal comments NOVA:
Gold price is still in a very stable uptrend, market tariff information waiting for the next price increase fomo
⭐️SET UP GOLD PRICE:
🔥 ATH : SELL 3173 - 3175 SL 3180
TP: 3165 - 3150 - 3140
🔥BUY GOLD zone: $3058 - $3060 SL $3053
TP1: $3070
TP2: $3080
TP3: $3090
🔥BUY GOLD zone: $3106 - $3108 SL $3103 scalping
TP1: $3113
TP2: $3118
TP3: $3125
⭐️Technical analysis:
Based on technical indicators EMA 34, EMA89 and support resistance areas to set up a reasonable BUY order.
⭐️NOTE:
Note: Nova wishes traders to manage their capital well
- take the number of lots that match your capital
- Takeprofit equal to 4-6% of capital account
- Stoplose equal to 2-3% of capital account
