XAUUSD trading opportunities.6/5/2025The increase in uncertainty also caused the XAUUSD trend to continue to strengthen. The target position of 3330-3350 set yesterday is the short-term pressure position. In the Asian market, XAUUSD/GOLD hit the recent high again. After reaching 3387, it fell back. The current price is 3350. According to the momentum chart, the market is in a stage of bullish growth. Risk aversion has increased, which has led to more buying than selling.
In terms of trading, traders with large amounts of funds can buy at the current price, and those with small amounts of funds can wait until the market retreats below 3330 before choosing to join again.
The Swing Trading Center continues to update new real-time trading opportunities. If you don't know how to trade, or don't want to miss the next real-time trading opportunity, remember to follow me.
Xauusdsignal

GOD BUY GREAT TUESDAY
Greetings traders this is my analysis on gold and its a long for buy
Technical analysis of gold
informatoin ; Head and Shoulders
this pattern is now even more clearly presented with.
Head_ a higher peak (higher high)
Left shoulder_a weaker atempt recover , which confirms the loss of bullish strength
Usually, such a pattern is followed by a corrective move downwards (which has already been partially see)
potential trend change zone
Highlighted support in zone
3345_3325 usd _very imortant for confirming the bullish scenario.
the shown ''bounce zone'' suggests a possible purchase if the price bounces from this area
predicted path expected
fall to support (around 3345_3325 USD
Conclusion and strategy
Scenario 1(main) buy zone between 3357 3335 if price action signal is seen (pin bar engulfing
TARGET 3500+
Stoploss: Bellow 3300 support
Scenario2 (riskier) : If price does not bounce from that zone possible further deepening towards 3250 3215
Dear Traders like comment let me know what do you think

Gold bulls are back in force. What is the operation strategy?The gold price has reached the sideways fluctuation range expected by Quid. This matches my morning prediction.
From the 4-hour trend:
Gold has now broken through the first upward resistance level predicted by Quid, and is currently fluctuating slightly in the 3315-3320 range.
The current upward resistance position is around 3330. The lower support is currently located at 3275-85. If gold does not retreat, then the upward trend may test the position around 3350.
On the contrary, if gold chooses to retreat, traders need to pay attention to the 3275-3285 decline range.
Quid believes that as long as gold retreats and stabilizes in the 3275-3285 range, then a long operation strategy can be carried out at this position.
The current upper high is still at 3350. If the upward resistance level of 3350 is broken later, I expect the price of gold to reach a height of 3380-3420.

Gold prices rose rapidly after falling. What happened?Gold prices rose in late Asian trading hours.
In the morning, gold prices stabilized above $3,250 as investors returned to defensive assets due to continued uncertainty in the US trade agreement with China and Japan, and increased geopolitical tensions in the Middle East and Ukraine.
The weak dollar before the Fed meeting and the decline in expectations for rate cuts also supported gold demand. The market focus remains on US trade news and the hawkish stance that the Fed may take this week.
Quaid's analysis of market views:
1. Despite the short-term adjustment in the market, the bullish logic of gold still exists, and bullish investors are more willing to buy when the price is low. The continued volatility of US government policies and the slowdown in US economic growth constitute strong support for gold.
2. During the previous Asian holiday, the gold market fell to the key support of $3,200. After the opening, Yanzhou buyers quickly bought at a low price, causing gold to rise rapidly in the short term.
Quaid believes that from a technical point of view, the gold price has reached the bottom resistance level of the range. If the price of gold does not react to the false breakout and continues to hit 3315-3320, then a breakout and consolidation above this level will strengthen it to 3320-3350.
Upward resistance: 3315, 3320, 3350
Downward support: 3265, 3250, 3220
Since the opening, the price of gold has retested 3269 twice. Buyers are testing the resistance level in the hope of a breakout. If the bulls break through 3315-3320 and consolidate above 3310, the possibility of an upside move will be high. However, the possibility of another test of the liquidity area of 3250 before the upside move cannot be ruled out.
If the price of gold breaks through the upward resistance, traders can try to go long in the short term and conduct scalping.
On the contrary, if the price of gold fluctuates sideways in the 3310-3315 range, Quaid recommends shorting in this range.

Gold fluctuates widely; short-term trading analysis.In the morning of the Asian market, spot gold fluctuated slightly and is currently trading around $3,270/ounce, an increase of about 0.9%.
As Mr. Trump's latest statement hit the market's risk appetite, the price of gold rose rapidly in the short term. The current London gold price has reached $3,270/ounce, climbing nearly $30.
In addition, the market focus has turned to the Federal Reserve's May FOMC meeting on May 7. Although the market has priced in a standstill, Powell's latest remarks and press questions after his radical statement in April will attract high attention.
Asian market morning analysis:
Gold prices rebounded again in the morning of the Asian market. Quaid believes that if gold does not break through strongly, it will still fluctuate within the range, and the current bullish situation has not reversed. If gold continues to maintain its strength, it can resume the bullish trend. But it has not broken through for the time being, so the possibility of shorting is still very large.
Gold's 1-hour moving average continues to be in a downward short position, and there is still room for gold shorting; gold was under pressure at 3270 in the early stage and fell back, and the early rebound was under pressure at 3270 and continued to fall. Gold is still fluctuating within the range in 1 hour, and Quide believes that the short-selling trading strategy is still the main one.
Operation strategy:
Short-term operation: short at 3265, stop loss at 3280, and profit at 3250-3240.
I hope Quide's analysis can help all traders make profits in the gold market in time and harvest the first gold of the day.

XAUUSD:Sharing of the Latest Trading StrategyThis week’s trading wrapped up successfully. Our exclusive VIP trading signals achieved a 90% accuracy rate!👉👉👉
After the release of the Non-Farm Payrolls data, the price of gold initially declined and then rebounded, continuing its range-bound trading pattern. Recently, the impact of the NFP data on the gold price has weakened, and the volatility is lower than the normal level. The price level of 3,280 will be a crucial inflection point determining the battle between bulls and bears next week. If the gold price fails to break through the resistance at the 3,280 level and is suppressed, it is highly likely that the range-bound trading pattern will persist, and the bullish trend is unlikely to reverse directly in the short term. In terms of trading operation, it is advisable to wait for a rebound and then execute short positions.
Trading Strategy:
sell@3280-3260
TP:3240-3220
The signals in the Signature have brought about continuous profits, and accurate signals are shared every day. Hurry up and click to get them!
👇 👇 👇 Obtain signals👉👉👉

XAU/USD "The Gold" Metal Market Heist Plan (Scalping / Day)🌟Hi! Hola! Ola! Bonjour! Hallo! Marhaba!🌟
Dear Money Makers & Robbers, 🤑💰✈️
Based on 🔥Thief Trading style technical and fundamental analysis🔥, here is our master plan to heist the XAU/USD "The Gold" Metal Market. Please adhere to the strategy I've outlined in the chart, which emphasizes long entry and short entry. 🏆💸Be wealthy and safe trade.💪🏆🎉
Entry 📈 :
"The loot's within reach! Wait for the breakout, then grab your share - whether you're a Bullish thief or a Bearish bandit!"
🏁Buy entry above 3060
🏁Sell Entry below 3000
📌However, I recommended to place buy stop for bullish side and sell stop for bearish side.
Stop Loss 🛑:
🚩Thief SL placed at 3020 for Bullish Trade
🚩Thief SL placed at 3040 for Bearish Trade
Using the 30mins period, the recent / swing low or high level.
SL is based on your risk of the trade, lot size and how many multiple orders you have to take.
Target 🎯:
🏴☠️Bullish Robbers TP 3140 (or) Escape Before the Target
🏴☠️Bearish Robbers TP 2970 (or) Escape Before the Target
XAU/USD "Gold vs U.S Dollar" Metals Market Heist Plan is currently experiencing a neutral trend,., driven by several key factors.
📰🗞️Get & Read the Fundamental analysis, Macro Economics, COT Report, Seasonal factors, Sentimental Outlook, Positioning and future trend.....👉👉👉
⚠️Trading Alert : News Releases and Position Management 📰 🗞️ 🚫🚏
As a reminder, news releases can have a significant impact on market prices and volatility. To minimize potential losses and protect your running positions,
we recommend the following:
Avoid taking new trades during news releases
Use trailing stop-loss orders to protect your running positions and lock in profits
💖Supporting our robbery plan 💥Hit the Boost Button💥 will enable us to effortlessly make and steal money 💰💵. Boost the strength of our robbery team. Every day in this market make money with ease by using the Thief Trading Style.🏆💪🤝❤️🎉🚀
I'll see you soon with another heist plan, so stay tuned 🤑🐱👤🤗🤩

GOLD ( XAUUSD ) : H4 / D1 : Big Long !!!Hello Traders! 👋
What are your thoughts on Gold?
After a strong upward move, gold entered a corrective phase upon reaching the $3500 resistance zone.
This correction could offer a buy-the-dip opportunity, with potential for a move back toward the recent highs.
XAUUSD
Market price : 3240
Buy limit : 3140 - 3120
Tp1 : 3240
Tp2 : 3340
Tp3 : 3500
Tp4 : 3750
Sl : 3030 ( 100 pip )
Don’t forget to like and share your thoughts in the comments! ❤️

XAUUSD:Sharing of the Trading Strategy for Next Week This week’s trading wrapped up successfully. Our exclusive VIP trading signals achieved a 90% accuracy rate!
On Friday during the U.S. trading session of the gold market, the Non-Farm Payrolls data was bearish for gold. We directly initiated a short position on gold at 3,260. Although gold rebounded subsequently, it was still prompted that as long as gold did not break through 3,280, a short position should be taken. Below this level remains the optimal price point for placing a short order. Next week, we will still mainly wait for a rebound to initiate short positions.
The signals in the Signature have brought about continuous profits, and accurate signals are shared every day. Hurry up and click to get them!
👇 👇 👇 Obtain signals👉👉👉

Gold fell as expected. What will happen next week?Gold fell within the range expected by Quid. Although it rebounded slightly, the final result did not change. Will the direction of gold change next week?
Quid's analysis:
Gold's 1-hour moving average is downward, and there is a trend of continuous downward development; gold is currently under pressure from the 3270 line, so 3270 will still be the key turning point for gold bears next week. Although gold has rebounded slightly, the magnitude of the decline is not large; if the upward resistance level of 3270 fails to break through next week, it may be in a sideways fluctuation.
The downward trend will not reverse for the time being, unless major news is released on the weekend, which directly affects the gold market.
Quid believes that the ups and downs of the market are normal. Gold has fallen by about $300 from its high point, and the overall trend in the near future is still downward; it continues to fall after a small rebound, which means that the strength of gold bears is still there.
Quide believes that it is always easy to follow its trend; violating its rules always makes oneself exhausted; the market is always right, and standing on the opposite side of the market will always be taught a lesson by the market. In the face of the overall trend, traders should not be lucky, and the market will not forgive your mistakes again and again.
Operation strategy:
Short around 3270, stop loss at 3280, take profit around 3220;
Summary of the Gold Market This WeekThis week, the gold market showed a clear downward trend, with spot gold accumulating a 2.43% decline.👉👉👉
The economic data had a significant impact on the gold market this week. Data released by the US Department of Labor on the 2nd showed that the non - farm payroll employment in the US increased by 177,000 in April, much better than the expected 138,000, and the growth data for the previous two months were revised downwards. The US unemployment rate was 4.2% in April, in line with market expectations. The strong non - farm payroll data reduced the possibility of the Federal Reserve cutting interest rates in June. Under normal circumstances, the reduction in the interest rate hike expectation should be bullish for gold. However, the gold market did not rise sharply this time, mainly because the gold price had risen significantly in the early stage and the long - term investors had a strong sentiment of taking profits. At the same time, the relatively good employment data also reflected the resilience of the US economy to a certain extent, weakening the appeal of gold as a safe - haven asset. As a result, the gold price did not show an obvious upward trend immediately after the data was released. Instead, it remained volatile in the short term.
From a technical perspective, although the gold price has declined this week, the futures price still has certain technical advantages in the near term. On the daily chart, although a negative candlestick was recorded this week, the previous upward trend has made the moving average system still show a long - term arrangement. From the perspective of the RSI, the current value is hovering around 50, indicating that the market's long and short forces are temporarily relatively balanced, and neither side has an obvious advantage. Therefore, the gold price has entered a consolidation stage.
With the economic development in Asia and the changes in consumers' demand for gold investment and jewelry, Asia's influence in the global gold market has become increasingly prominent. If the demand in Asia remains strong in the future, it will provide strong support for the gold price. On the contrary, if the demand weakens, it may increase the downward pressure on the gold price.
Looking ahead to next week, the gold market still faces many uncertainties. On the one hand, the continuous changes in economic data and the direction of the Federal Reserve's monetary policy remain key factors. If the subsequently released data continue to show the resilience of the US economy, it may further reduce the market's expectation of a rate cut by the Federal Reserve, thereby suppressing the gold price. On the other hand, any new development in the international trade situation may trigger fluctuations in the market's risk - averse sentiment, thus affecting the supply - demand relationship and price trend of gold.

GOLD D1 Chart Update For Shorter Term TradingRead all levels mentioned in chart carefully as we have 2 directions
Right now GOLD standing at turning point
GOLD remains in BUY trend as long as stays above 2900-3000 Zone

Gold's Symmetrical Triangle Near Break – Support Test Imminent!Gold ( OANDA:XAUUSD ) moved as I expected in my previous post and attacked the Support zone($3,282-$3,245) and Support lines for the second time . The question is, can Gold break the Support zone($3,282-$3,245) and Support lines or not!?
Please stay with me .
Gold is moving between Support zone($3,282-$3,245) and Resistance zone($3,386-$3,357) again . In fact, it can be said that Gold has been moving in a range for the past 5-6 days .
From a Classical Technical Analysis perspective, Gold appears to be forming a Symmetrical Triangle Pattern. A break of either line could indicate the next direction for Gold, but since the Symmetrical Triangle Pattern is a Continuation Pattern , the lower line is more likely to break .
In terms of Elliott Wave Theory analysis , it seems that we still have to wait for the next five downwaves .
------------------------------------------
Today, important U.S. data — JOLTS Job Openings and CB Consumer Confidence — will be released.
Let’s quickly review their potential impact on Gold:
JOLTS Job Openings :
If the number comes lower than expected , it signals a weakening labor market, increasing the chances of a dovish Fed → Bullish for Gold .
If the number is stronger than expected , it indicates a robust labor market, pushing the Fed to stay hawkish → Bearish for Gold .
CB Consumer Confidence :
A drop in consumer confidence reflects economic worries , driving demand for safe-haven assets like Gold → Bullish .
A rise in consumer confidence shows economic strength, reducing the appeal of Gold → Bearish .
Historical Impact :
Both indices have caused strong intraday moves in Gold recently, especially if the figures surprise the market.
Summary :
Weak JOLTS and low Confidence → Gold bullish
Strong JOLTS and high Confidence → Gold bearish
Be prepared for high volatility during the releases. Always manage your risk carefully!
------------------------------------------
I expect Gold to attack the Support zone($3,282-$3,245) and Support lines for at least the third time , and if it breaks, the next target could be $3,223 .
Note: If Gold can move above $3,393, we can expect more pumps and maybe make a new All-Time High(ATH).
Gold Analyze ( XAUUSD ), 1-hour time frame.
Be sure to follow the updated ideas.
Do not forget to put a Stop loss for your positions (For every position you want to open).
Please follow your strategy; this is just my idea, and I will gladly see your ideas in this post.
Please do not forget the ✅' like '✅ button 🙏😊 & Share it with your friends; thanks, and Trade safe.

The decisive battle day of major data (XAUUSD/GOLD)
Yesterday, it was clearly pointed out that the pressure position after the rebound is 3255-3270. Today, due to the oversold influence of XAUUSD, it rebounded to a high of 3258. In terms of operation, it is still mainly chosen to sell. Today is the "third day" deadline. If the impact of geopolitics continues to be suspended. It is expected that XAUUSD will fall by $100/ounce today.
There have been some oversold rebounds in the Asian market XAUUSD. Beware of the market's inducement to buy more. So 3260-3270 continues to be mainly sold.
TP1 3230-3220.
TP2 3170-3160

5/2 Gold Trading SignalsI'm very sorry that today's update is a little late because I'm traveling during the holiday. However, I have already told you about the trading strategy yesterday. The market changes are still in line with our expectations. Following the signal of selling in the 3260-3280 range, the returns should be good.
Gold is now falling back. There is support near 3200, but the bears are strong at present, so it is still mainly selling. This decline is expected to fall below 3200, but because of the support, the possibility of a direct break is not very high. If it falls directly, there will definitely be at least one small rebound, roughly around 3210.
So the transaction can be carried out like this:
Buy in the 3194-3185 range
Sell in the 3246-3258 range

Non-farm data is released, and gold is still going to fall.
📌 Gold information
Today, the market will usher in the heavy non-farm data for April. From the expected value, there are only 130,000 people, far lower than the expected 228,000 people, and the unemployment rate remains at 4.2%.
If we refer to the unsatisfactory ADP data in April, then the number of non-farm people in April should have declined, or it is lower than expected, but the ADP data cannot fully correspond to the final non-farm data. This is the answer given to us by too many experiences in the past, so it cannot be concluded that the non-farm data this time will be lower than expected.
📊Comment analysis
Combined with the technical aspect, the strong technical pressure above the international gold price is around 3280, and then the 3300 mark. Even if it rebounds next, the pressure of the above two prices cannot be broken, and there is still a probability of a pullback adjustment. The initial support below is 3230, and after breaking through the position, it will follow the trend to explore 3205.
💰Strategy Package
If today's non-agricultural data cannot provide strong support for gold prices, the rise in gold prices in the short term will be difficult to sustain. The specific decision can only be made after the final release of the afternoon data and the guidance on prices. The trend fluctuations tonight will be very intense. Remember to strictly control your positions to prevent risks.
⭐️ Note: Labaron hopes that traders can properly manage their funds
- Choose the number of lots that matches your funds
- Profit is 4-7% of the fund account
- Stop loss is 1-3% of the fund account

THE KOG REPORT - NFPTHE KOG REPORT – NFP
This is our view for NFP, please do your own research and analysis to make an informed decision on the markets. It is not recommended you try to trade the event if you have less than 6 months trading experience and have a trusted risk strategy in place. The markets are extremely volatile, and these events can cause aggressive swings in price.
We’ve done well this week on gold, capturing the high into the low and then taking the long late session which has nearly completed our higher target for a decent week on this precious metal. As we’ve said, best practice is to let this play out, let them take it to where they want, once it settles, then look for the trade.
We have support now at the 320-35 level which is a key level that will need to break in order to reverse and go lower. This level also lines up with our Excalibur levels and red boxes so we can say it’s pretty strong. Above, we have the 3270-75 region which is the previous order level, our volume indicator is suggesting a pull back, so rejection there can take us back into support to settle for the NFP release. It’s this level, if held which can push this upside and our thoughts are at the moment, are they going to take this back into the previous range and hold it there into the close.
So as long as 3240 holds us, we’re likely to see higher pricing for now, 3310-20 is the key level above which needs to break to then give us the flip and potential for a new all time high.
For now, let’s sit back and see what happens.
RED BOXES:
Break above 3262 for 3265, 3270, 3275 and 3288 in extension of the move
Break below 3252 for 3240, 3236, 3230 and 3220 in extension of the move
Please do support us by hitting the like button, leaving a comment, and giving us a follow. We’ve been doing this for a long time now providing traders with in-depth free analysis on Gold, so your likes and comments are very much appreciated.
As always, trade safe.
KOG

XAUUSD Potentially ShortOANDA:XAUUSD Retesting the broken support of the consolidation phase, a close below that area will signify a shorting opportunity.
Fingers crossed

Gold Bears Won Big – Here’s the Next Resistance to WatchYesterday was a great day for Gold bears – just as anticipated, price dropped nearly 1,000 pips and hit my target zone around 3200.
After such a strong move, we’re now seeing a typical rebound, which might offer a fresh opportunity to sell into strength and ride the prevailing trend.
🔍 Key Zone:
- 3270 now acts as resistance.
- If price stalls here, it’s the ideal area to look for short entries targeting a retest of 3200.
🛠️ Plan: Sell spikes into 3270 resistance and stay with the trend.
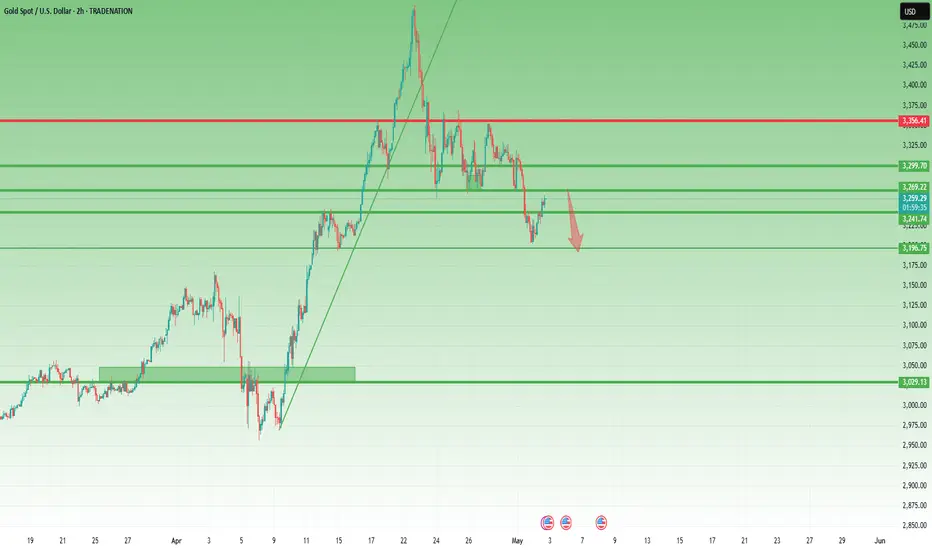
XAUUSD Gold Trade Setup – Buy & Sell Zones | 2H Chart AnalysisThis XAUUSD (Gold vs USD) 2-hour chart analysis outlines a short-term swing trading plan using key supply and demand zones. Price has reacted from the Buy Zone (3197–3216) and is showing signs of bullish reversal. The target is the Sell Zone (3347–3363).
✅ Trade Plan:
🔽 Buy Entry:
Zone: 3,197 – 3,216 USD
Trigger: Bullish candle breakout above the falling trendline
Confirmation: Retest of breakout with bullish price action
🎯 Targets:
TP1: 3,302 (mid-range level)
TP2: 3,347 (Sell Zone bottom)
TP3: 3,363 (Sell Zone top)
🛑 Stop Loss:
Below 3,190 or latest swing low
🔼 Sell Setup (optional):
Zone: 3,347 – 3,363 USD
Look for bearish reversal patterns (e.g., bearish engulfing, double top)
Target retrace back to 3,302 or 3,260 area

Gold (XAU/USD) 3H Chart Analysis – Bullish Setup Toward $3,500 TCurrent Price: $3,254.26
EMA 70: $3,285.50 (Price is below EMA – cautious zone)
Bias: Bullish 📈 (if demand zone holds)
Key Zones:
🟦 Demand Zone: $3,200 – $3,260
✅ Strong buy interest expected here
⚠️ Good place to look for entry signals
🟥 Resistance Zone: $3,223.60 – $3,323.84
🔄 Price is currently testing this zone
A breakout here can lead to bullish momentum
🎯 Target Point: $3,500 – $3,529 💰
📌 Defined as "Target Point 3500"
High potential for profit-taking here
⛔ Stop Loss: $3,161.32
🚫 Placed below demand zone for risk control
❗ Important to exit if price drops here
Trade Idea 💡
📥 Buy Entry: Near or above $3,223.60
✅ Hold as long as price respects demand zone
🎯 Target: $3,500
⛔ Stop Loss: $3,161.32
⚖️ Risk:Reward ratio looks favorable!
Quick Summary:
🟢 Bullish Setup
💪 Demand zone is strong
📈 Breakout above resistance may fuel a rally
⏳ Wait for confirmation before entry!

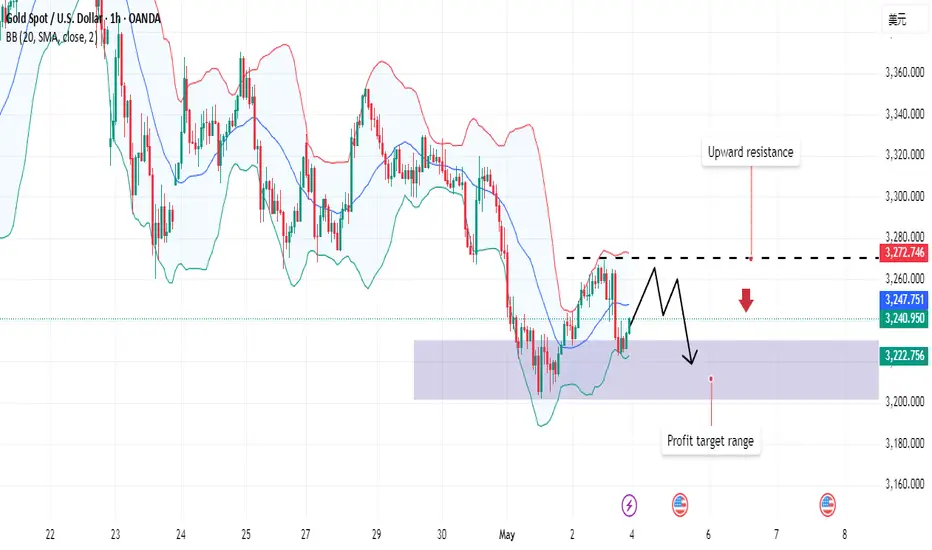
4-hour chart for XAUUSD (Gold Spot vs US Dollar)This is a 4-hour chart for XAUUSD (Gold Spot vs US Dollar) showing a technical analysis setup:
1. Current Price:
Sell: 3,238.70
Buy: 3,239.00
2. Marked Levels:
There's a red shaded area labeled "ENTRY ZONE" between 3,272.81 and 3,273.79.
This zone likely acts as a resistance or pullback area where a sell entry is being considered.
3. Market Structure:
Price previously moved up strongly (bullish), but now it’s forming lower highs and lower lows, indicating a bearish trend.
A projected path is drawn showing that price might go back up into the entry zone and then drop further — with a potential target near 3,009.75.
4. Bias:
The overall bias shown in the chart is bearish.
It suggests a sell opportunity in the entry zone, expecting price to fall after a short-term pullback.
If you want, I can help you build a full trade plan (entry, stop loss, and take profit) based on this chart too. Just let me know!

The latest trend of the gold market and operation suggestionsAt present, on the daily chart, gold closed with a medium-sized bearish candle. In the early trading session, it directly broke below the crucial defensive level of 3,370, thoroughly opening up the adjustment range. Meanwhile, it triggered the MACD indicator to form a death cross. Now that the gold price has reached a new low, the dominant strategy for the early trading session is still to sell on rallies.
On the 4-hour chart, in today's early trading session, the price directly broke down and smoothly pierced through the support area ranging from 3,270 to 3,260, realizing the transformation between the top and the bottom. At the 1-hour level, not only has it broken below the previous low of 3,260, but the moving averages have also formed a death cross, indicating strong bearish momentum. It is advisable to sell decisively when the gold price rebounds to around 3,270, which is the densely traded area at the lower part of the recent box consolidation. If the rebound fails to even reach the vicinity of 3,260, in an extremely bearish market situation, the downward space for the gold price will be further expanded.
Overall, for short-term trading of gold, the operation strategy should mainly focus on selling on rallies, supplemented by taking light long positions on pullbacks. Pay close attention to the resistance range from 3,235 to 3,245 on the upside, and closely monitor the support levels from 3,200 to 3,190 on the downside.
XAUUSD
sell@3225-3230
tp:3210-3200
Investment itself is not risky; it is only when investment is out of control that risks occur. When trading, always remember not to act on impulse. I will share trading signals every day. All the signals have been accurate without any mistakes for a whole month. No matter what gains or losses you've had in the past, with my help, you have the hope of achieving a breakthrough in your investment.
