3000 Target goldThis is a 1-hour chart of Gold Spot (XAU/USD) from OANDA. The analysis suggests a bullish outlook, with price action currently testing a key resistance level around 2,934. The chart includes the following key elements:
1. Support and Resistance Levels:
A previous resistance zone (marked in dark teal) has been broken and is now acting as potential support.
The next major resistance is around 2,980, with an all-time high target of 3,000.
2. Trendline Support:
A white ascending trendline indicates a bullish structure, with price respecting higher lows.
3. Projected Move:
The yellow arrow suggests a pullback to the support zone (previous resistance) before bouncing higher.
A successful retest could lead to an upward move towards 3,000.
This analysis suggests that gold remains in an uptrend, and traders might look for confirmation of support before entering long positions.
Xauusdsignal

Gold is falling as expectedThe market has started to decline. Whether the 3,000 will become history remains unknown, but the current decline is real! In the evening, it is necessary to avoid emotional trading. Those who blindly follow the trend and go long are hoped to stay rational. After continuous rises, it has now started to fall. Currently, the market is in a slump. This situation won't be in a high-level range bound. If it doesn't rise, it will fall.
Today is already Friday. Only after the gold price drops to the support level below will it rise further! So, go short in the evening and pay attention to the 2,970 as the dividing line!
Trading Strategy:
sell@2990-2980
tp 2970-2960
I always firmly believe that profit is the sole criterion for measuring strength. I will share accurate trading signals every day. Follow my lead and wealth will surely come rolling in. Click on my profile for your guide.

XAU/USD "The Gold vs U.S Dollar Metals Market Money Heist Plan🌟Hi! Hola! Ola! Bonjour! Hallo! Marhaba!🌟
Dear Money Makers & Robbers, 🤑 💰💸✈️
Based on 🔥Thief Trading style technical and fundamental analysis🔥, here is our master plan to heist the XAU/USD "The Gold vs U.S Dollar Metals market. Please adhere to the strategy I've outlined in the chart, which emphasizes short entry. Our aim is the high-risk Green Zone. Risky level, oversold market, consolidation, trend reversal, trap at the level where traders and bullish robbers are stronger. 🏆💸Book Profits Be wealthy and safe trade.💪🏆🎉
Entry 📈 : "The vault is wide open! Swipe the Bearish loot at any price - the heist is on!
however I advise to Place buy limit orders within a 1H or 30 minute timeframe most recent or swing, low or high level.
Stop Loss 🛑:
Thief SL placed at the recent / swing low level Using the 3H timeframe (2930) swing trade basis.
SL is based on your risk of the trade, lot size and how many multiple orders you have to take.
Target 🎯:
Primary Target - 2830 (or) Escape Before the Target
Secondary Target - 2750 (or) Escape Before the Target
🧲Scalpers, take note 👀 : only scalp on the Short side. If you have a lot of money, you can go straight away; if not, you can join swing traders and carry out the robbery plan. Use trailing SL to safeguard your money 💰.
📰🗞️Read the Fundamental, Macro, COT Report, Sentimental Outlook, Intermarket Analysis, Future Prediction:
XAU/USD "The Gold vs U.S Dollar Metals Market is currently experiencing a Bearish trend., driven by several key factors.
1. Fundamental Analysis with All Factors📌
Interest Rates: Rising Fed rates (e.g., 5.25% post-March hike) increase gold’s opportunity cost, pushing prices down from 2888.
Inflation: Cooling global inflation (e.g., U.S. CPI at 2.5%) undermines gold’s hedge appeal, signaling overvaluation.
Dollar Strength: USD rally (e.g., DXY to 102-105) suppresses gold, marking 2888 as a peak.
Global Economic Health: Improving growth (e.g., U.S. GDP above 3%) reduces safe-haven demand, favoring bears.
2. Macroeconomic Factors📌
Bearish macro conditions:
U.S. Economy: Strong jobs (e.g., unemployment below 4%) and PMI above 50 weaken gold’s case at 2888.
Eurozone: Recovery signs (e.g., GDP at 1.5%) bolster EUR, pressuring gold.
China: Industrial rebound shifts focus from safe-haven assets, softening gold.
Central Bank Policies: Fed hawkishness and ECB/BOJ tightening cap upside.
3. Geopolitical Factors📌
Bearish geopolitical shifts:
U.S.-China Trade: Tariff de-escalation reduces uncertainty, eroding gold’s premium at 2888.
Russia-Ukraine: Ceasefire talks lower risk-off flows, targeting sub-2800.
Middle East: Stabilizing oil supply (e.g., Iran deal) eases inflation fears, weakening gold.
Political Uncertainty: Resolved U.S./Europe tensions diminish volatility, favoring bears.
4. Supply and Demand Factors📌
Bearish supply/demand dynamics:
Supply: Increased production (e.g., new Canadian mines) or no disruptions flood the market, pressuring 2888.
Demand:
Physical: Western retail demand fades as prices peak.
Central Banks: Slowed buying (e.g., Russia, China pausing) removes support.
Investment: ETF outflows accelerate as investors sell at 2888.
5. Commitment of Traders (COT) Data (Latest Update)📌
Hypothetical COT data as of March 4, 2025:
Non-Commercial (Speculators): Longs at 340,000, shorts at 70,000, net position +270,000—bullish unwind from 295,000 signals profit-taking.
Commercial: Longs 65,000, shorts 400,000—heavy hedging bets on a drop.
Open Interest: 525,000 (down 5,000), showing reduced speculative interest.
Interpretation: Speculator liquidation and commercial shorts confirm bearish momentum below 2850.
6. Technical Factors📌
Bearish technicals at 2888:
Moving Averages: 50-day SMA (e.g., 2850) crossing below 200-day SMA (e.g., 2870) signals reversal.
Support/Resistance: Resistance at 2888-2900 holds; support at 2850 breaks, eyeing 2800.
RSI: 70+, overbought, triggers selling.
MACD: Bearish crossover confirms downward momentum.
7. Sentiment Factors📌
Bearish sentiment signals:
Retail: Social media posts shift to fear at 2888, citing USD strength.
Institutional: COT hedging aligns with bearish media (e.g., “Gold overbought”).
Media: “Fed hikes crush gold” headlines fuel sell-offs.
8. Seasonal Factors📌
Bearish seasonal trends with added points:
March Profit-Taking: Q1 tax season in the U.S. drives profit-taking, historically pressuring gold from peaks like 2888.
Post-Rally Fatigue: Early-year rallies (e.g., January-February) often fade in March, amplifying bearish momentum.
Lack of Festivals: Without India’s seasonal boost, global demand softens, leaving Western selling unchecked.
Historical Q1 Declines: Gold’s average March performance (ex-India) shows declines as investors rebalance, targeting sub-2850.
Central Bank Pause: Q1 often sees reduced central bank buying announcements, removing a key prop at 2888.
9. Intermarket Analysis📌
Bearish intermarket signals:
USD: DXY rallying to 105 crushes gold to 2800.
Yields: 10-year yield at 4.5% competes with gold, driving declines.
Equities: Stock rallies (e.g., MSCI World above 3100) divert capital.
Commodities: Oil at $70/barrel signals deflation, weakening gold.
10. Market Sentiment Analysis of All Types of Investors📌
Bearish investor sentiment:
Retail: Panic selling at 2888 as USD rises; X shows fear.
Institutional: Speculators trim longs (COT); hedgers pile into shorts.
Central Banks: Pause buying, letting prices slide.
Speculators: Futures traders short 2888, targeting 2800.
11. Next Trend Move and Future Trend Prediction (Bearish Focus)📌
Short-Term (1-4 weeks):
Bearish Target: 2820-2850. Drop to 2820 as USD hits 102 and RSI confirms overbought.
Bias: Strongly bearish, driven by technicals and COT liquidation.
Medium-Term (1-3 months):
Bearish Target: 2700-2800. Decline to 2700 with Fed hikes, DXY at 105, and easing tensions.
Bias: Bearish, with macro stabilization.
Long-Term (6-12 months):
Bearish Target: 2500-2600. Fall to 2500 if growth rebounds, DXY hits 110, and inflation drops below 2%.
Bias: Bearish, as safe-haven demand fades.
12. Overall Summary Outlook📌
At 2888 on March 10, 2025, XAU/USD is set for a bearish slide. A strong USD (DXY to 105), rising yields (4.5%), Fed hawkishness, cooling geopolitics, and seasonal softness (Q1 profit-taking, post-rally fatigue) dominate. Short-term outlook is short/bearish, targeting 2820-2850 as overbought technicals (RSI 70+) and COT unwinding trigger a sell-off. Medium-term is bearish, eyeing 2700-2800 with macro improvement. Long-term is bearish, forecasting 2500-2600 as growth stabilizes.
📌Keep in mind that these factors can change rapidly, and it's essential to stay up-to-date with market developments and adjust your analysis accordingly.
⚠️Trading Alert : News Releases and Position Management 📰 🗞️ 🚫🚏
As a reminder, news releases can have a significant impact on market prices and volatility. To minimize potential losses and protect your running positions,
we recommend the following:
Avoid taking new trades during news releases
Use trailing stop-loss orders to protect your running positions and lock in profits
💖Supporting our robbery plan 💥Hit the Boost Button💥 will enable us to effortlessly make and steal money 💰💵. Boost the strength of our robbery team. Every day in this market make money with ease by using the Thief Trading Style.🏆💪🤝❤️🎉🚀
I'll see you soon with another heist plan, so stay tuned 🤑🐱👤🤗🤩

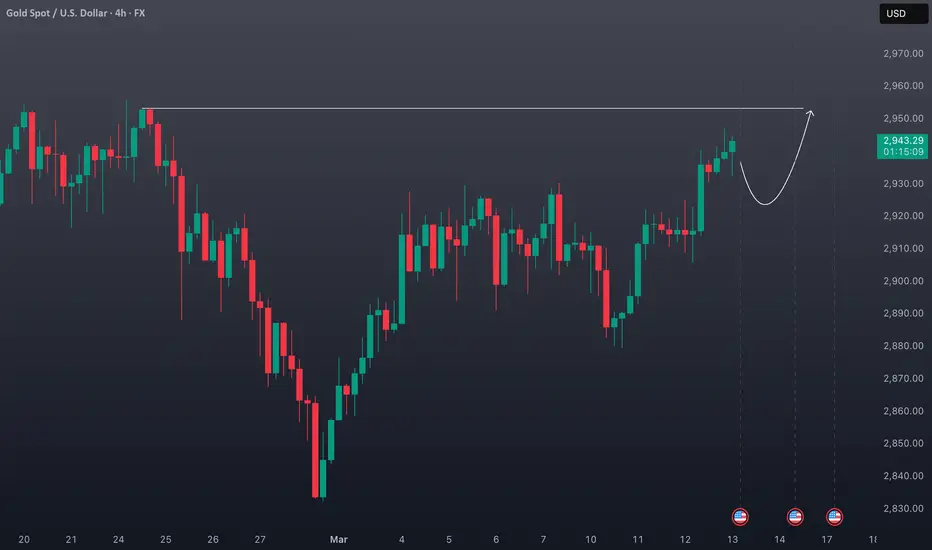
XAUUSD Showing Strength on the 4H Chart📈 XAUUSD Gold 🟡 has been demonstrating strong resilience, maintaining a clear bullish trend on this 4H timeframe. Price action continues to align with an upward trajectory, with my target set at the previous high marked on the chart 🎯.
A pullback is expected, potentially offering an opportunity to enter at a discount before a continuation toward the target zone 🚀.
⚠️ Not financial advice—always manage risk appropriately!
XAUUSD Today's strategyThe Trump administration's capricious trade policy has triggered market concerns about global economic growth, opening a new front in the global trade war, leading to increased financial marekt uncertainty, investors' risk aversion is high, and they have put money into gold, driving gold prices up.
The world continues to increase its gold reserves with relatively large efforts, providing a solid bottom support for the gold price. Data from SPDR Gold Trust, the world's largest gold ETF, shows that its gold holdings in February were at the highest level since 2023. From February 27 to March 13, the holdings also increased. The strong demand for gold investment has driven up the gold price.
BUY:2965-2975
SL:2960
TP:2995-3005
We will share various trading signals every day. Fans who follow us can get high returns every day. If you want stable profits, you can contact me.

Gold is about to plummet, double short gold!Brothers, gold accelerated to around 2985, but it could not cross 2990. The closer it is to the 3000 mark, the greater the resistance it faces. After the news is digested by the market to a certain extent, it is difficult for gold to have enough momentum to continue to break through the 2990-3000 market psychological mark in the short term, so a retracement will inevitably follow!
The accelerated squeeze of gold has been separated from the technical side. After the news returns to normal, gold will inevitably have a technical retracement demand, so we can boldly short gold again in the 2985-2990 area! Tomorrow, Friday, will definitely be a turning point. Gold will at least retrace to the 2950-2940 zone tomorrow, and may even extend to the area around 2935.
So in short-term trading, I still insist on using double trading lots to short gold at 2985-2990! Looking forward to making a profit of 400-500 pips in the short term!Trading means that everything has results and everything has feedback. I have been committed to market trading and trading strategy sharing, striving to improve the winning rate of trading and maximize profits. If you want to copy trading signals to make a profit, or master independent trading skills and thinking, you can follow the channel at the bottom of the article to copy trading strategies and signals

XAUUSD buy-and-profit trading signalGold news analysis: The latest data released on Thursday (March 13) showed that the US producer price index stagnated due to falling service costs, and the number of initial claims in the United States fell slightly, still close to pre-epidemic levels. At the same time, driven by demand for safe-haven assets due to tariff concerns and US inflation reports that reinforced expectations of future rate cuts, gold prices approached historical highs but failed to break through. As of press time, spot gold rose 0.5% to $2,946.68 per ounce. The number of initial jobless claims in the United States fell last week, but the government's sharp spending cuts and escalating trade wars threaten the stability of the labor market. The U.S. Department of Labor reported on Thursday that the number of initial jobless claims fell by 2,000 to 220,000 after seasonal adjustment in the week ending March 8. Economists surveyed by the agency had previously expected the number of initial jobless claims to be 225,000 last week. In late February, the number of applications for unemployment benefits soared due to seasonal fluctuations around the winter blizzard and the President's Day holiday, which made it difficult to adjust the data. Although the labor market remains solid, the Trump administration's policies pose downside risks.
Gold's 1-hour moving average is still a golden cross with upward bullish divergence. After breaking through the box and oscillating, gold continued to rise in the morning today and has basically stabilized at the 2930 line. Gold's retracement to 2930 is an opportunity to buy on dips. Gold can buy more first when it retraces to 2933 in the afternoon. If gold does not fall below 2930 again, then gold bulls will have further momentum to rise. Gold bulls are now ready to go and are expected to be even better. In the end, gold bulls have the upper hand in the oscillation, so follow the pace of the bulls. Whether gold can break through the historical high again, we will wait and see! Overall, recommends that the short-term operation of gold today is mainly long on pullbacks and short on rebounds. The short-term focus on the upper side is the resistance of 2985-2990, and the short-term focus on the lower side is the support of 2938-2928.
Trading is risky, so control your position reasonably. If you don't know when to enter the market, please follow the real-time signal announcement of my trading center or leave me a message, so that you can get rid of trading problems and realize profits as soon as possible. PEPPERSTONE:XAUUSD OANDA:XAUUSD CAPITALCOM:GOLD TVC:GOLD FOREXCOM:XAUUSD

PPI, gold price opportunity to create new ATH above 2956⭐️Smart investment, Strong finance
⭐️GOLDEN INFORMATION:
Core CPI, excluding volatile food and energy prices, eased from 3.3% in January to 3.1% year-over-year, signaling ongoing disinflation in the U.S. economy.
Meanwhile, the Atlanta Fed’s GDPNow model projects a -2.4% contraction for Q1 2025, marking the first negative reading since the COVID-19 pandemic.
Money market traders have adjusted their expectations for Federal Reserve easing in 2025, pricing in 71 basis points of rate cuts—down from 77 bps the previous day, according to Prime Market Terminal data.
⭐️Personal comments NOVA:
Gold has accumulated, continues to grow and heads towards a new ATH: 2976
⭐️SET UP GOLD PRICE:
🔥SELL GOLD zone: $2954 - $2956 SL $2959 scalping
TP1: $2950
TP2: $2945
TP3: $2940
🔥SELL GOLD zone: $2975 - $2977 SL $2982
TP1: $2968
TP2: $2960
TP3: $2950
🔥BUY GOLD zone: $2920 - $2918 SL $2913
TP1: $2930
TP2: $2940
TP3: $2950
⭐️Technical analysis:
Based on technical indicators EMA 34, EMA89 and support resistance areas to set up a reasonable BUY order.
⭐️NOTE:
Note: Nova wishes traders to manage their capital well
- take the number of lots that match your capital
- Takeprofit equal to 4-6% of capital account
- Stoplose equal to 2-3% of capital account

XAUUSD Analysis todayHello traders, this is a complete multiple timeframe analysis of this pair. We see could find significant trading opportunities as per analysis upon price action confirmation we may take this trade. Smash the like button if you find value in this analysis and drop a comment if you have any questions or let me know which pair to cover in my next analysis.

Gold Breaks Out: Is a New All-Time High on the Horizon?Finally, after a week of range-bound trading and a false downside breakout, Gold has found direction and surged to the upside.
As expected, the inflation data served as the catalyst. With the reported figure coming in lower than anticipated, traders are now pricing in potential rate cuts.
Technically, as mentioned, the price broke above the 2930 resistance level and reached a high at 2947 just shy of the all-time high.
Currently, Gold is undergoing a normal correction, which should present traders with an opportunity to buy at lower levels. The ideal buy zone is between 2920 and 2930, with the bullish outlook negated if the price falls back into the previous range.
In terms of targets, the old ATH acts as resistance, but I wouldn’t be surprised if Gold pushes higher and sets a new record above the 2960 zone.
Disclosure: I am part of Trade Nation's Influencer program and receive a monthly fee for using their TradingView charts in my analyses and educational articles.

Be sure to short gold!Expected profit: 150-300 pipsBros, be sure to be short gold and never miss the profits in every swing.As I said in my last article, the 2935-2945 zone is worth selling gold, and I have shorted gold in this area according to the trading plan. Have you shorted gold with me?
Although gold once rose to around 2940 under the stimulation of news, I think the accelerated rise of gold was suspected of short squeeze, and after the market calmed down, gold will return to the technical level and have a need for retracement. However, as gold breaks through the oscillation range upward, the lower support will move up to the 2920-2910 zone.
Therefore, our primary target for shorting gold in the short term is the 2920-2910 zone. If gold falls back to this area as expected, then in the short term, we will still gain 150-300 pips of profit, which is still a good return for short-term trading!
Do you think gold will fall back to the 2920-2910 zone as expected? Trading means that everything has results and everything has feedback. I have been committed to market trading and trading strategy sharing, striving to improve the winning rate of trading and maximize profits. If you want to copy trading signals to make a profit, or master independent trading skills and thinking, you can follow the channel at the bottom of the article to copy trading strategies and signals

XAUUSD Today's strategyThe current market sentiment is relatively cautious, and investors are more sensitive to gold. On the one hand, the rise of the US dollar index has made some investors pessimistic about the short-term trend of gold; on the other hand, the price of gold has broken through the 2920 resistance level, and the fluctuations in the 2930-2940 range have also made it difficult for investors to determine the direction of the market and dare not easily carry out large-scale trading operations.
Overall, on March 13, 2025, the price of gold was under the pressure of the rising dollar index, and the European market was biased to the downside. However, due to the range volatility pattern, the overall trend still needs to pay attention to the breakout of key resistance levels and support levels. Before there is a clear breakthrough, the probability will remain within the 4-hour range. In operation, you can consider selling high and buying low in the range
Sold: 2945-2950
TP: 2925-2915
Buy: 2915-2925
TP: 2935-2945-2955
In the face of the ups and downs of the K-line and the confusing market, if you are still wandering and confused, you can refer to my strategy

XAUUSD, 1H, 12/03/2025, 09/30.As explained Target achieved in Buy setup.
As we are looking for another set-up.
XAUUSD Buy Setup.

Gold’s False Breakout: A Bullish Shift in MomentumIn my analysis yesterday, I argued that once the price broke below the 2900 support zone, further downside movement was likely.
However, the price quickly recovered above this key level, prompting me to close my short trade with a minimal profit of 70 pips.
More importantly, after reclaiming 2900, Gold continued its upward movement and once again tested the 2920 resistance zone. Even more significant is the fact that the breakdown below 2900 can now be considered a false break, which could ultimately lead to a breakout above resistance.
Today, we also have U.S. inflation data, which could serve as a catalyst for such a breakout.
In conclusion, my outlook has now turned bullish, and I will look to buy on dips.
A bearish scenario would only be confirmed by another break below 2900.
As for the upside target, if 2920 is breached, we could see strong momentum this time—potentially even a new all-time high above 2955.
Disclosure: I am part of Trade Nation's Influencer program and receive a monthly fee for using their TradingView charts in my analyses and educational articles.

Gold Breaks Out – Is a Major Rally Ahead or Just a False Alarm?🌟 Gold Surges 1% as USD Weakens Amid Growing Recession Fears
💰 Market Overview
Gold continues to be a safe-haven asset, benefiting from heightened market uncertainty. However, any positive developments in the ongoing negotiations between Russia and Ukraine could lower risk premiums, potentially affecting gold’s upward momentum.
🌍 The trade policies imposed by former US President Donald Trump on key global trading partners previously caused major volatility in the global markets, fueling concerns about economic growth.
📊 Key Economic Data on the Horizon
The focus now shifts to the upcoming US inflation reports:
📅 CPI (Consumer Price Index) and PPI (Producer Price Index) are due for release on March 12 and 13.
📌 According to a Reuters poll, the CPI for February is expected to rise by 0.3%. These crucial data releases could have a significant impact on gold’s movement, making it vital for investors to remain vigilant.
📈 Technical Analysis & Trade Setup
✅ Gold has broken out of a parallel downward channel around the $2898 - $2900 range, showing a strong breakout and forming a continuation pattern (CP), surging 15-20 points afterward.
📌 The break of the bearish structure yesterday followed by the sharp rally suggests that gold still has strong buying momentum, underpinned by fundamentals favourable for both USD and gold.
📊 Key Support and Resistance Levels
📍 Major Resistance Levels: $2927 - $2944 - $2954
📍 Major Support Levels: $2899 - $2884 - $2873
📌 Trading Zones
🟢 BUY ZONE: $2884 - $2882
🔹 Stop Loss (SL): $2878
🎯 Take Profit (TP): $2888 - $2892 - $2896 - $2900 - $2906 - $2910
🔴 SELL ZONE: $2943 - $2945
🔹 Stop Loss (SL): $2949
🎯 Take Profit (TP): $2940 - $2936 - $2932 - $2928 - $2922
📢 Final Thoughts
🕵️♂️ Tonight, the crucial CPI report will be released, and it could have a significant effect on gold’s direction this week. At the moment, gold’s movement seems erratic on lower timeframes, swinging between highs and lows as the market transitions from Winter-Spring to Summer-Fall.
📌 Traders should remain cautious, waiting for a clearer trend to emerge before making more aggressive moves. Stick to your TP/SL levels to protect your capital.
Best of luck and trade safely! 🚀

XAUUSD Today's strategyRecently, the price of BTC has been fluctuating a lot. When the price of BTC goes up or down sharply, it might change how market investors feel about risky assets. This feeling could spread to the gold market, which we often refer to as XAUUSD .
And it could affect how much people want to invest in gold and the price of gold too. For instance, if BTC drops a lot because of things like market regulation, investors will lose confidence in risky assets. Then some of their money will probably flow into the XAUUSD market to play it safe, and that'll push up the price of XAUUSD.
Overall, in the short - term operation of gold today, it is recommended to focus on buying on dips and selling on rallies. Pay attention to the resistance level of 2920 - 2925 in the short - term above, and the support level of 2900 - 2905 in the short - term below.
XAUUSD sell @2920-2925
tp: 2900-2905
XAUUSD Buy @2900-2905
tp: 2915-2920
Traders, if you liked this idea or if you have your own opinion about it, write in the comments. I will be glad
If you also aspire to achieve financial freedom,Follow the link below to get my daily strategy updates

XAUUSD Today's strategyYesterday, the highest price of gold was 2922 and the lowest price was 2880. It fluctuated between $2890 and $2915
There have been sporadic exchanges of fire in the Palestinian-Israeli region, and Trump has declared that "new sanctions on Iran will not be ruled out." The uncertainty of geopolitical risks has provided support for gold prices, which has increased investors' safe-haven demand and has a certain driving effect on gold prices.
On March 12, during the Asian trading session, retail investors increased their holdings of gold by 8.2 tons through ETFs. The inflow of funds directly promoted the rebound in gold prices. However, on March 11, the net long position of COMEX gold futures decreased by 12%. Some hedge funds chose to take profits, and the long-short game between institutions and retail investors made the trend of gold prices uncertain.
From the perspective of the daily level, gold has shown the characteristics of repeated fluctuations. On March 11, the daily line closed a long negative line with a lower shadow, suggesting that the power of bears is gradually exhausted; on March 12, the price of gold successfully broke through the key resistance level of $2,900, and the short-term moving average began to turn upward. The green column in the MACD indicator continued to shorten, and there were technical signs of further gains.
Overall, the overall price of gold on March 12 showed a high and volatile trend, and there was a certain game between long and short forces. Under the combined effect of factors such as geopolitical risk uncertainty, economic stagflation concerns, and technical bullish signals, gold prices have continued to rise. However, factors such as the weakening of the Federal Reserve's interest rate cut expectations brought about by the strong US job market and the profit-taking of some institutions have suppressed prices to a certain extent. If the US CPI data released today is higher than expected and inflationary pressure further increases, it may strengthen the anti-inflationary demand of gold and drive up prices. If the data is lower than expected, it may ease the market's concerns about inflation, weaken the attractiveness of gold, and lead to a price correction
buy:2905-2910
tp:2920-2930
If you don't know how to do it, you can refer to my transaction.

Gold (XAU/USD) Technical Analysis – March 11, 2025Gold is currently trading near 2920 , showing bullish momentum after a strong recovery from recent lows. Price action suggests buyers are in control, but key levels must hold for continued upside.
🔍 Key Observations:
✅ Bullish Structure: The price has formed a bullish flag , signaling potential continuation toward liquidity above 2930.3 (swing high).
✅ Fair Value Gap (FVG) 2907 - 2900: This zone should act as support. If price stays above it, we could see bullish continuation.
✅ Bullish Order Block (OB) 2891 - 2880: If price retraces, this area could serve as a high-probability buy zone for another push higher.
📈 Key Levels to Watch:
🔹 Support Zones:
2907 - 2900 (FVG, 4H) – Ideal for bullish continuation.
2891 - 2880 (OB, 4H) – Stronger demand zone if a pullback occurs.
🔹 Resistance & Targets:
2930.3 (Swing High) – Liquidity target for buyers.
A breakout above 2930 could trigger further bullish momentum.
⚠️ Possible Scenarios:
📌 Bullish: A break above 2920-2925 could send price toward 2930+ liquidity.
📌 Bearish Pullback: A drop into 2907-2900 may present a buying opportunity before moving higher.
🛑 Final Thoughts:
The trend remains bullish , and as long as price stays above key FVG and OB zones, further upside is likely. Keep an eye on these levels for potential trade setups!

xauusd Next 28% profit signal opportunity
Short-term XAUUSD trading signal analysis shows 2882 support for long positions, with tp reaching the target of 28%.
If you don’t know when to buy or sell, please pay close attention to the real-time signal release of the trading center or leave me a message, so that you can quickly realize the joy of profit. TVC:GOLD ICMARKETS:XAUUSD FOREXCOM:XAUUSD OANDA:XAUUSD

XAUUSD, Expecting sell from 2913.3XAUUSD, I am Expecting sell from 2913.3 with lowertime frame confirmation of 1 minute with the targets of 2900 & 2885.
good luck

XAUUSD, expecting sell from 2912.5XAUUSD, i am expecting sell from 2912.5 from M15 OB + LTF confirmation with targets 2900 & 2985

XAUUSD Strategy AnalysisCurrently, the overall gold market is on the weaker side. However, we should by no means chase short positions at low levels. Instead, we should wait for a rebound and look for opportunities to trade.
Resistance levels: 2925
Support levels: 2886
I will share accurate trading strategies every day, and the accuracy rate of the trading signals reaches 90%. Click on the link below the article to obtain the accurate signals.

XAUUSD,GBPUSD and EURUSD Analysis todayHello traders, this is a complete multiple timeframe analysis of this pair. We see could find significant trading opportunities as per analysis upon price action confirmation we may take this trade. Smash the like button if you find value in this analysis and drop a comment if you have any questions or let me know which pair to cover in my next analysis.
