SCALPING ! XAU , waiting for entry SELL 2928 , TRENDLINE⭐️ Smart investment, Strong finance
⭐️ GOLDEN INFORMATION:
Richmond Fed President Thomas Barkin said Tuesday he will take a wait-and-see approach on interest rates until there's clear evidence that inflation is returning to the Fed's 2% target.
Dallas Fed President Lorie Logan suggested that, in the medium term, the Fed should focus on buying more short-term securities to better align its portfolio with Treasury issuance, according to Bloomberg.
⭐️ Personal comments NOVA:
Gold price is still moving in the H1 downtrend line, the price zone is correcting and accumulating above 2900.
⭐️ SET UP GOLD PRICE:
🔥 SELL GOLD zone: $2928 - $2930 SL $2933 scalping
TP1: $2924
TP2: $2920
TP3: $2915
⭐️ Technical analysis:
Based on technical indicators EMA 34, EMA89 and support resistance areas to set up a reasonable SELL order.
⭐️ NOTE:
Note: Nova wishes traders to manage their capital well
- take the number of lots that match your capital
- Takeprofit equal to 4-6% of capital account
- Stoplose equal to 2-3% of capital account
Xauusdsignal

XAUUSD Potentially Bearish #XAUUSD over time has seen some very good bullish run and I still hold a bias for the bullish potential however given the map market is currently showing, OANDA:XAUUSD looks potentially bearish. This may likely be for the short term with immediate targets at the 2,875 zone. Before taking the short, I will love to see this current H4 candle close as a bearish candle.
Results are not typical, do your homework and make your decision yourself, past results does not guarantee future results

EURUSD FOR SCALPERS AND DAY TRADERS **2000 POINTS **Entry price ,stoploss and Target already marked in the chart itself FYI.
Guys pls like, share and follow my ideas .
Thank You All

continue to decrease, return to price zone 2904⭐️ Smart investment, Strong finance
⭐️ GOLDEN INFORMATION:
US consumer confidence saw its biggest drop since August 2021, falling to 98.3 in February from 105.3, according to the Conference Board.
Richmond Fed President Thomas Barkin said on Tuesday that he favors a wait-and-see approach on interest rates until there is clear evidence that inflation is returning to the Fed’s 2% target.
Meanwhile, Dallas Fed President Lorie Logan suggested that, over time, the Fed should prioritize purchasing shorter-term securities to better align its portfolio with Treasury issuance, as reported by Bloomberg.
⭐️ Personal comments NOVA:
Still a downtrend today, back to the price range of 2900, 2890 to accumulate the uptrend
⭐️ SET UP GOLD PRICE:
🔥 BUY GOLD zone: $2905 - $2903 SL $2900 scalping
TP1: $2908
TP2: $2912
TP3: $2920
🔥 BUY GOLD zone: $2889 - $2887 SL $2882
TP1: $2895
TP2: $2903
TP3: $2910
🔥 SELL GOLD zone: $2946 - $2948 SL $2953
TP1: $2940
TP2: $2930
TP3: $2920
⭐️ Technical analysis:
Based on technical indicators EMA 34, EMA89 and support resistance areas to set up a reasonable SELL order.
⭐️ NOTE :
Note: Nova wishes traders to manage their capital well
- take the number of lots that match your capital
- Takeprofit equal to 4-6% of capital account
- Stoplose equal to 2-3% of capital account

XAUUSD SHORT 4H (Results)Due to inattentive study of the rules of the tradingviews platform, the trading idea was blocked
I apologize to those who used this idea in their trading system due to the blocking, I will be more careful in the future.
Result : XAUUSD SHORT 4H reaches the 2 targets zone for taking profits.
I move my stop into profit and wait for new variables from the market .

XAUUSD Is RangeBound! What's Next?In this video, I revisit my earlier analysis of gold, and my perspective from back then remains unchanged. Gold is currently range-bound and struggling to break through its recent highs. In the video, we examine price action, market structure, the trend, and other key elements of technical analysis. Previously, gold was trending with significant momentum, but that momentum has since diminished. All of this is explained in detail in the video, which is not intended as financial advice.

Head & Shoulders Pattern Forming – Gold Breakdown Soon?Gold ( OANDA:XAUUSD ) is currently near the Resistance zone($2,948-$2,940) . Gold attacked the Resistance zone($2,948-$2,940) several times but failed to break it and even created a Bull Trap .
Regarding Classical Technical Analysis , Gold seems to be completing the Head and Shoulders Pattern . If Gold reaches the Neckline of this pattern , it seems to succeed in breaking it. One of the signs of the validity of the Head and Shoulders Pattern is to see a Regular Divergence(RD-) between the two shoulders, which we see here.
According to the theory of Elliott waves , Gold seems to have succeeded in completing corrective waves. The structure of correction waves is Double Three Correction(WXY) .
I expect Gold to reach the Neckline of the Head and Shoulders Pattern in the coming hours, and if it breaks , it will drop to at least $2,901 .
Note: If Gold can go over the Resistance zone($2,948-$2,940), we can expect more pumps.
Note: If Gold touches $2,934, we can hope for a drop.
Do you think that Gold succeeds in forming a new All-Time High(ATH) or does it need to be corrected?
Be sure to follow the updated ideas.
Gold Analyze ( XAUUSD ), 30-minute time frame.
Do not forget to put Stop loss for your positions (For every position you want to open).
Please follow your strategy; this is just my idea, and I will gladly see your ideas in this post.
Please do not forget the ✅' like '✅ button 🙏😊 & Share it with your friends; thanks, and Trade safe.

XAUUSD (GOLD) TRADE PLAN 25/2/2025
1. XAU/USD presents a compelling sell opportunity as price action suggests a potential downside move.
2. Technical indicators signal bearish momentum, with resistance levels holding firm.
3. Macroeconomic factors favor a stronger USD, pressuring gold prices lower.
4. A downward trajectory could target the 2900 level, aligning with historical support zones.
5. Rising bond yields and hawkish Fed policies add to gold’s downside risk.
6. Failure to breach key resistance zones reinforces the bearish outlook.
7. Market sentiment leans risk-on, reducing gold’s safe-haven appeal.
8. A break below critical support levels may accelerate selling pressure.
9. Short positions may benefit from volatility, with disciplined risk management.
10. Traders eye 2900 as a strategic target, capitalizing on gold’s potential correction.

Gold Bulls Beware: Is the Market Ready for a Pullback? Since the beginning of the year, Gold has closed every week in the green, with the last four weeks marking all-time highs.
However, not even trees grow to the sky—let alone gold. 🌳✨
Looking at the posted chart, we can see that despite reaching ATHs and trading above 2900 over the past three weeks, the price has consistently reversed sharply from those highs. This suggests that a correction is becoming increasingly likely.
Yesterday's ATH was only about 20 pips higher than the previous one, and once again, the price quickly reversed. At the time of writing, Gold is trading at 2936, hovering near a critical confluence support level.
If the confluence support breaks, traders should anticipate a deeper correction, with an initial target around 2880 and a potential move toward 2850.
I'm bearish on Gold, but I’m waiting for further confirmation before initiating sell trades. 📉🔍
Disclosure: I am part of Trade Nation's Influencer program and receive a monthly fee for using their TradingView charts in my analyses and educational articles.

GOLD (XAU/USD) AnalysisTechnically I am Buying Gold. The reason I am in a buy position is due to Liquidity sweep and Market Structure Shift.
You guys can manage your risk accordingly.

Gold is due for a fallGold is due to retest 2914 late this week. Macro drivers have subsided. As of yet, there have been no tangible effects of the Trump tariffs or government reductions in the real economy. As for the dollar, while it is still strong, volatility is down. Markets are settling in to wait and see the effects of the Trump presidency. For this week, given the relatively light macro docket this, gold bulls are going to be less aggressive, while bears will see an opportunity to push prices lower. Also gold has been in a range for the last two weeks and sits in the upper part of that range. And the average range of Gold has been falling for the last five sessions. Price will retest the lower part of this range down to 2914.

XAUUSD Breakout or Pullback? Planning for My Next Move!👀 👉 XAUUSD is currently moving sideways within a range. I’m watching for a potential buying opportunity if it breaks above the range high or pulls back to a key support level. In the video, we discuss how price action might develop and what to watch for when identifying trade opportunities. Here, I’m sharing my trading plan and my approach to analyzing price action, market structure, and trends to spot potential setups. 🚨 Not financial advice.

XAUUSD H1 [24.02.25]: Technical Overview!📈 BUY_GOLD: 2933/2935
Stoploss: 2930 / Target: 2955
📉 SELL_GOLD: 2957/2959
Stoploss: 2962 / Target: 2947
Analysis: Gold has found support at the 50-4H SMA (2920) multiple times and needs a sustained move above the 21-4H SMA (2935) to extend its rally.
The RSI, near 60, suggests further upside potential.
A decisive break above 2935 could lead to a retest of the 2955 high, with 2970 as the next resistance.

Gold Pauses After Record High – Key Support and Resistance LevelAfter reaching a new all-time high on Thursday, Gold has entered a consolidation phase again, fluctuating within a range of 2,920 to 2,940. This period of consolidation suggests that the market is pausing before deciding on its next move.
The overall trend remains bullish as long as the 2,920 support level holds. A decisive breakout above 2,940 could signal renewed upward momentum, potentially leading to a fresh all-time high.
However, if gold breaks below 2,920, it could trigger a deeper correction, with the next significant support level around the 2,850 zone. In this scenario, sellers may gain temporary control, pushing prices lower before the market finds stability.
Disclosure: I am part of Trade Nation's Influencer program and receive a monthly fee for using their TradingView charts in my analyses and educational articles.

GOLD Bullish Breakout!
HI,Traders !
GOLD is trading in an
Uptrend and the price
Broke out of the bullish
Wedge pattern and the
Breakout is confirmed
So we bullish biased
And we will be expecting
A further move up!
Comment and subscribe to help us grow !

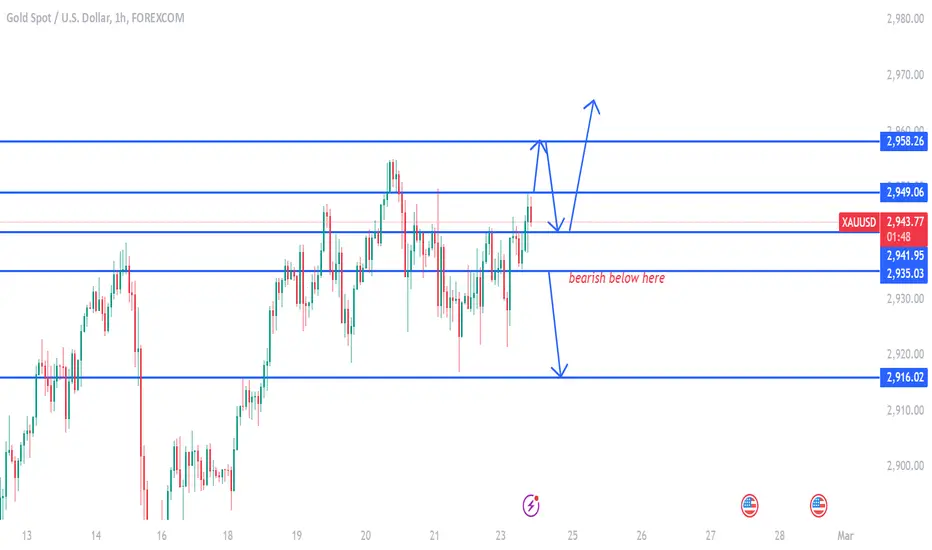
gold on bullish rejection above 2958#XAUUSD has repeatedly faced rejection above the 2949 level, forming a strong bearish zone. Currently, the market awaits a decisive breakout.
A breakout above 2949 could trigger a bullish toward the next decline zone at 2958, where profit-taking may occur. However, a pullback to 2942 is expected before further bullish continuation.
If the price fails to sustain above 2949 and drops below 2935, strong selling pressure could push toward 2916, indicating a deeper bearish trend.
XAUUSD ANALYSISThis is my view for XAUUSD for the upcoming weeks untill the below trendline is not broken with a bearish closing below that mark.

XAUUSD set for 300 pip plus drop?There is gap open in XAUUSD we may see potential drop as the market trend is exhausted and could continue to drop to weekly support level for deeper liquidity grab. From weekly perspective we can see XAUUSD is over extended toward the upside and we may see deeper pull back or a short term versal in the trend.
Waiting on a possible entry to the sell positions.!!

Gold (XAU/USD) ForecastXAUUSD (GOLD Update)
Price is trading in the mid-range level, expecting a sell-off in it onto the marked demand zone in the chart.

XAUUSD/GOLD WEEKLY BUY PROJECTION 23.02.25Readings between 55 & 80 indicate Bullish condition. Readings between 45 & 55 indicate Neutral condition. Readings between 20 & 45 indicate Bearish condition. Readings below 20 indicate a security is oversold.

Gold trading zones: 21-Feb-2025Daily Gold trading zones: Identifying potential opportunities for informed traders.

0217-0221 GOLD WEEKLY OUTLOOKHello traders,
When events develop in an illogical manner, emotions and manipulation are often the first two factors to consider.
1. The "illogical" phenomenon behind last Friday's U.S. stock market surge
Last night, U.S. stocks experienced a significant rally despite lacking fundamental support. However, from the perspective of economic data and market dynamics, this surge appears to lack rationality.
1. Inflationary pressures are significantly increasing
In January, the Producer Price Index (PPI) inflation rate unexpectedly rose to 3.5% (higher than the expected 3.2%), while the core PPI inflation rate reached 3.6% (higher than the expected 3.3%).
This marks the highest PPI inflation rate since February 2023. More importantly, this data confirms that the previous 0.5% month-on-month increase in CPI was not due to seasonal factors but rather a reflection of persistent inflationary pressures.
2. Employment data indicates an overheated economy
Last week, initial jobless claims came in at 213K, lower than the expected 216K, while continuing claims reached 1850K, below the expected 1882K.
This demonstrates that the labor market remains strong, and the "hot" employment data further reinforces concerns about an overheating economy.
3. Rate cut expectations are delayed
With CPI, PPI, and employment data all exceeding expectations, the Federal Reserve's rate cut expectations have been pushed further back. Currently, the market generally anticipates the earliest rate cuts to occur in September 2025.
Even worse, if the Fed's core Personal Consumption Expenditures (PCE) data, which is expected to be released today, also shows an increase, the market may reprice rate hike expectations. The two-year U.S. Treasury yield has already broken out of its symmetrical triangle, with technical analysis suggesting its next target could be 5%, further strengthening expectations that the Fed may resume rate hikes instead of continuing to cut rates.
4. Liquidity is shrinking
On Thursday (February 13), the Federal Reserve's overnight reverse repurchase agreement (RRP) usage dropped to $67.82 billion, the lowest level since April 2021, indicating that market liquidity is rapidly contracting.
From this data, it is evident that U.S. stocks lack fundamental support for their rally. However, under such circumstances, the significant rise in U.S. stocks raises questions about whether emotional trading and market manipulation are at play.
---
2. Crowded markets: Risk appetite reaches extremes
Scott Rubner, Managing Director and Tactical Expert at Goldman Sachs Global Markets, published a report following last night's U.S. stock market rally, bluntly stating that this is his final bullish email on U.S. stocks for this quarter. He pointed out:
> “Everyone is in this pool, including retail investors, 401(k) retirement fund inflows, beginning-of-year fund allocations, and corporations. The dynamics of fund flow demand are rapidly changing, and negative seasonality is approaching.”
This suggests that the market is already too crowded, and the momentum for buying on dips is rapidly diminishing. The following data further confirms the extreme crowding in the market:
1. Assets in leveraged long equity ETFs reached a record high of $95 billion last week, compared to $67.6 billion during the stock market frenzy of 2021.
2. Since the third quarter of 2022, the total assets of funds using derivatives for long bets have tripled.
3. Assets in leveraged short equity ETFs decreased by $13.3 billion, falling to $8.5 billion. In other words, for every $1 in leveraged short ETFs, there is a record $11 in leveraged long ETFs.
The level of crowding in market trading has reached an extreme, or even "crazy," state. This extreme risk appetite has planted hidden risks for the future trajectory of the market.
---
3. Why did gold pull back?
In such an extreme market environment for U.S. stocks, gold, as a safe-haven asset, failed to reach new highs last Friday and instead retreated. The reasons behind this phenomenon mainly include the following:
1. A stronger U.S. dollar
Due to rising expectations that the Fed may resume rate hikes, the U.S. Dollar Index saw a significant rebound last Friday. Gold prices typically have a negative correlation with the dollar, and a stronger dollar directly suppressed gold's upward momentum.
2. Rising real interest rates
The upward movement in the two-year U.S. Treasury yield and the market's repricing of the Fed's monetary policy caused real interest rates to rise. Gold, as a non-yielding asset, is highly sensitive to real interest rates. Rising real interest rates weaken gold's appeal.
3. Market sentiment shifting toward risk assets
Despite the market's uncertainties, the strong performance of U.S. stocks attracted substantial capital inflows into risk assets. Increased risk appetite among investors reduced demand for safe-haven assets like gold.
4. Technical resistance
From a technical analysis perspective, gold faced significant resistance near its previous highs. Profit-taking by bulls further exacerbated gold's pullback.
---
4. Technical Analysis
Weekly Chart
It is evident that gold has entered a period of consolidation near its top. Last week closed with a bearish candle, forming a multi-candle evening star pattern on the weekly chart, which is a bearish reversal signal. For the upcoming week, the trading strategy will focus on identifying short opportunities on lower timeframes.
Four-Hour Chart
The five-wave structure appears to have ended, with the final wave reaching higher and broader levels than previously anticipated.
Considering the gradual formation of a top structure, next week's trading plan will focus on short opportunities below the four-hour EMA.
---
GOOD LUCK!
LESS IS MORE!

GOLD Bullish Bias!HI,Traders !
GOLD is trading along the
Rising support line
In a strong uptrend
And the is about to
Retest the support line from
Where we will be expecting a
Further local move up !
Comment and subscribe to help us grow !
