Gold’s Wild Ride: From Record Highs to Sudden Sell-OffsLast week was highly volatile for Gold prices.
After reaching a new all-time high on Tuesday, the price dropped sharply by approximately 800 pips. However, it began recovering on Thursday and climbed back to the 2940 zone on Friday.
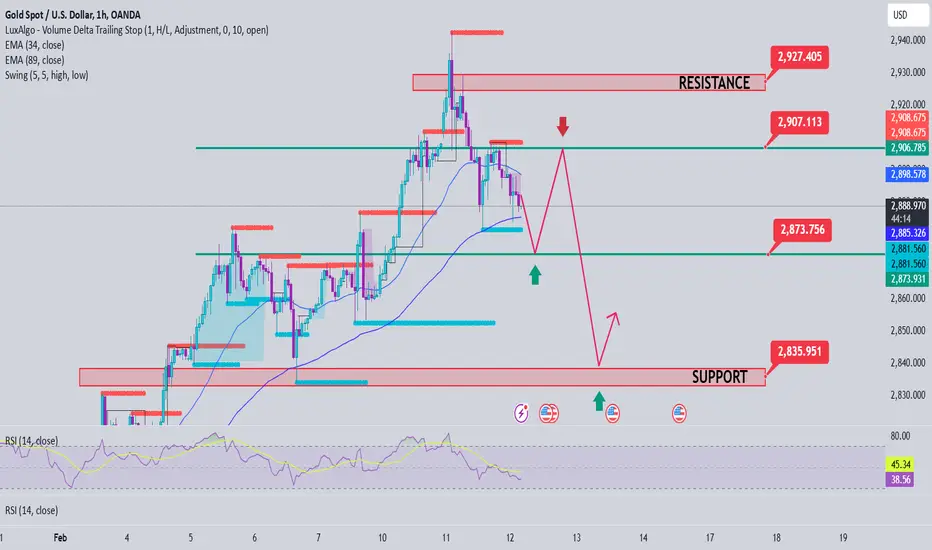
In the final hours of trading, Gold experienced another sharp decline, closing the week exactly at the 2880 support level.
These repeated sell-offs from the all-time high suggest that a deeper correction may be underway, potentially confirming a double-top pattern. If this scenario unfolds, the measured target for the drop could be around 2820.
With this in mind, I will look to sell rallies against the recent 2940 all-time high.
Disclosure: I am part of Trade Nation's Influencer program and receive a monthly fee for using their TradingView charts in my analyses and educational articles.
Xauusdsignal

XAUUSD: $3100 is the next target, Get Ready For the Big Move!Gold is currently making a small correction and looking at how the price is behaved. We are expecting how the price is likely to develop next. Use accurate risk management.

XAUUSD Top-down analysis Hello traders, this is a complete multiple timeframe analysis of this pair. We see could find significant trading opportunities as per analysis upon price action confirmation we may take this trade. Smash the like button if you find value in this analysis and drop a comment if you have any questions or let me know which pair to cover in my next analysis.

Gold at PRZ—Will Bears Take Over Soon!?Today, U.S. Retail Sales data will be released:
Core Retail Sales (Forecast: 0.4%) → If lower than expected, it may indicate weaker consumer spending, potentially weakening the USD ( TVC:DXY ).
Retail Sales (Forecast: 0.4%) → A lower-than-expected reading would signal economic weakness and increase expectations for Fed rate cuts.
Given recent economic trends and previous reports like CPI (inflation) and PPI (producer inflation) coming in higher than expected, retail sales data is more likely to be stronger than forecasted or at least in line with expectations.
Potential Market Impact : If the data is stronger than expected : USD strengthens → Gold declines .
There is a slightly higher probability that the data will be stronger than expected (or in line with forecasts). However, if the data disappoints , the market could react sharply .
If the indexes are close to or match the forecasts, there will be less expectation of emotional market movement.
--------------------------------------------------
Gold ( OANDA:XAUUSD ) started to rise, as I expected in the previous post . Currently, Gold is near the Potential Reversal Zone(PRZ) , the upper line of the Ascending Channel , Monthly Resistance(2) , and Yearly Resistance(1) .
According to the theory of Elliott waves , Gold seems to be completing microwave 5 of the main wave 5 . One of the confirmation signs of the end of wave 5 can be the breaking of the lower line of the ascending channel .
Also, we can see the Regular Divergence(RD-) between Consecutive Peaks .
I expect Gold to go down to at least $2,920 first after breaking the lower line of the ascending channel, and if the Support zone($2,915-$2,905) is broken, we should wait for an attack on the 100_SMA(1-hour) and the Support line .
Note: If Gold breaks the Potential Reversal Zone(PRZ) , we can expect more pumps.
Be sure to follow the updated ideas.
Gold Analyze ( XAUUSD ), 15-minute time frame.
Do not forget to put Stop loss for your positions (For every position you want to open).
Please follow your strategy; this is just my idea, and I will gladly see your ideas in this post.
Please do not forget the ✅' like '✅ button 🙏😊 & Share it with your friends; thanks, and Trade safe.

GOLD Rising Channel!
HI,Traders !
GOLD is trading in an
Uptrend in a rising channel
And Now trying to break the
Key horizontal level of 2915.89
So If the breakout is confirmed
Then we will be expecting
A further move up !
Comment and subscribe to help us grow !

XAUUSD: A new Bias On Gold, What you all think?Dear Traders,
Our last two Gold Setups did not work out in our favour, and that is why we had to rethink about our bias. Now we expect a continuous growth in gold prices as we expected changes in government policies.
Show support by liking and commenting our ideas that will means a lot to us!
Thank you

Gold continues to maintain sideways below 294x, accumulating⭐️ Smart investment, Strong finance
⭐️ GOLDEN INFORMATION:
Gold price (XAU/USD) continues to climb during Friday’s Asian session, supported by concerns over US President Donald Trump’s tariff plans and a drop in US bond yields.
However, expectations that the Federal Reserve (Fed) will maintain its hawkish stance and keep interest rates high could limit further gains for the non-yielding metal. Traders are now focused on the upcoming US Retail Sales data for January, set to be released later in the day.
⭐️ Personal comments NOVA:
The uptrend is still going on, however profit-taking selling pressure still exists around 294x, gold will still accumulate around 2900 or more.
⭐️ SET UP GOLD PRICE:
🔥 SELL GOLD zone: $2942 - $2944 SL $2949
TP1: $2935
TP2: $2927
TP3: $2920
🔥 BUY GOLD zone: $2903 - $2905 SL $2898
TP1: $2912
TP2: $2920
TP3: $2930
⭐️ Technical analysis:
Based on technical indicators EMA 34, EMA89 and support resistance areas to set up a reasonable SELL order.
⭐️ NOTE:
Note: Nova wishes traders to manage their capital well
- take the number of lots that match your capital
- Takeprofit equal to 4-6% of capital account
- Stoplose equal to 2-3% of capital account

XAUUSD "GOLD" POTENTIALLY BULLISHWe have seen OANDA:XAUUSD continue in the strong bullish rush creating higher highs and higher lows along the line. In the most recent time, price broke out on the most recent high (2,883.097) and not only found it as a support zone but also gave a price action candle showing some rejection of same zone.
My take, if this current H4 candle closes as a bullish candle in the next few hours, I will be going long with my first targets at 2,935 and then ride the move with a "breath-able" trailing stop
Disclaimer: Past results does not guarantee future results, trading instruments like gold is high risk

Gold's Bear Trap—Ready for a Bullish Breakout?Today’s US inflation data came in hotter than expected, reinforcing concerns about persistent price pressures. Core CPI rose 0.4% (vs. 0.3% expected ), while headline CPI jumped 0.5% (vs. 0.3% expected ). Annual inflation also exceeded forecasts at 3.0%. In his speech , Fed Chair Powell signaled no urgency in cutting rates, further strengthening the US dollar ( TVC:DXY ).
According to the published US indexes , Gold ( OANDA:XAUUSD ) suddenly fell but started to rise again from the Support line and created a Bear Trap .
Educational Tip : Basically, after every Bull or Bear Trap , the market moves against the created Trap.
Gold is moving near the Support zone($2,889-$2,878) , 100_SMA(1-hour) and has managed to break the Resistance line , any pullback can be a good opportunity for us to take a Long position . Of course, you can enter the position in another way ( be sure to follow the capital management ).
According to Elliott's wave theory , Gold seems to have completed the Double Three Correction(WXY) . One of the signs of completion can be the breaking of the resistance line .
I expect Gold to attack the Resistance zone($2,915-$2,905) in the coming hours .
Note: If Gold breaks the Support zone($2,889-$2,878), we should expect more fall and break the support line. Especially if Gold goes below $2,863.
Be sure to follow the updated ideas.
Gold Analyze ( XAUUSD ), 15-minute time frame.
Do not forget to put Stop loss for your positions (For every position you want to open).
Please follow your strategy; this is just my idea, and I will gladly see your ideas in this post.
Please do not forget the ✅' like '✅ button 🙏😊 & Share it with your friends; thanks, and Trade safe.

Stick to shorting goldDear Traders,
As I clearly mentioned in my previous post, we could short gold in the 2920-2930 resistance zone, and as expected, gold retraced to the target zone I anticipated: 2910-2900. Our short position thus yielded a significant profit.
Currently, gold has bounced off the 2910-2900 support zone and has moved back up to around 2920. However, gold has been repeatedly rejected near 2920 and has not broken higher, confirming that the 2920-2930 zone is providing effective resistance. From a technical perspective, if gold forms a triple top pattern at this level, it could likely experience another downward correction and retest the 2910-2900 support zone.
Therefore, for short-term trading, we can continue to short gold at the 2920-2930 resistance zone.Bros, do you have the courage to short gold with me? If you want to learn more detailed trading ideas and get more trading signals, you can choose to join the channel at the bottom of the article to make trading no longer difficult and make making money a pleasure!

Gold to $3,000? Key Levels to Watch-XAU/USD AnalysisGold has been on a tear lately, pushing up towards $2,942, and the big question now is: Do we see a pullback, or is $3,000+ on the horizon?
Here’s what I’m watching:
🔹 $2,942 – Key resistance level. If we break above, momentum could take us straight to $3,000.
🔹 $2,875 – A potential pullback zone where buyers might step in before another leg up.
Markets are moving fast, and this could get interesting. Are you bullish or bearish on gold right now? Drop your thoughts below! 👇
Kris/Mindbloome Exchange
Trade Smarter Live Better

XAUUSD - Possible Long Trade?Here is our quick view and update on XAUUSD . Potential opportunities and what to look out for. This is a quick overview on the pair.
XAUUSD is currently trading at around 2900s .
As the price on XAUUSD has failed to break below 2880 , we are still overall bullish on OANDA:XAUUSD and due to this reason, and yesterdays news and statements, we are looking for further buys on the pair. Possible buys from this smaller KL (Key Level) at around 2908 with potential 2950 as a new ATH (All Time High) for our target. Stops would be around 2892 . Keep in mind we might get deeper pullbacks and further buys. This trade is only valid if we stay above 2910 .
PARAMETERS
- Entry: 2908
- SL: 2892
- TP: 2950
Personal opinion:
XAUUSD has tried to break below 2880 and failed. Due to this reason from a TA (Technical Analysis) point of view, we are still bullish on gold. Golds drop yesterday was also faded out due to inflation. As Powell was speaking and said that the Fed is in no rush to cut rates faster.
KEY NOTES
- XAUUSD failed to break below 2880.
- Breaks below 2892 would result in deeper pullbacks.
- XAUUSD remains bullish.
Happy trading!
FxPocket

XAUUSD TODAY'S MAPPING IS HERE Hello Guy's Welcome To Another Day Of TRADING
Here we are mapping chart of XAUUSD ( GOLD ) in 15-M TF
Ascending triangle pattern: Trendlines indicating higher lows and a horizontal resistance level.
Breakout and retest: The price has broken above the resistance and appears to be retesting the breakout level.
Trade setup:
Entry Level: Near the breakout retest point.
Take-profit: Near 2951
Stop-loss: Around 2900
This analysis indicates a bullish sentiment, expecting gold to rise further if the breakout holds.

Gold- Is the correction over?Yesterday, gold dipped to a low of 2864; however, this drop was quickly reversed as bulls took control, pushing the price back above 2900. This raises the question: is the correction over?
The daily candle formed a Pin Bar, which could be a strong indication that the correction has ended.
Currently, the price is trading around 2913, with the key support level for bulls at the 2890 zone . As long as the price remains above this level, we can expect the uptrend to continue, potentially leading to a new all-time high.
Disclosure: I am part of Trade Nation's Influencer program and receive a monthly fee for using their TradingView charts in my analysis.

Gold Alert: Testing 2881 Risk Zone!Gold at a Crossroads: Awaiting Key Triggers
XAUUSD is navigating a critical juncture, testing a pivotal risk zone that could dictate its next major move. From this level, we either witness a trend continuation or a deeper corrective phase.
Key Drivers: CPI Data & Policy Uncertainty
All eyes are on the upcoming US CPI report, which could inject fresh momentum into the market. Inflation figures will play a decisive role in shaping expectations for the Federal Reserve’s next steps, influencing both gold and the broader financial landscape.
Meanwhile, geopolitical and economic uncertainties add complexity. The Wall Street Journal reports that the Biden administration is preparing new tariffs, which could introduce fresh volatility and global economic risks. At the same time, Fed Chair Jerome Powell has signaled a cautious stance, reinforcing expectations of only a single rate cut in July. This has pushed bond yields higher, creating additional headwinds for gold.
Technical Outlook: Key Levels to Watch
Resistance: 2898, 2910, 2929
Support: 2881, 2870, 2855
Potential Scenarios:
🔹 Bullish Case: A false break below 2881 could signal ongoing bullish momentum. If buyers defend the 2881 – 2885 zone, gold may stage a rally towards 2930 – 2950 in the short to medium term.
🔹 Bearish Case: A decisive break and consolidation below 2881 could trigger a wave of liquidation, driving prices lower towards 2855 – 2848.
Market Sentiment: A Stalemate Before the Storm
With crucial news ahead, the market is at a tipping point. Whether gold surges or sinks depends on inflation data, Fed policy clarity, and potential tariff developments. Traders should brace for volatility as these catalysts unfold.

Gold Price Analysis February 12⭐️Fundamental Analysis
Asian and European traders were cautious ahead of Fed Chairman Jerome Powell's remarks to Congress. Powell said he was in no rush to adjust monetary policy and wanted to see more progress on inflation, saying the economy was in a "pretty good place." His remarks helped stabilize financial markets, helping Wall Street trim losses and the dollar recover.
Powell will continue his testimony on Wednesday, and investors are also awaiting January CPI data, which is forecast to have risen 2.9% year-on-year, with core annual growth of around 3.1%.
⭐️Technical Analysis
Gold is accepting the 2941 area as a top, and the decline has created quite clear structures. 2873-2871 is an important support zone in pushing gold prices to increase again. If gold prices cannot close the h4 candle above 2890, it will be considered a confirmation of a dow breakout and a downtrend wave that can extend to 2833. In the direction of gold going up again, 2807 and 2827 will be the zones that the SELL side will pay attention to in order to participate in the market.
GOLD Potential Short!
HI,Traders !
GOLD is going up now
But will soon hit
A horizontal resistance
Of 2909.51from where
We will be expecting
A local bearish correction !
Comment and subscribe to help us grow !

Gold Buy Limit OrderHey everyone.
I want to use this area as my entry point, As its SL is so tight, so please consider the Risk Management.
Dear traders, please support my ideas with your likes and comments to motivate me to publish more signals and analysis for you.
Best Regards
Navid Nazarian

XAUUSD-CPI AnalysisOn H4 Gold has respected the the trend line multiple time, but it has beak the line it will retest plus there is also CPI today so we can see bearish move till level 2865, we can plan entries

Accumulated below 2900, in early uptrend⭐️ Smart investment, Strong finance
⭐️ GOLDEN INFORMATION:
Gold price (XAU/USD) remains under slight pressure for the second consecutive day but holds steady just below $2,900 during the Asian session on Wednesday. A modest uptick in the US Dollar, following Fed Chair Jerome Powell’s hawkish remarks, weighs on the metal. However, concerns over the economic impact of President Donald Trump's trade tariffs and rising global trade tensions continue to support gold’s safe-haven appeal.
Investors remain cautious ahead of the latest US consumer inflation data, set for release later today. This key report will shape expectations around the Fed's rate-cut trajectory, influencing USD demand and gold's next directional move. Despite Tuesday’s sharp pullback from the $2,942-2,943 region, uncertainty surrounding Trump’s policies suggests caution before betting on further declines or a new record high.
⭐️ Personal comments NOVA:
Moving stably around 2900, gold accumulates and waits for an opportunity to continue increasing in price. The US tariff situation is still very tense.
⭐️ SET UP GOLD PRICE:
🔥 SELL GOLD zone: $2942 - $2944 SL $2949
TP1: $2935
TP2: $2922
TP3: $2910
🔥 BUY GOLD zone: $2835 - $2837 SL $2830
TP1: $2842
TP2: $2850
TP3: $2860
⭐️ Technical analysis:
Based on technical indicators EMA 34, EMA89 and support resistance areas to set up a reasonable BUY order.
⭐️ NOTE:
Note: Nova wishes traders to manage their capital well
- take the number of lots that match your capital
- Takeprofit equal to 4-6% of capital account
- Stoplose equal to 2-3% of capital account

GOLD (XAU/USD) AnalysisGold technically takes support from its demand area, creating a bullish scenario.
Currently, I am planning a Buy/Long position in it. you guys can take the trade according to your funds and risk.
OANDA:XAUUSD

Scenario on XAUUSD 12.2.2025 if I were to take a long on gold, from the first marked sfp which is at the price of 2877 to short, I would take an sfp around the level of 2940

GOLD Bearish Bias!
HI,Traders !
GOLD broke both the
Rising and horizontal
Support line which are
Now resistance areas
And the breakout is
Confirmed so we are
Bearish biased and we
Will be expecting a
Further bearish move down !
Comment and subscribe to help us grow !
