Gold’s Price Action: New Highs or Correction Ahead?Yesterday, gold reached yet another all-time high, slightly above 2,880.
However, the price quickly dropped by 200 pips, finding support at 2,660.
Since then, gold has been consolidating, but a correction appears to be looming.
In the posted 30-minute chart, we can see a small head-and-shoulders pattern forming.
A break below the newly established support and the neckline of the pattern could lead to a further drop to 2,640.
Although trading at this stage is extremely risky, I believe gold is more likely to correct at this point rather than make a new ATH.
Xauusdsignal

GOLD Bullish Bias!
HI,Traders !
GOLD is trading along the
Rising support line
In a strong uptrend
And the is about to
Retest the support line from
Where we will be expecting a
Further local move up !
Comment and subscribe to help us grow !

ADP - NF ! News to help gold price reach next new ATH⭐️ Smart investment, Strong finance
⭐️ GOLDEN INFORMATION:
Gold prices surge, supported by declining US yields. Real yields, measured by the 10-year Treasury Inflation-Protected Securities (TIPS), drop nearly six basis points from 2.13% to 2.072%, while the US 10-year Treasury bond yield slips four bps to 4.51%. Meanwhile, the latest JOLTS report reveals a slowdown in job openings, signaling labor market strength. Openings fell to 7.6 million in December, down from November’s 8.156 million and below the expected 8 million.
⭐️ Personal comments NOVA:
Gold is setting consecutive ATHs, FOMO has not stopped yet, waiting for new ATH with today's ADP-NF results
⭐️ SET UP GOLD PRICE:
🔥 SELL GOLD zone: $2858 - $2860 SL $2863 scalping
TP1: $2855
TP2: $2850
TP3: $2845
🔥 SELL GOLD zone: $2879 - $2881 SL $2886
TP1: $2870
TP2: $2860
TP3: $2850
🔥 BUY GOLD zone: $2807 - $2809 SL $2802
TP1: $2815
TP2: $2822
TP3: $2830
⭐️ Technical analysis:
Based on technical indicators EMA 34, EMA89 and support resistance areas to set up a reasonable BUY order.
⭐️ NOTE:
Note: Nova wishes traders to manage their capital well
- take the number of lots that match your capital
- Takeprofit equal to 4-6% of capital account
- Stoplose equal to 2-3% of capital account

GOLD Long From Rising Support!
HI,Traders !
GOLD is still trading in an upward direction
in an ascending price channel and the price
has hit a possible upper channel limit
A correction to the lower channel limit
that formed with horizontal support at 2789.06
a price cluster from which we expect an
upward rebound to form a new peak !
Comment and subscribe to help us grow !

XAU/USD may fall to 2861 - 2856Preference:
Short positions below 2871.63 with targets at 2861 and 2856 in extension.
Entry: 2871.63
Stoploss: 2874
TP1: 2861
TP2: 2856

Gold Hits New ATH – How Much Higher Can It Go?In yesterday's XAU/USD analysis, I mentioned that a correction could occur, potentially bringing Gold down to the 2770 zone.
I even opened a trade based on this idea.
However, after an initial drop to the 2810 zone, Gold reversed and surged to a new all-time high.
Fortunately, I had not entered a large-volume trade, and with active management throughout the day, I kept my losses minimal.
Now, the key question is: How much higher can Gold go?
Looking at the chart, as I previously explained, Gold has been steadily rising within an ascending channel.
Yesterday, it even broke above the channel’s resistance, and at the time of writing, it is trading at 2860.
In my opinion, buying at this price carries too much risk.
I prefer to wait for a blow-off top and signs of weakness before considering a sell trade.
For now, I am staying out of the Gold market.

Is XAUUSD Gold Overextended? Key Levels to Watch PLUS Trade Idea👀 👉 In this video, we take a detailed look at XAUUSD (Gold). Although the higher timeframe shows a bullish trend, the price is currently trading into resistance and appears overextended. On the four-hour chart, there’s a bearish break in structure. My overall bias remains bullish, but I’m waiting for a break above the current high, followed by a retest and rejection, before considering an entry. This is not financial advice.

Gold entered into a bearish structureHello Traders
In This Chart GOLD HOURLY Forex Forecast By FOREX PLANET
today Gold analysis 👆
🟢This Chart includes_ (GOLD market update)
🟢What is The Next Opportunity on GOLD Market
🟢how to Enter to the Valid Entry With Assurance Profit
This CHART is For Trader's that Want to Improve Their Technical Analysis Skills and Their Trading By Understanding How To Analyze The Market Using Multiple Timeframes and Understanding The Bigger Picture on the Charts

price trend up - waiting for ATH 2843⭐️ Smart investment, Strong finance
⭐️ GOLDEN INFORMATION:
The US 10-year Treasury yield declines by 1.5 basis points to 4.537%, while real yields, measured by 10-year TIPS, remain steady at 2.095%. Meanwhile, the ISM Manufacturing PMI for January climbs to 50.9, exceeding expectations of 49.8 and improving from December’s 49.2, signaling stronger business activity. A deeper look into the data reveals rising input costs, with the prices paid sub-index increasing from 52.5 to 54.9. Additionally, the employment index jumps from 45.4 in December to 50.3, indicating improved labor conditions in the sector.
⭐️ Personal comments NOVA:
Gold price is maintaining above $2800, long-term uptrend, fomo from the market creating ATH has not stopped
⭐️ SET UP GOLD PRICE:
🔥 SELL GOLD zone: $2843 - $2845 SL $2850
TP1: $2838
TP2: $2830
TP3: $2820
🔥 SELL GOLD zone: $2829 - $2831 SL $2834 scalping
TP1: $2824
TP2: $2818
TP3: $2810
🔥 BUY GOLD zone: $2772 - $2770 SL $2765
TP1: $2780
TP2: $2790
TP3: $2800
⭐️Technical analysis:
Based on technical indicators EMA 34, EMA89 and support resistance areas to set up a reasonable BUY order.
⭐️ NOTE :
Note: Nova wishes traders to manage their capital well
- take the number of lots that match your capital
- Takeprofit equal to 4-6% of capital account
- Stoplose equal to 2-3% of capital account

Gold could start a correctionYesterday, after an intraday correction during the Asian session, OANDA:XAUUSD bulls regained control and pushed the price to a new all-time high of 2830.
Since the start of the year, gold has been trading within a tight ascending channel.
Given that the price touched the upper boundary of this channel yesterday, a test of the lower boundary could be expected next.
At the time of writing, the price is hovering around minor support, and a break below this level could expose the 2770 zone.
Despite the strong uptrend, my strategy is to sell into rallies—though this approach carries significant risk.
A new all-time high would invalidate this scenario.

gold on price retracement#XAUUSD on new ATH 2830.4, now another new high can form but price needs to touch 2825.5 for the candle to be bullish, but first breakout below 2815 is sell confirmation, TP 2798.5-2792, SL 2825.5. Above 2825.5 holds 2 movement sell retrace or new high loading.

Short gold when it hits 2820-2830 areaDear traders, gold has shown exceptional strength after breaking through the 2800 level, with aggressive buying flows providing strong support while simultaneously limiting downside retracements. Based on the current gold market structure, there remains upside potential, with prices likely to revisit the 2620-2630 range.
However, market sentiment currently plays a more dominant role than technical factors. As strong buying pressure fuels a short squeeze rally, a shift in sentiment could lead to the formation of a high wave candle on the chart, with gold potentially retesting the 2800-2790 support zone.
Given these conditions, I do not advocate chasing long positions at current levels for short-term trades. Instead, a more prudent approach would be to consider initiating long positions if gold retraces to the 2800-2790 support and holds above it. Conversely, if prices reach the 2620-2630 region, we can look for opportunities to short gold again.
Bros, do you still have the courage to short gold? If you want to learn more detailed trading ideas and get more trading signals, you can choose to join the channel at the bottom of the article to make trading no longer difficult and make making money a pleasure!

GOLD Growth Ahead!
HI,Traders !
GOLD It is trading in an uptrend and
has rebounded is about to
Retest the support
Of 2790.71 and from there
We will be expecting a
Local bullish rebound !
Comment and subscribe to help us grow !

Will Economic Data Push Gold to New ATH or Cause a Reversal?Yesterday, the Federal Reserve announced the Funding Rate , and Jerome Powell's speech followed. These events created market volatility, influencing traders’ sentiment towards gold. Now, we turn our attention to today's key economic data releases .
Today's Key Data Releases & Gold Impact :
Advance GDP : The reported 2.3% is weaker than expected (2.7%), which may create mild support for gold as it signals slower economic growth. A stronger GDP reading would have strengthened the USD, putting downward pressure on gold.
Unemployment Claims : The 207K claims are better than expected (224K), suggesting a strong labor market, which may limit gold’s upside as the USD gains strength.
Advance GDP Price Index : The reported 2.2% inflation is lower than the expected 2.5%, which could reduce gold’s appeal, as it suggests easing inflationary pressure.
Given today’s key economic data, gold is likely to face downward pressure due to stronger labor market data and lower inflation, although the weaker GDP might provide some support in the short term. Expect volatility based on the combination of GDP growth and inflation trends.
------------------------------------
Gold ( OANDA:XAUUSD ) is approaching its Potential Reversal Zone(PRZ) and All-Time High(ATH=$2,790.17) .
According to the theory of Elliott waves , Gold seems to be completing microwave 5 of the main wave 5 . The main wave 5 can be completed in PRZ . ( Of course, if the other wave counting scenario happens, we should have a correction from PRZ ).
I expect Gold to follow the Roadmap I specified in the chart.
Be sure to follow the updated ideas.
Gold Analyze ( XAUUSD ), 1-hour time frame.
Do not forget to put Stop loss for your positions (For every position you want to open).
Please follow your strategy; this is just my idea, and I will gladly see your ideas in this post.
Please do not forget the ✅' like '✅ button 🙏😊 & Share it with your friends; thanks, and Trade safe.

Gold remains bullish, but watch closely 2770 zoneLast week, gold reached a new all-time high of 2,815. However, profit-taking on Friday led to a weekly close below the key 2,800 level.
A few hours ago, as the new week opened, the correction continued, but the price is now starting to recover.
Despite this pullback, the overall trend remains bullish. The key support zone for buyers is between 2,765 and 2,770.
As long as this zone holds, the strategy remains to buy on dips.

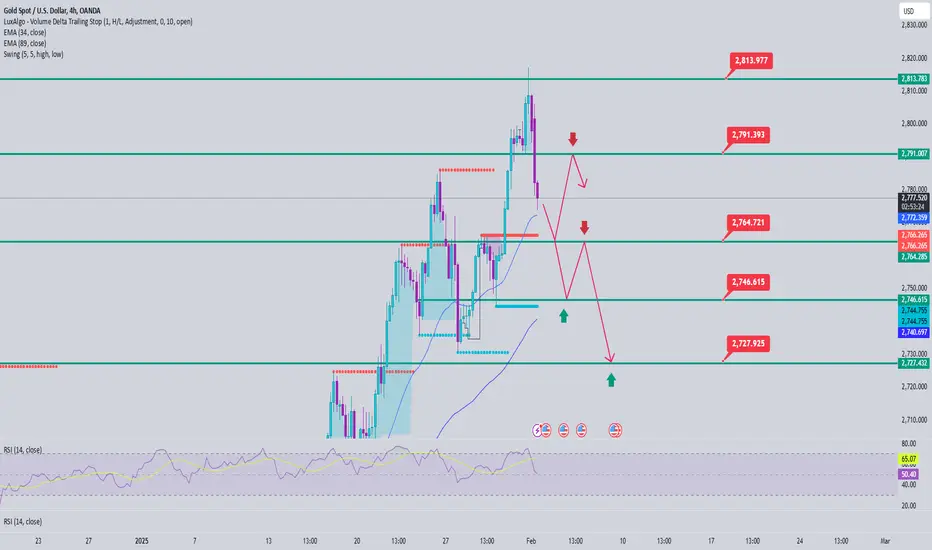
Gold price analysis February 3⭐️Fundamental Analysis
US President Donald Trump imposed 25% tariffs on Canada and Mexico, and 10% on China, starting from 05:01 GMT on Tuesday. The reason is to combat illegal immigration and drug trafficking. Canada and Mexico responded with retaliatory tariffs, while China announced it would file a lawsuit at the World Trade Organization (WTO).
Markets reacted negatively, with the S&P 500 down 1.40% in particular, and money flows into the US dollar instead of gold. However, if China retaliates, gold, which is considered an inflation hedge, could rise. Traders will also pay attention to US and Chinese manufacturing PMI data, along with speeches from the Federal Reserve, which could impact gold prices.
⭐️Technical Analysis
Gold prices were pushed down by sellers around 2777 after hitting an all-time high. The important support of 2765 plays a role in pushing the gold price back to its upward trajectory. When the 2765 zone is broken, pay attention to the next 2 zones around 2746 and 2727. When the uptrend resumes, it will meet the reaction of the sellers around 2791 and the all-time high zone around 2814.
XAUUSD/GOLD WEEKLY PROJECTION 03.02.25Bull markets often occur in a strong or strengthening economy. In addition to employment and profits, when the overall output in an economy grows, it might be reflected in the stock market performance and result in a stock market bull run

Gold- New ATH after correction?On Friday, FOREXCOM:XAUUSD climbed to a high of 2786, just 30 pips below the previous all-time high (ATH).
Currently, the price is in a corrective phase, which could present an opportunity for bulls to enter the market at more favorable levels.
Key confluence support lies around the 2740 zone, which could serve as an attractive entry point. A reversal from this area, followed by a break back above 2760, would indicate the end of the correction and signal the potential for a new ATH.
However, a daily close below 2740 would halt the bullish outlook and suggest caution moving forward.

Gold trading zones: 31-Jan-2025Good morning! Find today's Gold trading zones and enhance your market analysis.

Gold Consolidates - Trying to Return to Bullish Momentum⭐️Smart investment, Strong finance
⭐️GOLDEN INFORMATION:
Gold prices (XAU/USD) edge higher during Thursday’s Asian session but remain range-bound amid mixed market signals. The Federal Reserve’s hawkish pause after its two-day policy meeting strengthens the US Dollar, limiting gold’s upside. However, declining US Treasury yields and concerns over President Donald Trump’s tariff policies provide support for the safe-haven metal.
⭐️Personal comments NOVA:
Gold is mostly sideways below the old ATH 2789, the market is accumulating before wanting to reach a new ATH
⭐️SET UP GOLD PRICE:
🔥SELL GOLD zone: $2784 - $2786 SL $2791
TP1: $2778
TP2: $2770
TP3: $2760
🔥BUY GOLD zone: $2746 - $2748 SL $2743 scalping
TP1: $2752
TP2: $2758
TP3: $2765
🔥BUY GOLD zone: $2731 - $2733 SL $2726
TP1: $2740
TP2: $2750
TP3: $2760
⭐️Technical analysis:
Based on technical indicators EMA 34, EMA89 and support resistance areas to set up a reasonable BUY order.
⭐️NOTE:
Note: Nova wishes traders to manage their capital well
- take the number of lots that match your capital
- Takeprofit equal to 4-6% of capital account
- Stoplose equal to 2-3% of capital account

XAUUSD/GOLD Indecision & Decisive Trading (Short Term)Previously suggested price action worked exactly, achieved falling target 2740 and bounced back to 2765/2766 from 2740/2733 marked support exactly.
Based on fundamental event, investors are adopting cautious approach & we are watching this as indecisiveness on decisive market where bulls have edge on bears.
We are expecting a false breakout/stoploss hunting or liquidity grab kind of scenario developing that is keeping bulls and bears to think what to do on intraday terms however on short term may give good buying opportunity.
Still our ultimate goal is around 2782/2790+.

GOLD Strong Breakout!
HI,Traders !
GOLD is trading in an
Uptrend and has Made a bullish breakout of
The key horizontal level
Of 2763.93 and the breakout
Is confirmed so After retesting the level is broken we are
Bullish biased and we
Will be expecting a further
Bullish move up !
Comment and subscribe to help us grow !

GOLD Resistance Ahead!
HI,Traders !
GOLD is trading in an uptrend but
over the medium term it has formed
a downtrend channel But hit a horizontal
Supply level of 2764.54
From where a local bearish
Correction is to be expected !
Comment and subscribe to help us grow !
