XAUUSD Analysis todayHello traders, this is a complete multiple timeframe analysis of this pair. We see could find significant trading opportunities as per analysis upon price action confirmation we may take this trade. Smash the like button if you find value in this analysis and drop a comment if you have any questions or let me know which pair to cover in my next analysis.
Xauusdsignal

Crazy gold, follow me and make moneyThis week, the market focused on three major issues: Trump's tariff policy, the US-Iran nuclear negotiations and the Fed's interest rate decision. The tariff policy directly pushed up inflation expectations, weakened the purchasing power of the US dollar, and at the same time aggravated the market's risk aversion, which was doubly good for gold. If the US-Iran nuclear negotiations achieve a breakthrough, it may ease the geopolitical tensions in the Middle East and suppress the demand for gold as a safe haven in the short term, but in the long term, if the negotiations are repeated or no substantive agreement is reached, gold is still expected to gain support. In terms of the Fed's interest rate decision, if it maintains a dovish stance, it will further suppress the dollar and support gold.
At the opening of today's market, the gold price directly rose to break through the new high of 3396, and accelerated after breaking the previous high, setting a new historical high again. Both the monthly and weekly charts show a perfect upward trend, and the technical indicators continue to rise. Both the long and medium lines are bullish. At present, the upper resistance is 3396-3400, and the lower support is 3354-3349. The evening operation is recommended to be long on the callback, and the rebound is supplemented by high short.
Operation strategy 1: It is recommended to rebound 3396-3403 short, stop loss 3410, and the target is 3380-3360.
Operation strategy 2: It is recommended to pull back 3355-3350 long, stop loss 3343, and the target is 3380-3400.
"Gold on Fire: Eyeing $3500 After RBR Zone Rebound! "1️⃣ Trend Overview
📈 Strong bullish rally from April 11 to the peak.
📉 Pullback after reaching the recent ATH (All-Time High) zone.
2️⃣ Key Zones
🔵 RBR Zone (Rally-Base-Rally):
Marked support area between $3,271.41 and $3,307.04.
Acts as a buy zone / entry point.
🟣 ATH Zone:
Minor resistance from the recent high.
Price pulled back from here before potentially continuing up.
3️⃣ Entry & Target
✅ Entry Point: Around $3,307.04 (top of RBR zone).
🎯 Target Point: Clearly defined at $3,500.71.
Potential Gain: +188.59 points
ROI: +5.70%
4️⃣ Indicator
📊 EMA (7, close):
Currently at $3,329.09
Price is slightly below EMA = short-term correction or pause.
Strategy Summary
🟢 Buy Setup:
Wait for price to return to RBR zone
Enter long position ✅
Target $3,500 🚀
⚠️ Risk Consideration:
Place stop-loss below RBR zone for safety.

XAUUSD profit analysisGold has been breaking new highs recently. Don't chase the short position blindly. Gold is still strong. Although there is a need for a correction on the technical level, gold has not fallen sharply. It is still mainly long, but don't be blindly long at high levels. It is recommended to wait for a short-term correction before continuing to go long. In the short term, you can pay attention to the 3320-3325 range. You can enter long orders in this area, but you must pay attention to risk management when trading. If there is a loss, you must stop loss in time. Stop loss is also one of the trading techniques. Many people who shorted gold have been trapped or even cleared because they did not set a stop loss account. Don't insist meaninglessly!
I share my market analysis and trading strategies every day. If you are confused about trading, you can take a look. I think it will be helpful to you.

The bull market is not over yet, gold is heading towards 3400Sentiment Misjudgment:
A significant number of market participants misread the price action, anticipating a technical pullback based on historical precedent. However, gold defied expectations, breaking to fresh all-time highs, indicating a departure from traditional market behavior.
Recent Price Performance:
Gold has rallied from $2970 to $3380, registering a $400+ gain, now approaching the critical psychological barrier at $3400, supported by strong momentum.
Macro Drivers:
The global economy is entering a stagflationary phase, with persistently low real interest rates increasing gold’s appeal as an inflation hedge.
Geopolitical tensions are escalating, heightening demand for safe-haven assets.
The U.S. Federal Reserve’s independence is under pressure amid political interference, reinforcing expectations for a policy pivot.
A shift away from the "cash is king" doctrine is emerging, with gold reasserting its role as a store of value in a global rebalancing of capital.
Technical Outlook:
Gold maintains a structurally bullish setup, with key intraday supports at $3365 and $3355. Sustained trading above this zone increases the probability of a breakout toward $3390–$3395, with further upside potential in the U.S. session.
Strategic Recommendations:
Avoid holding long-term short positions against the prevailing trend.
Treat any corrective pullbacks as opportunities for accumulation within a broader bullish cycle.
Use $3360 as the key pivot level, maintaining a buy-on-dip strategy as long as it holds.
Stay disciplined with risk management and be a "friend of the trend"—let time compound the value of correct positioning.

XAUUSD Gold Is Surging: Technical / Macro Analysis & Trade IdeaHey traders! Let’s break down the current price action on Gold (XAUUSD) using both Wyckoff and ICT concepts, and tie it all together with the latest macroeconomic context. 🚀✨
Wyckoff Methodology:
Looking at the 4H chart, we see a classic accumulation phase that transitioned into a strong markup. The recent price action shows a clear spring (liquidity sweep) below previous lows, followed by a sharp bullish move—this is textbook Wyckoff manipulation, where smart money grabs liquidity before driving price higher. The current rally suggests we’re in the markup phase, with demand overwhelming supply.
ICT Concepts:
Liquidity Zones: The chart shows a sweep of liquidity below the recent consolidation, trapping late sellers before a powerful bullish displacement. This is a classic ICT move—liquidity engineered and then swept.
Displacement: The large bullish candle breaking above the previous range signals a market structure shift (MSS) to the upside. This is a strong sign of bullish intent.
Fair Value Gaps (FVG): The impulsive move up has likely left a fair value gap (imbalance) between 3335 and 3385.50. Price may retrace to fill this gap before continuing higher.
Market Structure: The break above the previous swing high confirms a bullish market structure. As long as price holds above the 3335-3340 zone (50% retracement), the bullish bias remains intact.
Technical Trade Setups:
Bullish Scenario: Look for a retracement into the 50-61.8% Fibonacci zone (3335-3323) for potential long entries. If price forms a bullish rejection or bullish engulfing pattern here, it could be a high-probability setup targeting the recent high (3385.50) and the next extension at 3436.
Bearish Scenario: If price fails to hold above 3335 and closes below 3320, we could see a deeper retracement toward 3284 (100% retracement) or even lower, but this is less likely given the current momentum.
Market Sentiment:
Bullish 🟢 – The strong displacement, liquidity sweep, and market structure shift all point to bullish sentiment. Buyers are in control, and any pullbacks into the FVG or key fib levels are likely to be bought up.
Macroeconomic & Fundamental Drivers:
Gold’s rally is being fueled by several key factors:
CPI & Inflation: Recent CPI data shows persistent inflation, increasing demand for gold as an inflation hedge.
Interest Rate Expectations: The market is pricing in potential rate cuts by the Fed later this year, weakening the USD and supporting gold.
Geopolitical Tensions: Ongoing global tensions (e.g., Middle East, Ukraine) are driving safe-haven flows into gold.
USD Strength: Any signs of USD weakness further boost gold’s appeal.
Summary & Trade Plan:
Gold is in a strong bullish phase after a classic liquidity sweep and market structure shift. Watch for retracements into the 3335-3320 zone for potential long setups, with targets at 3385 and 3436. Stay alert for any macro news that could impact sentiment, but for now, the bulls are in control! 🏆📈
Disclaimer:
This is not financial advice. Always do your own research before trading.

XAUUSD/GOLD: What happens when GOLD goes too high?Gold Price Soars Amid Geopolitical Tensions – Is There a Correction Coming?
As political tensions, especially the ongoing trade issues between the US and China, continue.
Showing Gold’s Safe Haven Status in These Uncertain Times.
- What’s Driving This Rise?
With investors always looking for safety and minimal risk, recent news surrounding new tariff threats and diplomatic tensions between the two economic giants has added to the interest in buying gold.
- So, Where Will the Gold Peak Stop? Is 3400 or 3500 .. the Final Peak?
🔼 Key Resistance Levels to Watch Are 3358 and 3380

Gold Hits New ATH Again: Is the Bull Run Unstoppable?After printing a new All-Time High on April 17, Gold entered a brief correction that ended on April 18 at 3285. However, the daily candle closed strong at 3327, right before the long Easter weekend.
Fast forward to Monday's ASIA session open, Gold showed no hesitation and pushed into yet another ATH at 3384.
The bullish momentum is so aggressive that it feels like nothing can stop this trend. While I do expect heavy volatility going forward, the core strategy remains clear:
👉 Buy the dips.
Key Level to Watch:
📍 First support zone = 3350
At this level, I will actively look for long entries, targeting a potential new ATH later this week.
Disclosure: I am part of Trade Nation's Influencer program and receive a monthly fee for using their TradingView charts in my analyses and educational articles.

Multi-dimensional Analysis of Gold's Strength and Volatility RisLong-term drivers: After the breakout of the super-large sideways range from 2020 to 2023, global geopolitical conflicts, expectations of economic recession, and large-scale gold purchases by central banks worldwide have jointly fueled a super bull market.
Short-term disruptions: The tariff policy announced by Trump in early April triggered a short-term sharp decline in gold and silver. However, on the monthly chart, no effective correction signal has been formed, and the trend remains dominated by bulls.
Weekly strong characteristics: The long upper shadow line was engulfed by a bullish candle, forming an ultra-large bullish candle, indicating that the market still chose to break upward despite trade war risks, continuing the super-strong trend. While a correction of hundreds of dollars may occur after extreme market conditions, the current upward trend remains intact.
Medium-term rhythm: Multiple medium-term corrections have ended rapidly, highlighting gold’s extremely strong resilience. The current upward slope is steep , showing a "crazy bull" short-covering feature, making it difficult to predict the top in the short term.
Short-term technical signals: The 4-hour chart shows that the high-level volatility is still confined above the 21 exponential moving average (strong support), indicating a continuation pattern in the uptrend. Two potential paths lie ahead:
- Conventional path: Consolidation into a platform before resuming the upward trend;
- Extreme path: Direct breakout to new highs without correction (referencing the frequent occurrence of non-correction short-covering rallies in recent months).
Conclusion: All timeframes suggest that gold’s rally remains unexhausted, with short-term volatility not altering the medium-to-long-term upward trend. However, risks of extreme volatility caused by policy mutations must be guarded against.
XAUUSD
buy@3300-3310-3320
tp:3340-3355-3370
I hope this strategy will be helpful to you.
When you find yourself in a difficult situation and at a loss in trading, don't face it alone. Please get in touch with me. I'm always ready to fight side by side with you, avoid risks, and embark on a new journey towards stable profits.

4/21 Gold Trading StrategyGood morning, everyone! A brand new week begins—wishing us smooth trades and great success ahead.
Looking back to last Thursday, our gold short strategy hit the mark perfectly. Prices dropped nearly $60 as expected, and we captured around $45 in profit from that move. Overall, we secured over $200 in profit space last week—an excellent performance.
Today, gold opened higher and continues to climb. Technically, bulls still have room to push higher, with 3360 as a key resistance level. However, judging by the current momentum, we may even see a test of 3400. That said, trading is about precision, not perfection. If prices approach 3380 and the upward momentum stalls, it may be time to watch for a pullback. On the other hand, if strength continues, holding some light long positions remains a relatively low-risk strategy.
Trading Strategy for Today:
📉 Sell in the 3380–3410 range
📈 Buy in the 3307–3280 range
🔁 Flexible trades between 3360–3330 / 3272–3315

Gold breaks out strongly and rises, is it an opportunity?The 1-hour moving average of gold continues to form a golden cross and is in a bullish arrangement. Gold rose directly at the opening, breaking through the short-term downward trend and directly breaking through the previous high of 3357. Therefore, the short-term 3357 of gold has formed support. If gold falls back to 3357, continue to buy on dips. However, it should be noted that if gold falls below 3357 again, the adjustment range of gold may increase.
Gold has been rising wildly under the stimulation of recent risk aversion. In this kind of emotional market, we can only follow the trend, because gold continues to hit new highs and no one knows where it will rise. However, don’t easily chase the highs. After the fluctuations increase, the magnitude of each correction will not be small.
Trading idea: Go long near gold 3357, stop loss 3347, target 3380

Gold: Profit on Open, Focus on Key Zones Congrats to everyone who followed my long positions before last Thursday’s market close!
Gold opened higher today, bringing us the first profit of the new week — a great start with accurate direction!
Currently, gold is facing selling pressure near the historical high around 3360. On the 1H chart, technical indicators look solid. Once the pressure is absorbed, there’s a good chance the price may reach new highs today.
However, be cautious: If the upward trend weakens or stalls, there’s a risk of a double top formation — a bearish sign for the bulls.
📌 Key zones to watch today (as marked in the chart):
Support: Around 3308
Resistance: Around 3369
With price at elevated levels, a breakout above resistance often leads to a pullback to retest previous support, so adjust strategies flexibly.
Trading Advice:
Focus on support/resistance flips
Prioritize sell high, buy low within the zone
Manage risk and avoid chasing price blindly

Analysis of Gold Trading Strategies for Next WeekThe current key support level below is the low point of the rebound on Thursday night at the 3,288-3,293 level. If this level is broken at any time next week, the gold price may officially start a correction. At the opening of next Monday, focus on the support level at 3,310-3,315. Pay attention to the short-term high at 3,340-3,345 above. A break above 3,345 will accelerate the rebound to the historical high near 3,357. Be cautious about chasing long positions at high levels.
If the tariff conflict is alleviated next week, gold is unlikely to break through its high again in the short term and will most likely remain in a range-bound oscillation. The operational advice is to go long on pullbacks, with a target of 3,340-3,345. If the position is broken, continue to hold.
XAUUSD trading strategy
buy @ 3210-3215
sl 3180
tp 3235-3240
If you approve of my analysis, you can give it a thumbs-up as support. If you have different opinions, you can leave your thoughts in the comments.

XAUUSD Analysis todayHello traders, this is a complete multiple timeframe analysis of this pair. We see could find significant trading opportunities as per analysis upon price action confirmation we may take this trade. Smash the like button if you find value in this analysis and drop a comment if you have any questions or let me know which pair to cover in my next analysis.

XAU/USD "The Gold" Metal Market Heist Plan (Swing/Day Trade)🌟Hi! Hola! Ola! Bonjour! Hallo! Marhaba!🌟
Dear Money Makers & Robbers, 🤑💰✈️
Based on 🔥Thief Trading style technical and fundamental analysis🔥, here is our master plan to heist the XAU/USD "The Gold" Metal market. Please adhere to the strategy I've outlined in the chart, which emphasizes long entry and short entry. 🏆💸"Take profit and treat yourself, traders. You deserve it!"💪🏆🎉
Entry 📈 :
"The loot's within reach! Wait for the breakout, then grab your share - whether you're a Bullish thief or a Bearish bandit!"
🏁Buy entry above 3070
🏁Sell Entry below 2950
📌However, I recommended to place buy stop for bullish side and sell stop for bearish side.
Stop Loss 🛑: "🔊 Yo, listen up! 🗣️ If you're lookin' to get in on a buy (or) sell stop order, don't even think about settin' that stop loss till after the breakout 🚀. You feel me? Now, if you're smart, you'll place that stop loss where I told you to 📍, but if you're a rebel, you can put it wherever you like 🤪 - just don't say I didn't warn you ⚠️. You're playin' with fire 🔥, and it's your risk, not mine 👊."
🚩Thief SL placed at 2960 (swing Trade Basis) for Bullish Trade
🚩Thief SL placed at 3050 (swing Trade Basis) for Bearish Trade
Using the 4H period, the recent / swing low or high level.
SL is based on your risk of the trade, lot size and how many multiple orders you have to take.
Target 🎯:
🏴☠️Bullish Robbers : TP 3260 (or) Escape Before the Target
🏴☠️Bearish Robbers : TP 2800 (or) Escape Before the Target
⚒💰XAU/USD "The Gold" Metal Market Heist Plan is currently experiencing a neutral to bullish trend,., driven by several key factors.... 👇👇👇
📰🗞️Get & Read the Fundamental, Macro, COT Report, Geopolitical and News Analysis, Sentimental Outlook, Intermarket Analysis, Index-Specific Analysis, Positioning and future trend targets.. go ahead to check 👉👉👉🔗🔗
📌Keep in mind that these factors can change rapidly, and it's essential to stay up-to-date with market developments and adjust your analysis accordingly.
⚠️Trading Alert : News Releases and Position Management 📰 🗞️ 🚫🚏
As a reminder, news releases can have a significant impact on market prices and volatility. To minimize potential losses and protect your running positions,
we recommend the following:
Avoid taking new trades during news releases
Use trailing stop-loss orders to protect your running positions and lock in profits
💖Supporting our robbery plan 💥Hit the Boost Button💥 will enable us to effortlessly make and steal money 💰💵. Boost the strength of our robbery team. Every day in this market make money with ease by using the Thief Trading Style.🏆💪🤝❤️🎉🚀
I'll see you soon with another heist plan, so stay tuned 🤑🐱👤🤗🤩

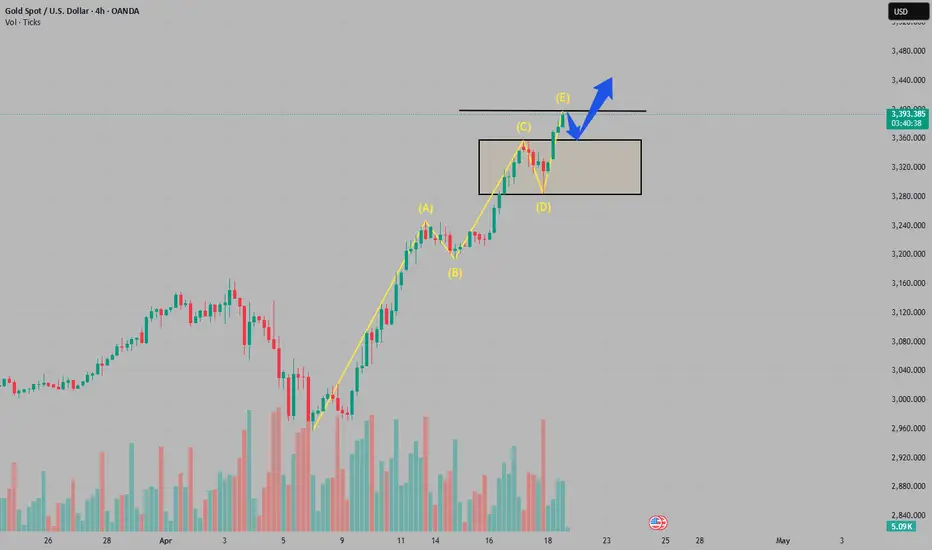
Gold bull cycle continues, 3390
Hello brothers, let's comment on the gold price next week from April 21, 2025 to April 25, 2025
💥 World Situation:
Gold prices are expected to end the year on a strong note, rising more than 2.79%, with the precious metal surging nearly $90 amid continued weakness in the U.S. dollar (USD) due to ongoing global trade uncertainties. At the time of writing, XAU/USD is trading around $3,326.
Despite hitting an all-time high of $3,358, the rally cooled slightly as both European and U.S. markets were closed as traders locked in profits ahead of the extended Easter weekend. Meanwhile, real yields edged higher, offering mild resistance. On the policy front, San Francisco Fed President Mary Daly noted that the U.S. economy remains resilient, even though some areas are showing signs of slowing. She stressed that monetary policy remains tight enough to keep inflation in check, while also hinting that the neutral rate could rise.
✡Summary:
Gold prices are still in a big uptrend, and short-term corrections will only allow gold prices to accumulate further and continue to hit new highs. Tariff tensions continue to cause gold prices to rise strongly: 3382, 3400
🔥 Technical:
According to the resistance and support levels of gold prices on the 4-hour chart, important key areas can be identified as follows:
Resistance: $3357, $3382, $3390
Support: $3284, $3260, $3155
⭐️ Note: Labaron hopes that traders can properly manage their funds
- Choose a lot size that matches your funds
- Profit is 4-7% of the fund account
- Stop loss is 1-3% of the fund account

Gold & The Policy Earthquake: Has the Top Been Set?🌐 1. Macro Landscape & Fundamental Drivers
April 2025 is shaping up to be one of the most volatile months in recent financial memory:
The U.S.-Global trade war is escalating with no signs of cooling. Following widespread tariff hikes by the Trump administration, the EU retaliated with 25% tariffs on U.S. goods, and dozens of nations are reacting in kind. WTO estimates global trade volume will drop by 1% in 2025.
Central banks are pivoting: both the ECB and Bank of England are signaling rate cuts. Morgan Stanley expects the BoE to slash rates down to 3.25% by year-end.
Global equities are under stress: the DAX and CAC40 plunged 4%, while U.S. indices are selling off hard.
💡 OANDA:XAUUSD surged to a record high near $3,360/oz, before pulling back to the current level around $3,327.
📌 Bottom Line – Fundamentals:
Flight to safety is alive and well. However, with gold at record levels and rate expectations shifting rapidly, we may be witnessing a transitional phase – from aggressive bidding to cautious holding.
📉 2. Multi-Timeframe Technical Analysis
🔍 Daily Chart (D1) – Strong Bull Trend, but Warning Signs Ahead
Price trades significantly above the 34, 89, and 200 EMAs – classic uptrend structure.
RSI is at 72.79, indicating overbought territory.
Volume shows signs of tapering off after a major spike – early signs of exhaustion?
🧾 D1 Summary: Momentum remains bullish, but with RSI overheated and volume waning, the rally may pause or retrace in the near term.
🔍 4H Chart (H4) – Entering Distribution Zone
Price has broken out and is now consolidating above prior highs.
All EMAs (34 > 89 > 200) remain bullish.
RSI at 70.24 = overbought, and price action shows indecision (doji, small-bodied candles).
🧾 H4 Summary: This is textbook distribution behavior. Bulls may still be in control, but sellers are testing the water.
🔍 1H Chart (H1) – Short-Term Battle Ground
Current price: $3,327.375
EMAs remain aligned for upside, but price is stalling around resistance.
RSI is neutral at 55.71, suggesting temporary equilibrium.
Volume is declining, hinting that bulls may be losing momentum.
🧾 H1 Summary: Price is consolidating. The next breakout or breakdown will define the short-term direction.
🧠 3. Market Sentiment Overview
🛡 Gold is still the safe-haven of choice, but fresh buying interest is diminishing.
📉 Risk sentiment remains fragile – traders are trimming exposure amid policy uncertainty.
📈 Bond yields are rising again, drawing capital away from gold in the very short term.
🧾 Sentiment Summary: Bulls dominate the narrative, but the crowd is showing signs of hesitation. A healthy pullback wouldn’t be surprising.
🎯 4. Trade Strategy for April 21, 2025 – Two-Sided Plan by Fuinvest
🔻 Scenario A: Short-Term Sell Setup (If price fails to break resistance)
Sell Entry: $3,327 – $3,332
Stop Loss: $3,348
Take Profits:
TP1: $3,313 (EMA34 on H1)
TP2: $3,288 (local demand)
TP3: $3,272 (EMA89 H1)
🧠 Why sell? Overbought RSI, weak volume, and potential distribution suggest a short-term pullback is likely.
🔺 Scenario B: Trend Continuation Buy (If breakout confirmed)
Buy Entry: $3,350 – $3,355 (after H1/H4 closes above $3,348 with volume confirmation)
Stop Loss: $3,327
Take Profits:
TP1: $3,378 (measured move target)
TP2: $3,410 (Fibonacci extension)
TP3: $3,450 (psychological round number)
🧠 Why buy? Trend remains intact. If resistance breaks, it could trigger momentum buying and stop-runs.
💼 Risk Management Tip:
Limit risk to 1–2% per trade.
Use trailing stops once price moves in your favor.
🧾 5. Final Thoughts from Fuinvest
“Gold has rallied in response to deep macro uncertainty, but with record highs comes fragility. The current structure suggests we are at a key decision point: either a clean breakout or a well-needed cooldown. Smart money is watching closely – and so should you.”
📣 Follow Fuinvest for real-time trade analysis, macro commentary, and actionable strategies that help you stay ahead of the market. Don’t just react – anticipate.

The latest trading strategy for gold next weekLast week, gold continued to surge, closing with a large positive weekly candlestick and reaching a new all - time high. In the short term, the price remains strong. Recently, the tariff - related friction has not shown any further obvious escalation, and the market is waiting for new developments and catalysts. In addition, although the Trump administration has been constantly pressuring the Federal Reserve, Powell still maintains a relatively hawkish stance, insisting on waiting for more definitive data before considering adjusting the monetary policy. After digesting the Fed' s statement, the market has no choice but to wait and see. Coupled with the fact that it is 适逢 an American holiday, some long - positions in precious metals have taken profits and left the market. Although there was a decline on Thursday due to profit - taking, gold rebounded quickly and the upward trend remains strong. Going forward, it is advisable to continue the strategy of buying on dips in line with the trend.
buy@3310-3312
sl:3302
tp:3330-3340
The accuracy rate of our daily signals has remained above 98% within a month! 📈 We sincerely welcome you to join our channel and share in the success with us!

Gold prices continue to rise as profit-taking takes place? Will Gold prices fell from an all-time high of $3,357 an ounce after Fed Chairman Powell warned that the Fed's goals could conflict, sparking concerns about stagflation. Regarding trade negotiations, U.S. President Trump said they were progressing well, adding that he was very confident of reaching a trade deal with the European Union and China. This statement has boosted market risk appetite and hit safe-haven gold.
So the previous decline only reflects investors taking profits before the long holiday weekend. However, the weak dollar and trade tensions have kept it above $3,300 an ounce.
Quaid believes that there is no short selling, only longs, and there have been many one-sided markets during this period. Judging from the current trend chart, it is still running upward and has shown signs of rising bottoms, which shows that the bulls have occupied a more advantageous position. If the big positive line continues to break new highs next week, there will be an opportunity to continue to attack 3,400.
For next week, the bullish position of gold retracement is around 3,290.
Quaid wants to say to everyone: Before going out to sea, fishermen don't know where the fish are. But they still choose to go because they believe they will return with a full load. And you, my friend, don't know whether you can make a profit, but you still need to try. Success is not something that will happen in the future, but from the moment you choose and decide to do it, you will gain something if you persist in believing. The same is true for Huang Investment. You may still be confused at the moment, but as long as you persist, the problem will eventually be solved.

Gold: A textbook example of an extreme short squeeze!📌 Gold has surged over $400 in just six trading days—a textbook example of an extreme short squeeze!
Yesterday, gold broke above the 3300 psychological barrier and is now trading above 3360. While safe-haven demand driven by escalating trade tensions is part of the reason, such a rapid and steep rally is clearly unsustainable.
⚠️ If you enter at these levels and get trapped, trying to "hold and hope" could result in facing $100+ of price swings—a dangerous gamble for most traders.
👉 Experienced traders might manage this volatility with scalping or short-term strategies to mitigate losses or even turn a profit.
❌ But if you don’t have that level of skill, don’t chase this rally blindly.
✅ Suggested approach:
Scale into short positions gradually, or
Wait for clear topping signals before going short
Missing this rally isn’t the end—some of the best opportunities come during corrections. Profit potential remains strong on the way down.
🎯 Bearish targets:
Short-term: 3312 → 3291 → 3250
Mid-term: 3196 → 3137

Trading suspension period. What is the future trend of gold?The dollar continues to fall. Fundamentals depend on Sino-US relations and economic data, especially after Powell's speech. The weekly close is close to the support level, and the decline may continue.
Gold recovers after shock. Fundamentals show that prices may continue to rise. The market will be closed for the next three days and traders will take a break. During the holiday, the weekend is full of too many unknowns. But from a technical point of view, the focus is on the medium-term level. Quaid believes that its upward trend is still strong.
If there is no supernatural event during the holiday, gold may rebound from the nearest resistance level in the Asian session and test the trend support level before continuing to rise. If there is any major change in the mood of the country/politicians, I will update my thoughts in time. Give traders time to adjust their positions.

GOLD Resistance Cluster!
HI,Traders !
GOLD made a bullish
Rebound But has now hit a resistance
Cluster of the horizontal and
Falling resistance lines
Around 3335.31 area
From where we will be
Expecting a bearish move down!
Comment and subscribe to help us grow !

Gold Analysis April 17Another day of half-full D candle increase but today there is a bearish wave appearing
The h4 frame has shown signs of sellers jumping into the market and H1 also formed bearish waves.
The bearish wave formed with support 3322. Breaking 3322 is very easy to form a strong bearish wave but the necessary condition is that the 3315 zone will have to be broken. If 3315 increases, 3338 is the zone that the Sellers are also waiting for. 3354-3355 ATH zone will still have a reaction from the Sellers before creating a new ATH.
Trading zone when there is confirmation
Price zones to pay attention to BUY 3315, 3293, 3275
Price zones to pay attention to SELL 3337, 3354
