Gold Completes Wave 4 - Pullback – Time for the Next PushGold ( OANDA:XAUUSD ) touched $3,223 as I expected in the previous idea (Full Target) .
Gold has managed to break the Resistance zone($3,308-$3,293) and is trying to break the Resistance lines and complete the pullback .
In terms of Elliott wave theory , it seems that Gold is completing microwave 4 , which could act as a pullback to the broken Resistance zone($3,308-$3,293) . After the completion of microwave 4 , we should expect Gold to attack the Resistance lines to complete microwave 5 .
I expect Gold to rise to at least $3,232 , and if the Resistance zone($3,387-$3,357) breaks, we can expect further gains .
Note: If Gold touches $2,272 (the worst Stop Loss(SL)), we can expect further declines.
Gold Analyze ( XAUUSD ), 1-hour time frame.
Be sure to follow the updated ideas.
Do not forget to put a Stop loss for your positions (For every position you want to open).
Please follow your strategy; this is just my idea, and I will gladly see your ideas in this post.
Please do not forget the ✅' like '✅ button 🙏😊 & Share it with your friends; thanks, and Trade safe.
Xauusdsignals

Gold (XAU/USD) 3H Chart Analysis – Bullish Setup Toward $3,500 TCurrent Price: $3,254.26
EMA 70: $3,285.50 (Price is below EMA – cautious zone)
Bias: Bullish 📈 (if demand zone holds)
Key Zones:
🟦 Demand Zone: $3,200 – $3,260
✅ Strong buy interest expected here
⚠️ Good place to look for entry signals
🟥 Resistance Zone: $3,223.60 – $3,323.84
🔄 Price is currently testing this zone
A breakout here can lead to bullish momentum
🎯 Target Point: $3,500 – $3,529 💰
📌 Defined as "Target Point 3500"
High potential for profit-taking here
⛔ Stop Loss: $3,161.32
🚫 Placed below demand zone for risk control
❗ Important to exit if price drops here
Trade Idea 💡
📥 Buy Entry: Near or above $3,223.60
✅ Hold as long as price respects demand zone
🎯 Target: $3,500
⛔ Stop Loss: $3,161.32
⚖️ Risk:Reward ratio looks favorable!
Quick Summary:
🟢 Bullish Setup
💪 Demand zone is strong
📈 Breakout above resistance may fuel a rally
⏳ Wait for confirmation before entry!

GOLD (XAUUSD): Trading Plan BEFORE FOMC
Gold bounced yesterday, as I predicted.
Today, we see a retest of a broken daily resistance
that turned into support after a breakout.
BEFORE FED Rate Decision today, there is another opportunity
to buy Gold:
I see a double bottom pattern on an hourly time frame.
Bullish violation of its neckline and an hourly candle close above
3394 will provide a strong intraday confirmation.
It will push the prices at least to 3429 level.
❤️Please, support my work with like, thank you!❤️
I am part of Trade Nation's Influencer program and receive a monthly fee for using their TradingView charts in my analysis.

XAUUSD:Sharing of the Latest Trading StrategyAll the trading signals today have resulted in profits!!! Check it!!!👉👉👉
On Tuesday, gold witnessed a surging rally. It perfectly achieved the feat of "killing both bulls and bears" within the day. Here is the latest trading strategy.
After a significant rally on Monday, gold continued its upward momentum on Tuesday, with the increase approaching the 3,400 mark. The bullish sentiment was extremely high. Leo issued a single trade prompt for VIPs to go short, and suggested going long during the European session when the price pulled back. Both the short and long trades successfully reached the take-profit targets. Currently, judging from the trend, it still remains in a bullish pattern. In the US session, continue to go long at a low level following the trend. Pay attention to the support in the 3,370 area below.
Trading Strategy:
buy@3370-3380
TP:3390-3400
The signals in the Signature have brought about continuous profits, and accurate signals are shared every day. Hurry up and click to get them!
👇 👇 👇 Obtain signals👉👉👉

Gold still has the potential to extend to 3420-3430.Fundamentals:
Focus on the Fed's interest rate decision;
Technical aspects:
Gold rose to 3397 and encountered resistance and fell back, and the bulls' momentum was insufficient. But I think the gold bulls are far more than that. Gold is bound to hit 3400, and even continue to the 3420-3430 area; since gold rebounded after hitting 3200, it has repeatedly built a solid bottom structure support below, and the oscillating rise has effectively supported the continued rebound of gold. As the center of gravity of gold moves up, the support structure also gradually moves up. The current short-term support is in the area around 3380-3370, and the second is in the area of 3365-3355.
Trading situation:
According to today's trading strategy: Go long on gold at 3350 in the morning and around 3375 in the afternoon. In order to lock in profits in time, manually close orders at 3366 and 3394 respectively. Today, the total profit in gold long transactions exceeded 360pips.
Trading strategy:
During the rising shock, there are profit opportunities for both long and short parties in some areas, but currently, overall, bulls have the advantage and are mainly long gold. Consider the opportunity to go long when gold falls back to the area around 3380-3370, TP: 3400.

Buy gold, it will continue to 3350!Fundamentals:
Focus on Trump and the Fed;
Technical aspects:
Currently, gold is moving in a fluctuating upward manner, and in the short term, the effective double bottom structure constructed in the area around 3200 and 3220 supports the continued upward movement of gold. In the short term, gold is not very willing to fall, and it has not even been able to fall back below 3300 again. If gold breaks through the 3330-3335 area during the rebound, then gold will inevitably continue to rise to the area around 3350, or even the area around 3380.
Trading strategy:
If gold retreats next, we will mainly focus on the opportunity to go long on gold in the 3315-3305 area; TP: 3350

Gold is once again affected by tariffs and rises sharplyNews: Gold rose sharply, mainly because Trump announced a 100% tariff on all films produced abroad and entering the United States, which once again triggered global trade tensions. At the same time, the conflict between Russia and Ukraine is still ongoing, and the situation in the Middle East has become tense again. For example, Israel’s missile attacks retaliated against the Houthi armed forces in Yemen and Iran. These have stimulated gold’s safe-haven properties and pushed up gold prices.
Technical aspect: Gold bulls are strong, so there is a certain risk in shorting gold. The point of concern below is the low of 3323. If gold continues to maintain its strength, it is impossible to fall below the 3323 line again.
Trading ideas: Buy gold near 3338, stop loss 3330, target 3360

Start shorting gold and seize the opportunity to make a profit!!Fundamentals:
Focus on Trump and the Fed
Technical aspects:
Gold fell back to around 3253 and then rebounded, and continued to rise to around 3318. The upward momentum in the short term looks particularly strong. According to the current structure, as gold gradually rebounds, off-market buying funds gradually enter the market, pushing gold further up. However, when facing the previous turning point position area of 3325-3335, the market is cautious and it is difficult to break through this area in a short period of time. Therefore, when gold gradually approaches the 3325-3335 area, gold may usher in a wave of retracement in the short term; obviously, the retracement area we can foresee is the 3295-3285 area first.
Trading strategy:
Consider shorting gold in the 3315-3325 area, TP: 3295-3285

Gold has a pressure level of 3397 and a support level of 3368Gold hit a new high, with the high point near 3397. From the gold hourly chart, 3397 is still an obvious pressure, and the support below is around 3368
We can go short around 3397, and then go long when it falls back to 3368

Gold is expected to fall in the short term
Gold rebounded to around 3380, and the K-line decline was inevitable, so there is no doubt that the gold price will fall. The current K-line closed with an upper shadow, which is a sign that the bulls have reached their peak.
Trading ideas: short gold near 3380, stop loss 3390, target 3350

Buy gold, it may continue to rise to 3400-3420!Fundamentals:
Focus on Trump and the Fed’s dynamics;
Technical aspects:
Gold rose to the 3380 area as expected, and even exceeded expectations to 3387. Since gold rebounded near 3222, the willingness to retreat during the rebound was not strong. The lows were constantly raised, and the highs gradually broke upward, which was a very typical shock rise pattern. As the center of gravity of gold shifted upward, the short-term resistance moved up to the 3350-3340 area. Once gold hits this position and rebounds, it may continue to rise to the 3400-3420 area.
Trading strategy:
Consider the opportunity to go long on gold after gold retreats to the 3350-3340 area, TP: 3380

Gold breaks through 3350. Can the bullish pattern continue?In the early Asian session, gold rose rapidly and broke through the 3350 resistance level predicted by Quaid.
Fundamental analysis:
US political developments also add uncertainty to the market. The Trump administration's decision to impose a 100% tariff on imported films shocked the market, and this unpredictable trade policy weakened market confidence. Although the dollar was supported by strong employment data, it still struggled to gain substantial upward momentum, which further supported gold prices.
Economic uncertainty also boosted gold prices. The market generally expects the Federal Reserve to start a rate cut cycle in the near future, which weakens the attractiveness of interest-bearing assets and increases the relative value of non-yielding gold. However, many traders remain cautious and avoid building large positions, waiting for clearer policy signals.
Technical analysis interpretation:
From the monthly chart analysis, gold breaking through the neckline becomes a key trigger point. The pattern measures the depth from the neckline to the bottom of the head and projects it upward, giving a target price range of $3200-3300, which has now been achieved.
In addition, the pattern is not only technically strong, but also psychologically significant. A breakout after a long period of consolidation often attracts new long-term market participants and speculators.
Market Observation:
Current market sentiment is cautiously optimistic. On the one hand, macro uncertainty and risk aversion demand drive funds to the gold market; on the other hand, concerns about the timing and magnitude of the Fed's policy adjustments restrict the willingness of some bulls to take risks.
Quaid Analysis:
Bull Outlook
After the gold price breaks through the 3350 resistance level I predicted, the next target range may point to 3380-3400.
Short Outlook
In the short term, gold may face technical pullback pressure. The main support levels are at 3330 and 3300. If it falls below 3300, it may trigger a deeper pullback to around 3240.
Quaid believes that the market's expectations for the Fed's shift may be too optimistic. If future data show that inflationary pressure remains stubborn or economic resilience exceeds expectations, it may lead to a delay in expectations for rate cuts, thereby putting pressure on gold prices.

XAUUSD Channel Up intact and targeting the 1D MA50.Gold (XAUUSD) has been trading within a Channel Up since the October 30 2024 High and is currently on its latest technical Bearish Leg. The last pull-back tested the 1D MA50 (blue tend-line) before rebounding again.
As you can see the Low that this pull-back made was also on the 0.618 Fibonacci retracement level. On the current Bearish Leg, the 0.618 Fib is at 3155 and can make contact with the 1D MA50 within 1 week. That is our short-term Target, but depending on the Fed Rate Decision on Wednesday, it may be achieved earlier.
-------------------------------------------------------------------------------
** Please LIKE 👍, FOLLOW ✅, SHARE 🙌 and COMMENT ✍ if you enjoy this idea! Also share your ideas and charts in the comments section below! This is best way to keep it relevant, support us, keep the content here free and allow the idea to reach as many people as possible. **
-------------------------------------------------------------------------------
Disclosure: I am part of Trade Nation's Influencer program and receive a monthly fee for using their TradingView charts in my analysis.
💸💸💸💸💸💸
👇 👇 👇 👇 👇 👇

GOLD (XAUUSD): Support & Resistance Analysis For Next Week
Here is my latest structure analysis for Gold.
Resistance 1: 3260 - 3288 area
Resistance 2: 3350 - 3386 area
Resistance 3: 3482 - 3501 area
Support 1: 3191 - 3210 area
Support 2: 3135 - 3167 area
Support 3: 2956 - 2981 area
Consider these structures for pullback/breakout trading.
❤️Please, support my work with like, thank you!❤️
I am part of Trade Nation's Influencer program and receive a monthly fee for using their TradingView charts in my analysis.

Gold's Symmetrical Triangle Near Break – Support Test Imminent!Gold ( OANDA:XAUUSD ) moved as I expected in my previous post and attacked the Support zone($3,282-$3,245) and Support lines for the second time . The question is, can Gold break the Support zone($3,282-$3,245) and Support lines or not!?
Please stay with me .
Gold is moving between Support zone($3,282-$3,245) and Resistance zone($3,386-$3,357) again . In fact, it can be said that Gold has been moving in a range for the past 5-6 days .
From a Classical Technical Analysis perspective, Gold appears to be forming a Symmetrical Triangle Pattern. A break of either line could indicate the next direction for Gold, but since the Symmetrical Triangle Pattern is a Continuation Pattern , the lower line is more likely to break .
In terms of Elliott Wave Theory analysis , it seems that we still have to wait for the next five downwaves .
------------------------------------------
Today, important U.S. data — JOLTS Job Openings and CB Consumer Confidence — will be released.
Let’s quickly review their potential impact on Gold:
JOLTS Job Openings :
If the number comes lower than expected , it signals a weakening labor market, increasing the chances of a dovish Fed → Bullish for Gold .
If the number is stronger than expected , it indicates a robust labor market, pushing the Fed to stay hawkish → Bearish for Gold .
CB Consumer Confidence :
A drop in consumer confidence reflects economic worries , driving demand for safe-haven assets like Gold → Bullish .
A rise in consumer confidence shows economic strength, reducing the appeal of Gold → Bearish .
Historical Impact :
Both indices have caused strong intraday moves in Gold recently, especially if the figures surprise the market.
Summary :
Weak JOLTS and low Confidence → Gold bullish
Strong JOLTS and high Confidence → Gold bearish
Be prepared for high volatility during the releases. Always manage your risk carefully!
------------------------------------------
I expect Gold to attack the Support zone($3,282-$3,245) and Support lines for at least the third time , and if it breaks, the next target could be $3,223 .
Note: If Gold can move above $3,393, we can expect more pumps and maybe make a new All-Time High(ATH).
Gold Analyze ( XAUUSD ), 1-hour time frame.
Be sure to follow the updated ideas.
Do not forget to put a Stop loss for your positions (For every position you want to open).
Please follow your strategy; this is just my idea, and I will gladly see your ideas in this post.
Please do not forget the ✅' like '✅ button 🙏😊 & Share it with your friends; thanks, and Trade safe.

5/2 Gold Trading SignalsI'm very sorry that today's update is a little late because I'm traveling during the holiday. However, I have already told you about the trading strategy yesterday. The market changes are still in line with our expectations. Following the signal of selling in the 3260-3280 range, the returns should be good.
Gold is now falling back. There is support near 3200, but the bears are strong at present, so it is still mainly selling. This decline is expected to fall below 3200, but because of the support, the possibility of a direct break is not very high. If it falls directly, there will definitely be at least one small rebound, roughly around 3210.
So the transaction can be carried out like this:
Buy in the 3194-3185 range
Sell in the 3246-3258 range

XAUUSD Potentially ShortOANDA:XAUUSD Retesting the broken support of the consolidation phase, a close below that area will signify a shorting opportunity.
Fingers crossed

Gold is expected to rebound to the 3270-3275 areaFundamentals:
Focus on today's NFP market;
Technical aspects:
Gold stopped falling near 3200 and gradually rebounded, and has now rebounded to around 3240. As for this round of rebound, I have actually made it clear in my previous opinion that the bulls and bears are wrestling at the 3200 mark, and there will still be repeated in the short term, and after the downward trend slows down, some trapped bulls must have self-rescue behaviors, so it is not surprising that gold has rebounded.
From the current structure, gold has not shown a clear bottoming signal, so the gold rebound is only temporary, and gold will continue to fall after the rebound. From the perspective of frequent switching of intervals, since gold has broken through the area near 3235 during the rebound, the rebound may continue, and is expected to continue to the area near 3270-3275. After breaking through this area, it is even expected to continue to around 3290. This is the position area where we must focus on entering the short position.
Trading strategy:
1. Consider buying gold in the 3235-3230 area, TP: 3245-3255; pay attention to setting protection.
2. Consider selling gold in batches after gold rebounds to the 3270-3275 area, TP: 3240-3230

Try going long gold in small batchesFundamentals:
Focus on US economic data and Fed dynamics;
Technical aspects:
Gold continues to fall and is currently testing the 3200 mark. It is undeniable that gold is currently in a clear bearish trend, and the foreseeable area below is the 3185-3175 area, which is a strong support in the short term. However, the long and short sides are currently wrestling at the 3200 mark, and I think there will still be repetitions in the short term. So gold should rebound before falling to the 3185-3175 area.
Trading strategy:
Consider trying to go long on gold in small batches in the 3210-3200 area, TP: 3220-3230.
Please note: In order to protect the security of the account, as gold rebounds, you can consider gradually moving up the SL to ensure profits.

Gold plummeted as expected. Operation strategy?In my last analysis, Quaid predicted that gold was at risk of falling and breaking.
Quaid promptly told everyone that they could short trade at 3310-3320.
At present, the market situation is basically consistent with Quaid's expectations. As of now, gold has fallen to a low point near 3215. And it has been maintained for some time.
Quaid speculates that gold will continue to maintain a bearish trend and continue to retreat.
Quaid data analysis:
From the hourly chart, gold is currently following a wave trend, and the highest point of 3352 is the starting point of wave A. The high point of wave b is at 3320. If the current 3220 is the beginning of the low point of wave C, then be careful of its continued decline.
Trading strategy:
In terms of the next operation, Quaid suggests waiting for short trading near 3225.
If gold falls below 3210 again, then the bottom can directly look towards the 3190-3200 range.
Quaid warned everyone not to think that the trading range is very large; because the trading markets in some Asian countries are closed, any terrible thing could happen. It is recommended that everyone take profits in time.

The bearish trend is obvious, 3180 is foreseeable!Fundamentals:
Focus on US economic data and Fed dynamics;
Technical aspects:
After gold fell below the recent low support area of 3260, the bearish trend became more obvious. Although gold has stopped falling near 3220, there is no obvious sign of bottoming out. From the current structure, gold still has room to fall, and the area near 3180 can be foreseen in the short term. However, after a sharp drop in gold, there may still be repetitions in the short term, so it is not advisable to over-short gold for the time being. Gold still has the possibility of a short-term rebound to the 3245-3255 area.
Trading strategy:
1. Consider waiting for gold to rebound to the 3245-3255 area before shorting gold; TP: 3235-3225;
2. Consider trying to go long on gold in small batches in the 2330-2320 area, TP: 3245-3255, and then short gold after reaching the target area.

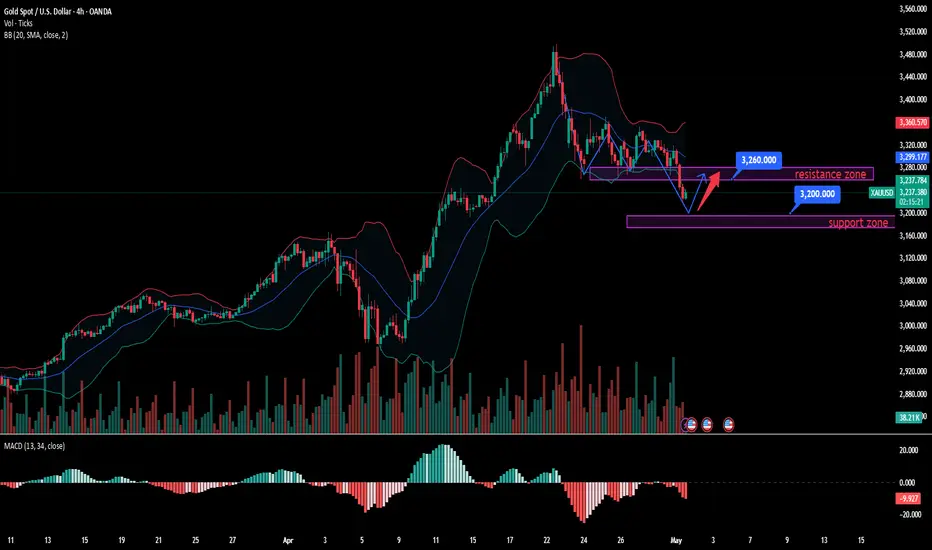
XAUUSD:Sharing of the Latest Trading StrategiesYesterday, catalyzed by the ADP and GDP data, gold rebounded. However, today the United States and Ukraine reached an agreement, and the Trump administration hinted at a possible reduction in tariffs on some trading partners. The market's expectation for the relaxation of the trade situation has increased, leading to a decline in the safe - haven demand for gold. Currently, the key support level has been broken. The support at 3,260 has turned into resistance, and the important technical support below is at 3,220. Above this level, a rebound can be expected. If 3,220 is broken, the strong support at 3,200 will be the next target. But before it is broken, it is advisable to go long. There will be important data such as the non - farm payrolls released on Thursday and Friday. Do not blindly chase the short - side.
The signals in the introduction have brought about continuous profits, and accurate signals are shared every day. Hurry up and click to get them!
👇 👇 👇 Obtain signals👉👉👉
Short gold, gold may continue to fall to 3245-3235Fundamentals:
1. Focus on the performance of US economic data and the dynamics of the Federal Reserve;
2. Pay attention to whether the geopolitical conflicts will escalate, including the situation between India and Pakistan, Russia and Ukraine, and the situation between the United States and Iran, etc.
Technical aspects:
The rebound momentum of gold has gradually weakened, and gold has failed to effectively break through the 3320-3330 resistance zone many times recently, and has built multiple short-term top structures in this area, which has limited the height of gold rebound and further strengthened the bearish sentiment in the market, which is conducive to further decline of gold. In addition, gold has tested the area near 3260 many times, which has weakened the support strength of this area to a certain extent. Gold may fall below this area at any time and continue to the 3245-235 zone.
Trading strategy:
Consider shorting gold again with the 3315-3325 zone as resistance, and expect gold to fall below 3260 and continue to the 3245-3235 zone.
